
Canada’s evolving market for biosimilars and what it means for payers
Presented at ISPOR 2025, May 13–16, 2025 and at the 29th Annual CAPT conference, September 22-23, 2025
Yvonne Zhang
Objective
Potential savings from biosimilars are a topic of international interest with particular relevance for Canada. Given its high-use and high-price market for biologics, increased biosimilar adoption offers a significant opportunity for cost savings for Canadian payers.
Biosimilar switching policies are expected to accelerate cost reductions for biologics in Canada, helping to offset the pressure from new higher-cost medicines. This analysis aims to identify opportunities in the Canadian biosimilar market in comparison with international practices.
Approach
This study compares the evolving Canadian market for biosimilars with international counterparts. It focuses on biosimilar market dynamics in Canada from 2019 to 2023, assessing the impact of biosimilar switching to date and the potential for further cost savings.
Data
- IQVIA’s MIDAS® Database (2014–2023); US Food and Drug Administration (FDA), European Medicines Agency (EMA), and Health Canada (HC) databases: for international comparisons of biosimilar availability, uptake, and sales.
- IQVIA’s Canadian Drugstore and Hospital Purchases Audit (CDH, 2019-2023): for Canadian biosimilar uptake and savings potential.
Results
1. Biologics market trends in Canada and internationally
- Sales of biologic medicines in Canada tripled from $4.9B in 2014 to $15.0B in 2023, representing a 10-year CAGR of 12.9% (Figure 1).
- In 2023 alone, biologics sales increased by 19.9%.
- Biologics accounted for 38.6% of total pharmaceutical sales in Canada in 2023, a higher share than the OECD median of 30.1% (Figure 2).
- Per capita spending on biologics was $381, 80% more than the OECD median of $210, placing Canada second to the U.S.
Figure 1. Sales of biologic medicines in Canada, 2014 to 2023

Figure - Text version
Sales growth, 2022 to 2023: 19.9%
5-year compound annual growth rate: 14.5%
10- year compound annual growth rate: 12.9%
| 2014 | 2015 | 2016 | 2017 | 2018 | 2019 | 2020 | 2021 | 2022 | 2023 | |
|---|---|---|---|---|---|---|---|---|---|---|
Sales in billions of dollars |
$4.9 |
$5.4 |
$6.0 |
$6.7 |
$7.7 |
$8.7 |
$10.0 |
$11.1 |
$12.5 |
$15.0 |
Biologic share of pharmaceutical sales |
24.1% |
24.7% |
25.9% |
27.5% |
30.1% |
32.2% |
33.9% |
34.8% |
35.6% |
38.6% |
Biologic sales per capita |
$141 |
$153 |
$167 |
$185 |
$208 |
$233 |
$262 |
$290 |
$322 |
$381 |
*Six OECD countries with incomplete biologic sales data in 2023 were excluded from the figure.
Data source: IQVIA MIDAS® Database. All rights reserved.
Figure 2. Biologic share of total sales and sales per capita, OECD*, 2023
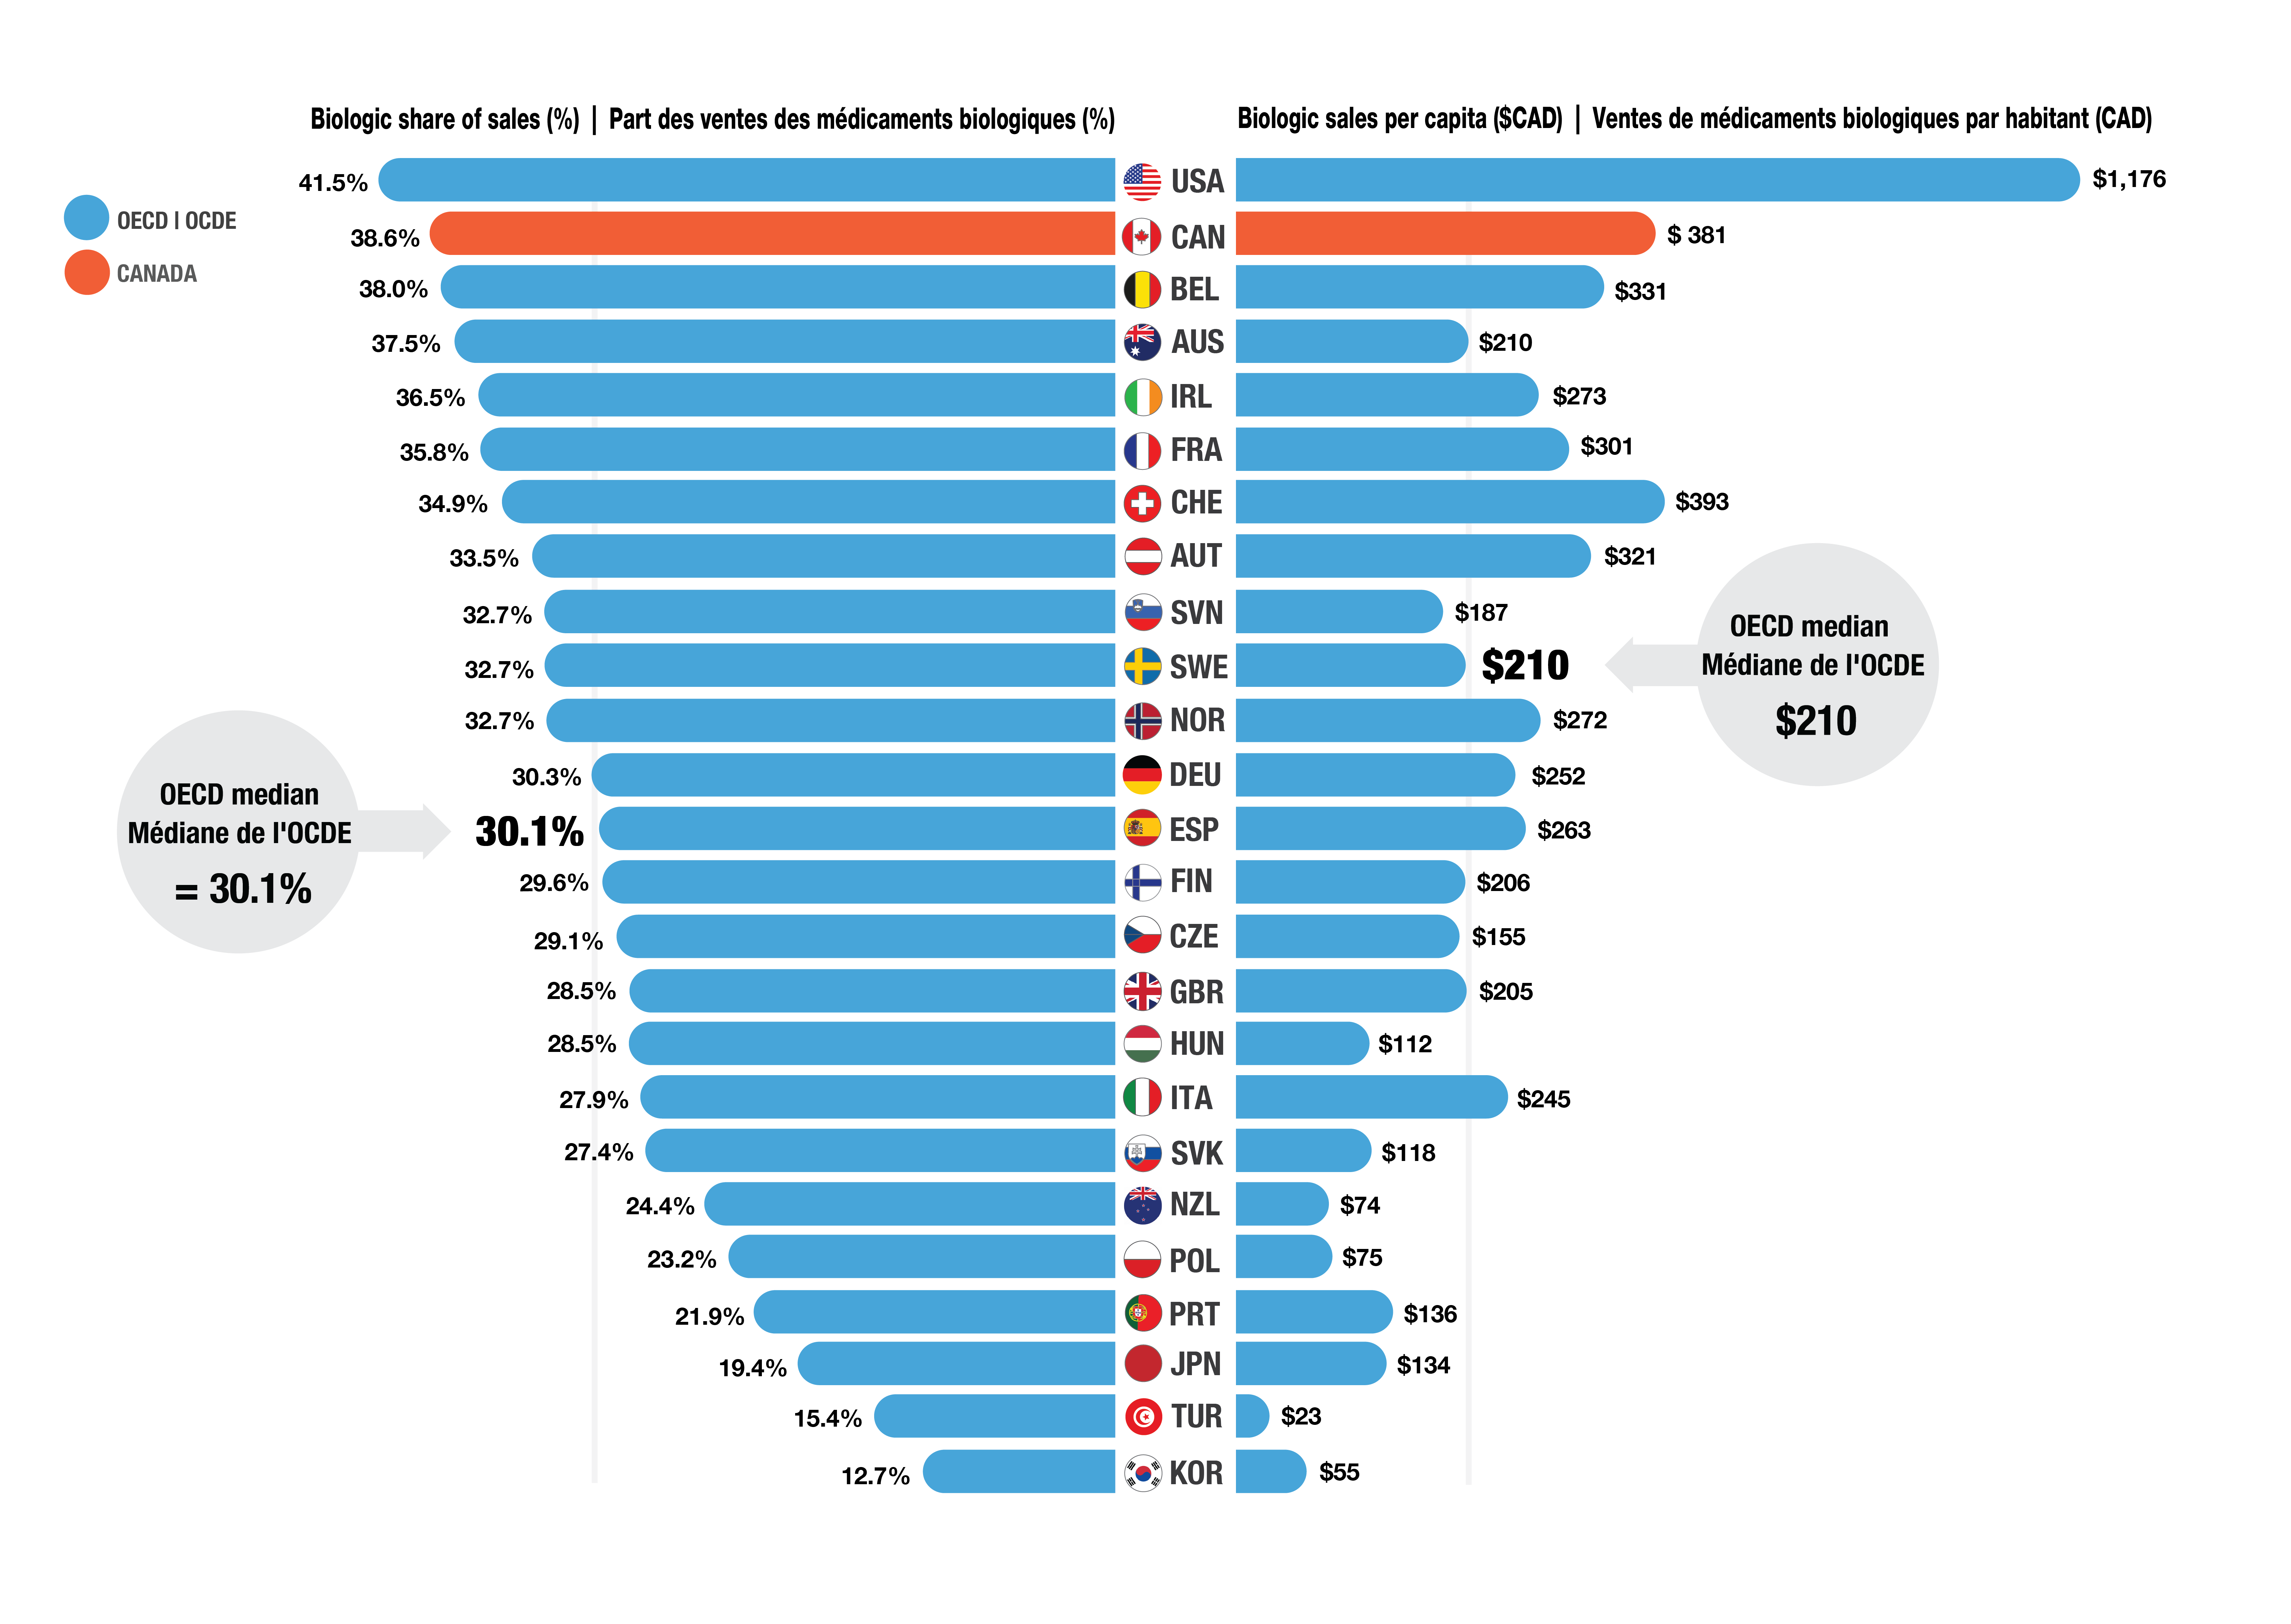
Figure - Text version
| Country | Biologic share of sales as a percentage | Biologic sales per capita in Canadian dollars |
|---|---|---|
US |
41.5% |
$1,176 |
Canada |
38.6% |
$381 |
Belgium |
38.0% |
$331 |
Australia |
37.5% |
$210 |
Ireland |
36.5% |
$273 |
France |
35.8% |
$301 |
Switzerland |
34.9% |
$393 |
Austria |
33.5% |
$321 |
Slovenia |
32.7% |
$187 |
Sweden |
32.7% |
$210 |
Norway |
32.7% |
$272 |
Germany |
30.3% |
$252 |
Spain |
30.1% |
$263 |
Finland |
29.6% |
$206 |
Czechia |
29.1% |
$155 |
United Kingdom |
28.5% |
$205 |
Hungary |
28.4% |
$112 |
Italy |
27.9% |
$245 |
Slovakia |
27.4% |
$118 |
New Zealand |
24.4% |
$74 |
Poland |
23.2% |
$75 |
Portugal |
21.9% |
$136 |
Japan |
19.4% |
$134 |
Turkïye |
15.4% |
$23 |
South Korea |
12.7% |
$55 |
OECD median |
30.1% |
$210 |
*Generally used on a short-term basis.
‡ Mainly indicated in oncology or ophthalmology. Administered in hospitals or clinic setting in Canada.
† Canada is excluded from the median.
Data source: MIDAS® Database, prescription retail and hospital markets, IQVIA. All rights reserved.
2. Biosimilar availability and uptake in Canada and other OECD countries
- As of 2023, biosimilars were approved for 18 distinct biologic medicines in Canada, compared to 22 in the EU and 15 in the U.S.
- Canada achieved biosimilar uptake similar to or above that of the OECD median for most high-selling biologics (Figure 3).
- Infliximab, the highest-selling biologic, had a 59% biosimilar share in Canada in 2023, below the OECD median of 87%.
- Adalimumab, another high-selling biologic medicine, had a 72% biosimilar uptake in Canada in 2023, higher than the OECD median of 56%.
Figure 3. Biologic share of units by medicine, Canada and the OECD, Q4-2023
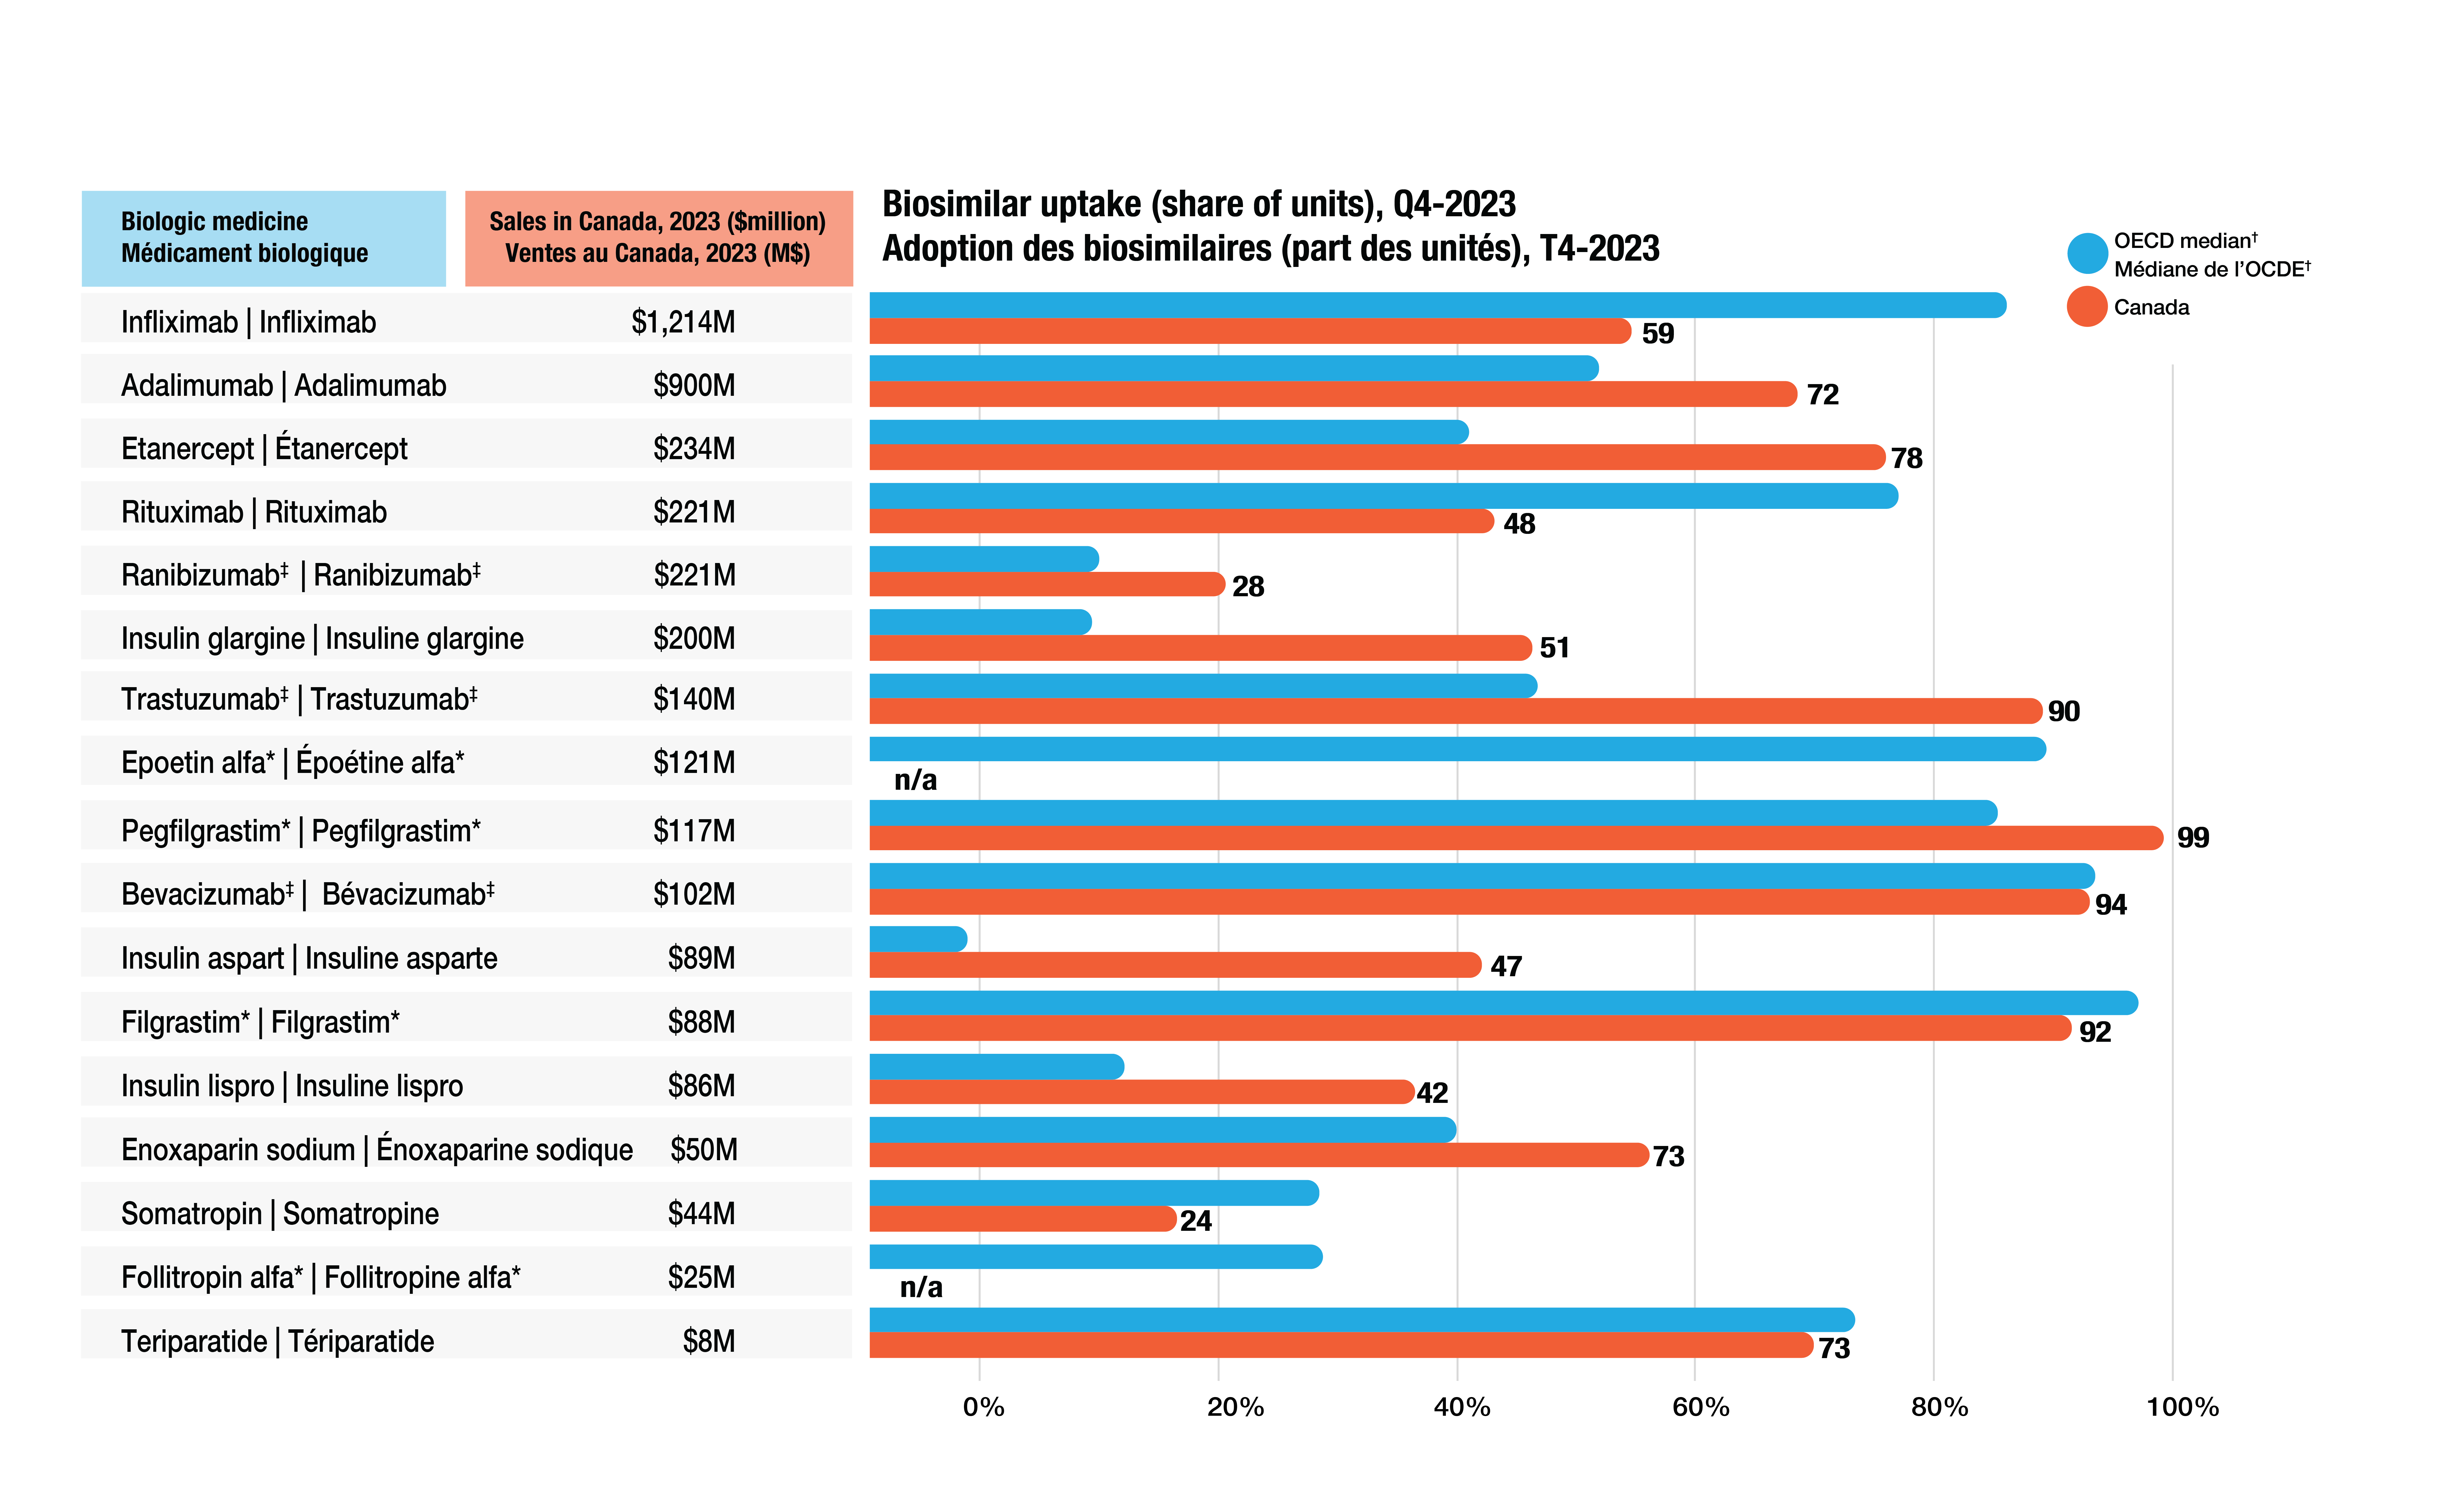
Figure - Text version
| Biologic medicine | Sales in Canada, in millions of dollars, 2023 | Biosimilar uptake as a share of units, fourth quarter of 2023, Canada | Biosimilar uptake as a share of units, fourth quarter of 2023, OECD median |
|---|---|---|---|
Infliximab |
$1,214 |
59% |
87% |
Adalimumab |
$900 |
72% |
56% |
Etanercept |
$234 |
78%
|
47% |
Rituximab |
$221 |
48% |
79% |
Ranibizumab‡ |
$221 |
28% |
18% |
Insulin glargine |
$200 |
51% |
18% |
Trastuzumab‡ |
$140 |
90% |
52% |
Epoetin alfa* |
$121 |
n/a |
90% |
Pegfilgrastim* |
$117 |
99% |
87% |
Bevacizumab‡ |
$102 |
94% |
94% |
Insulin aspart |
$89 |
47% |
8% |
Filgrastim* |
$88 |
92% |
97% |
Insulin lispro |
$86 |
42% |
20% |
Enoxaparin sodium |
$50 |
60% |
46% |
Somatropin |
$44 |
24% |
35% |
Follitropin alfa* |
$25 |
n/a |
35% |
Teriparatide |
$8 |
73% |
76% |
Note: The biosimilar uptake for Canada in Figure 4 differs slightly from the data in Figure 3 for the same products. This is because Figure 4 uses monthly data, while Figure 3 reflects quarterly averages.
Data source: Canadian Drugstore and Hospital Purchases Audit (CDH) databases, IQVIA. All rights reserved.
3. Biosimilar uptake challenges and current policies in Canada
- Unlike traditional generics, biosimilars are not identical to originator biologics. This leads to slower initial uptake despite these products having a highly similar structure, being equally safe, and having the same therapeutic effect as the originator biologic.
- In Canada, switching from originators to biosimilars is not universally mandatory. Decisions depend on the physician, patient, and jurisdictional policies.
- Since May 2019, Canadian payers have launched switching initiatives to increase uptake, led by British Columbia (BC).
- Biosimilars for three widely used anti-TNF-α drugs (adalimumab, infliximab, and etanercept) reached ~90% market share in BC between mid-2020 and late 2021 (Figure 4). National uptake for these medicines gradually rose to 60–80% of units sold by December 2023.
Figure 4. Biosimilar uptake (share of units), Canada and British Columbia, 2019 to 2023

Figure - Text version
| Canada | British Columbia | |||||||||
|---|---|---|---|---|---|---|---|---|---|---|
| Biosimilar uptake by year and month | Infliximab | Etanercept | Adalimumab | Biosimilar uptake by year and month | Infliximab | Etanercept | Adalimumab | |||
2019 |
Jan |
7% |
11% |
- |
- |
2019 |
Jan |
13% |
15% |
- |
Feb |
8% |
12% |
- |
- |
Feb |
15% |
16% |
- |
||
Mar |
8% |
12% |
- |
- |
Mar |
16% |
15% |
- |
||
Apr |
9% |
13% |
- |
- |
Apr |
14% |
18% |
- |
||
May |
9% |
13% |
- |
- |
May |
15% |
18% |
- |
||
Jun |
9% |
14% |
- |
- |
Jun |
18% |
24% |
- |
||
Jul |
10% |
16% |
- |
- |
Jul |
20% |
30% |
- |
||
Aug |
9% |
18% |
- |
- |
Aug |
19% |
39% |
- |
||
Sep |
9% |
19% |
- |
- |
Sep |
22% |
51% |
- |
||
Oct |
11% |
22% |
- |
- |
Oct |
30% |
61% |
- |
||
Nov |
13% |
25% |
- |
- |
Nov |
44% |
73% |
- |
||
Dec |
11% |
25% |
- |
- |
Dec |
45% |
87% |
- |
||
2020 |
Jan |
13% |
28% |
- |
- |
2020 |
Jan |
73% |
90% |
- |
Feb |
15% |
28% |
- |
- |
Feb |
81% |
90% |
- |
||
Mar |
17% |
29% |
- |
- |
Mar |
86% |
89% |
- |
||
Apr |
18% |
31% |
- |
- |
Apr |
88% |
91% |
- |
||
May |
19% |
31% |
- |
- |
May |
92% |
90% |
- |
||
Jun |
21% |
32% |
- |
- |
Jun |
92% |
89% |
- |
||
Jul |
20% |
31% |
- |
- |
Jul |
92% |
87% |
- |
||
Aug |
20% |
33% |
- |
- |
Aug |
91% |
88% |
- |
||
Sep |
21% |
34% |
- |
- |
Sep |
92% |
89% |
- |
||
Oct |
21% |
35% |
- |
- |
Oct |
91% |
88% |
- |
||
Nov |
20% |
36% |
- |
- |
Nov |
91% |
88% |
- |
||
Dec |
21% |
33% |
- |
- |
Dec |
92% |
87% |
- |
||
2021 |
Jan |
24% |
37% |
0% |
- |
2021 |
Jan |
92% |
88% |
0% |
Feb |
23% |
38% |
0.1% |
- |
Feb |
90% |
88% |
0.2% |
||
Mar |
23% |
38% |
3% |
- |
Mar |
90% |
87% |
4% |
||
Apr |
19% |
38% |
1% |
- |
Apr |
88% |
87% |
2% |
||
May |
23% |
40% |
3% |
- |
May |
91% |
88% |
9% |
||
Jun |
25% |
40% |
5% |
- |
Jun |
92% |
88% |
22% |
||
Jul |
26% |
41% |
8% |
- |
Jul |
93% |
86% |
34% |
||
Aug |
25% |
41% |
11% |
- |
Aug |
92% |
87% |
48% |
||
Sep |
25% |
42% |
14% |
- |
Sep |
92% |
87% |
63% |
||
Oct |
27% |
43% |
19% |
- |
Oct |
93% |
88% |
84% |
||
Nov |
26% |
48% |
22% |
- |
Nov |
91% |
91% |
92% |
||
Dec |
29% |
48% |
25% |
- |
Dec |
94% |
89% |
92% |
||
2022 |
Jan |
31% |
50% |
26% |
- |
2022 |
Jan |
89% |
89% |
92% |
Feb |
31% |
54% |
30% |
- |
Feb |
91% |
90% |
92% |
||
Mar |
38% |
54% |
35% |
- |
Mar |
91% |
89% |
91% |
||
Apr |
40% |
58% |
42% |
- |
Apr |
90% |
89% |
92% |
||
May |
43% |
62% |
48% |
- |
May |
91% |
91% |
92% |
||
Jun |
42% |
61% |
51% |
- |
Jun |
92% |
90% |
93% |
||
Jul |
43% |
63% |
53% |
- |
Jul |
90% |
90% |
93% |
||
Aug |
44% |
63% |
51% |
- |
Aug |
89% |
89% |
93% |
||
Sep |
45% |
64% |
53% |
- |
Sep |
90% |
89% |
93% |
||
Oct |
43% |
64% |
54% |
- |
Oct |
89% |
88% |
93% |
||
Nov |
45% |
65% |
54% |
- |
Nov |
93% |
88% |
93% |
||
Dec |
46% |
64% |
57% |
- |
Dec |
90% |
90% |
93% |
||
2023 |
Jan |
45% |
66% |
56% |
- |
2023 |
Jan |
92% |
88% |
93% |
Feb |
47% |
69% |
58% |
- |
Feb |
94% |
90% |
91% |
||
Mar |
47% |
69% |
60% |
- |
Mar |
93% |
90% |
90% |
||
Apr |
50% |
70% |
61% |
- |
Apr |
94% |
87% |
91% |
||
May |
51% |
71% |
63% |
- |
May |
92% |
89% |
91% |
||
Jun |
49% |
74% |
65% |
- |
Jun |
93% |
88% |
91% |
||
Jul |
56% |
75% |
66% |
- |
Jul |
94% |
87% |
91% |
||
Aug |
55% |
76% |
67% |
- |
Aug |
95% |
88% |
91% |
||
Sep |
54% |
76% |
68% |
- |
Sep |
94% |
87% |
90% |
||
Oct |
57% |
77% |
70% |
- |
Oct |
94% |
86% |
90% |
||
Nov |
59% |
79% |
71% |
- |
Nov |
93% |
87% |
90% |
||
Dec |
61% |
80% |
73% |
- |
Dec |
94% |
88% |
91% |
||
Data source: Canadian Drugstore and Hospital Purchases Audit (CDH) databases, IQVIA. All rights reserved.
4. Cost savings opportunities from biosimilars
- As savings from generics decrease, biosimilars play a growing role in offsetting rising drug costs.
- Biosimilar use for three high-selling biologics (adalimumab, infliximab, and etanercept) led to an estimated $1.7B in savings between 2020 and 2023 (Figure 5).
- Canada could have saved an additional $2.2B if the whole country had matched the higher uptake levels observed in BC.
- Uptake has increased across jurisdictions over time. The realized share of potential savings grew from 23% in 2020 to 62% in 2023.
Figure 5. Realized and potential savings from biosimilar use in Canada, 2020 to 2023
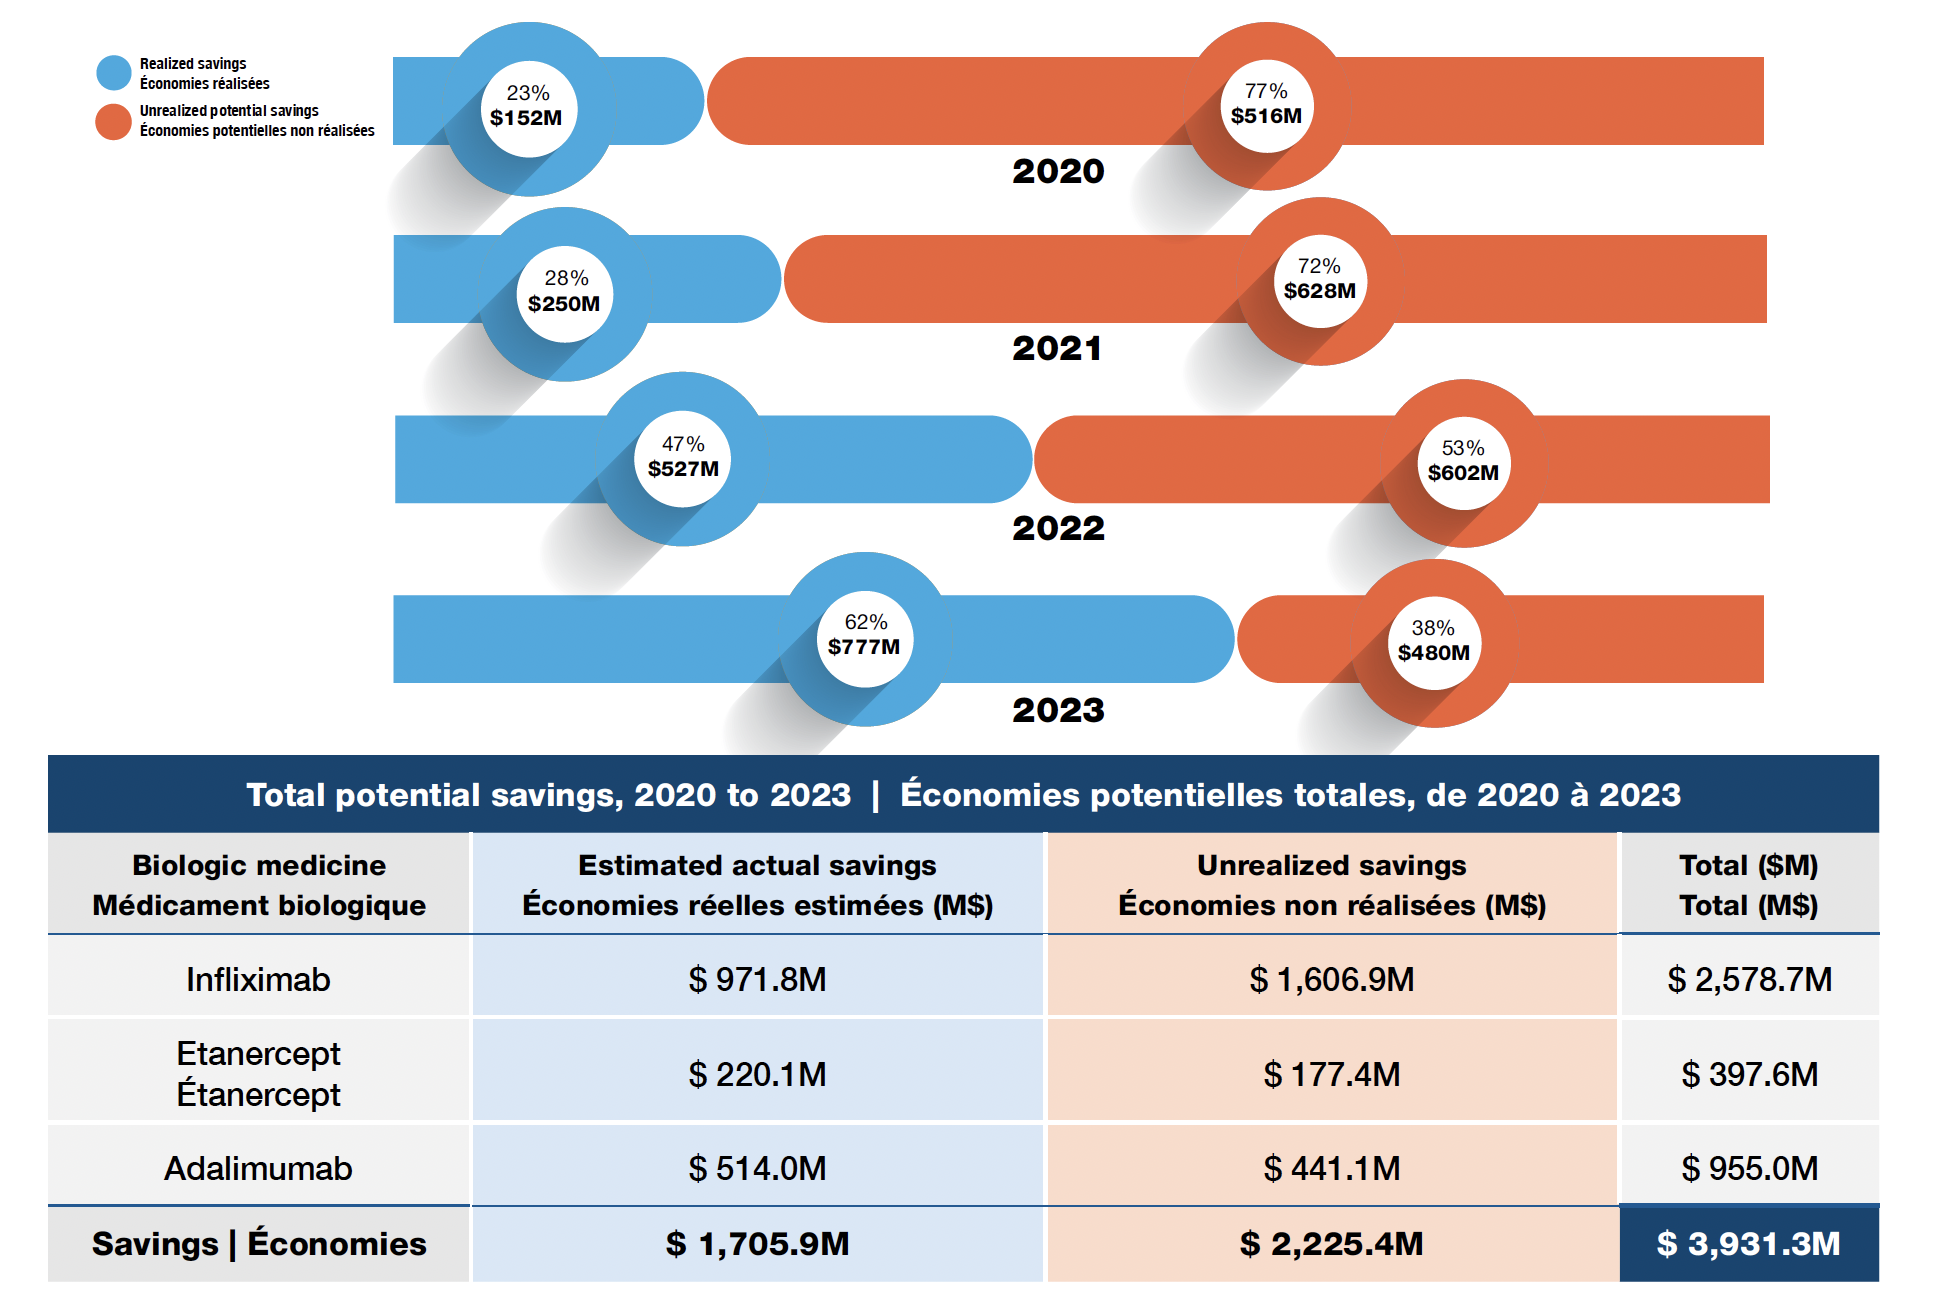
Figure - Text version
| Year | Realized savings from biosimilar use in Canada, in millions of dollars | Unrealized potential savings from biosimilar use in Canada, in millions of dollars | Potential savings from biosimilar use in Canada | Realized share of savings from biosimilar use in Canada | Unrealized potential share savings from biosimilar use in Canada as a share |
|---|---|---|---|---|---|
2020 |
$152 |
$516 |
$669 |
23% |
77% |
2021 |
$250 |
$628 |
$878 |
28% |
72% |
2022 |
$527 |
$602 |
$1,128 |
47% |
53% |
2023 |
$777 |
$480 |
$1,257 |
62% |
38% |
Note: Includes all prescription biologics as per Health Canada’s Drug Product Database (DPD) Schedule D and Prescription lists, as well as insulin biologics.
*Compound annual growth rate.
Data source: IQVIA MIDAS® Database. All rights reserved.
Conclusions
- Biosimilar switching is led by provinces and payers, resulting in varied uptake across jurisdictions in Canada.
- As biosimilar use expanded, the realized savings grew from 23% in 2020 to 62% in 2023.
- With nearly 40% in savings remaining unrealized, broader adoption of biosimilar switching across all payers could further reduce drug spending.
Limitations
This analysis focuses on biologic medicines with sales in the Canadian market. Biologic medicines were selected based on Health Canada’s Drug Product Database (DPD) Schedule D and Prescription lists and include insulin biologics. The cost savings model does not explore the impact of policy changes on biosimilar price levels; prices of biosimilars in the study period were used to calculate cost implications and savings.
Disclaimer
Although based in part on data under license by IQVIA™, the statements, findings, conclusions, views and opinions expressed in this report are exclusively those of the PMPRB.