
Biosimilars in Canada: Policies to Promote Switching and What It Means for Payers
Presentation to the 2023 Annual CAHSPR Conference
May/June 2023
Presented by: Yvonne Zhang, Senior Economist
On this page

Background and Objectives
- In Canada, sales of biologics topped $11 billion in 2021, placing Canada among the top-ranked countries in the Organization for Economic Co-operation and Development (OECD) in terms of per capita spending
- Given the strength of this market, biosimilars offer a significant opportunity for cost savings for Canadian payers
- This presentation compares the emerging Canadian market for biosimilars with our international counterparts
- The analysis delves more deeply into the market dynamics of biosimilars in Canada and assesses the impact of recent biosimilar switching initiatives, highlighting the potential for cost savings
Approach and Data Sources
- This study is part of the PMPRB's broader reporting in the Biologics in Canada chartbook series
- Data sources:
- IQVIA's MIDAS® Database as of 2021 was used to compare the availability, uptake, and sales of biosimilars in Canada to the Organization for Economic Co-operation and Development (OECD) countries
- The market dynamics of biosimilars in Canada up to 2022 and the potential for cost savings were drawn from IQVIA's Canadian Drugstore and Hospital Purchases Audit (CDH)
- Limitations:
- IQVIA CDH data sourced from purchases made directly from the manufacturer or through a wholesaler and may include mark-ups. While MIDAS data is reported at various levels in the distribution chain, NPDUIS reporting is typically based on manufacturer ex-factory list prices. Cash discounts are not captured in these databases.
Overview
- Biologics market trends in Canada and international comparisons
- Biosimilar availability and uptake in Canada vs. other OECD countries
- Biosimilar uptake challenges and current policies
- Cost-saving opportunities from biosimilars
Biologics market trends in Canada and international comparisons
Biologic medicine sales nearly tripled over the last decade
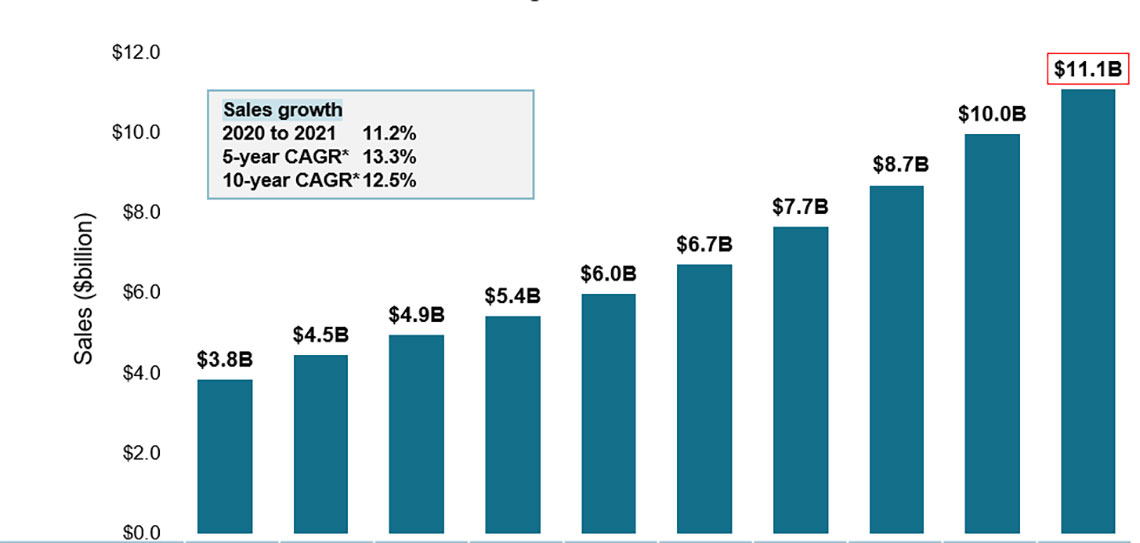
- Biologic medicine sales in Canada nearly tripled over the last 10 years, rising from $3.8B in 2012 to $11.2B in 2021
- This represents a 10-year compound annual growth rate of 12.5%, with a 11.2% increase in the last year
- Sales of biologic medicines accounted for more than 1/3 of pharmaceutical spending in Canada in 2021 and sales per capita reached $290
Figure 1: Sales of biologic medicines in Canada, 2012 to 2021
| - | 2012 | 2013 | 2014 | 2015 | 2016 | 2017 | 2018 | 2019 | 2020 | 2021 |
|---|---|---|---|---|---|---|---|---|---|---|
| Biologic share of pharmaceutical sales | 19.9% | 22.7% | 24.1% | 24.7% | 25.9% | 27.5% | 30.1% | 32.2% | 33.9% | 34.8% |
| Biologic sales per capita | $112 | $129 | $141 | $153 | $167 | $185 | $208 | $233 | $262 | $290 |
Figure 1 - text version
A bar graph depicts the sales growth of biologic medicines in Canada, with annual sales reported in billions of dollars for each year from 2012 to 2021. Below, a table reports the share of biologic sales as a percentage of the total prescription pharmaceutical market for each year, as well as the annual biologic sales per capita. The growth rate in sales from 2020 to 2021 (11.2%) as well as the 5-year (13.3%) and 10-year (12.3%) compound annual growth rates are also given.
Note: Includes all prescription biologics as per Health Canada's Drug Product Database (DPD) Schedule D and Prescription lists, as well as insulin biologics in Canada as of 2020.
Data source: MIDAS® Database, prescription retail and hospital markets, IQVIA. All rights reserved.
Canada placed among the top-ranked countries in the OECD for biologics spending
- In 2021, biologics accounted for 34.8% of pharmaceutical sales in Canada, the 4th highest share in the OECD and exceeding the median of 27.9%
- Canada spends more on biologics per capita than most industrialized countries, with an average of $290 per person in 2021, well above the international median of $174
Figure 2: Biologic share of total sales and sales per capita, OECD*, 2021
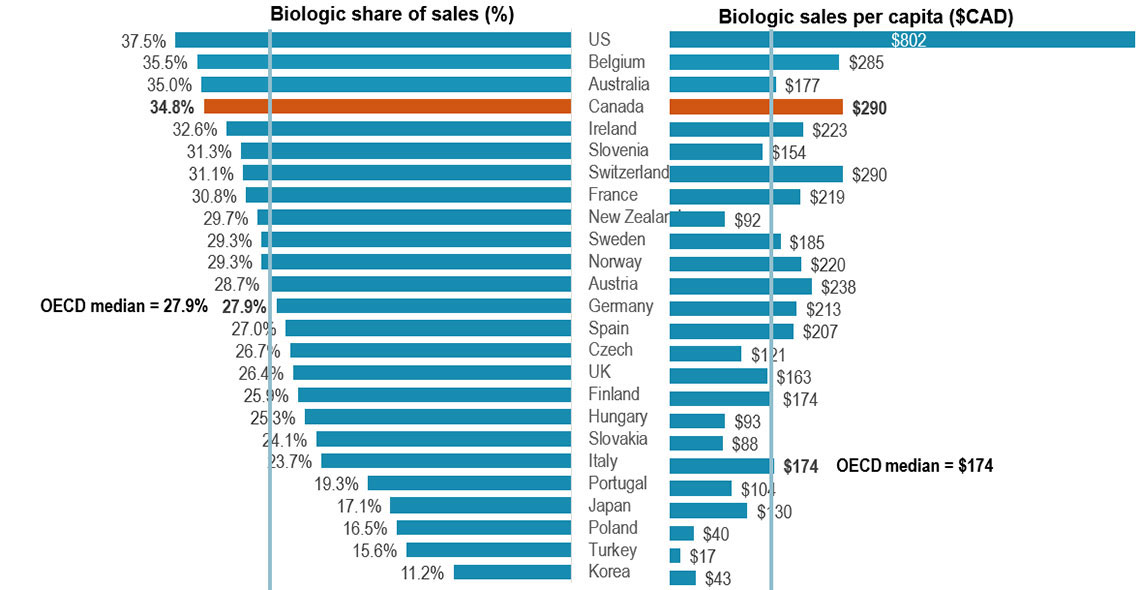
Figure 2 - text version
A split bar graph gives the biologic share of total pharmaceutical sales and biologic sales per capita for each country in the Organisation for Economic Co-operation and Development in 2021. The median share of sales for all countries listed was 27.9% while the median sales per capita was $174.
| Country | Biologic share of sales | Biologic sales per capita |
|---|---|---|
| United States | 37.5% | $802 |
| Belgium | 35.5% | $285 |
| Australia | 35.0% | $177 |
| Canada | 34.8% | $290 |
| Ireland | 32.6% | $223 |
| Slovenia | 31.3% | $154 |
| Switzerland | 31.1% | $290 |
| France | 30.8% | $219 |
| New Zealand | 29.7% | $92 |
| Sweden | 29.3% | $185 |
| Norway | 29.3% | $220 |
| Austria | 28.7% | $238 |
| Germany | 27.9% | $213 |
| Spain | 27.0% | $207 |
| Czechia | 26.7% | $121 |
| United Kingdom | 26.4% | $163 |
| Finland | 25.9% | $174 |
| Hungary | 25.3% | $93 |
| Slovakia | 24.1% | $88 |
| Italy | 23.7% | $174 |
| Portugal | 19.3% | $104 |
| Japan | 17.1% | $130 |
| Poland | 16.5% | $40 |
| Turkey | 15.6% | $17 |
| Korea | 11.2% | $43 |
* Countries with limited sales data were excluded from this analysis.
Note: Includes all prescription biologics as per Health Canada's Drug Product Database (DPD) Schedule D and Prescription lists, as well as insulin biologics in Canada as of 2020.
Data source: MIDAS® Database, prescription retail and hospital markets, IQVIA. All rights reserved.
Biosimilar availability and uptake in Canada vs. other OECD countries
Availability of biosimilars in Canada has increased, without a major impact on overall costs
- Despite an increase in biosimilar approvals in Canada over recent years, Europe continues to lead with the highest in terms of the number of biosimilar approvals
- While the number of biosimilars has increased in Canada, their share of overall biologic sales remains modest, at 7.6% in 2021
Number of medicines* with biosimilars approved in Europe, the US, or Canada, as of 2021
| Biologic Medicine | EMA (n=18) | FDA (n=12) | Health Canada (n=14) |
|---|---|---|---|
| Adalimumab | |||
| Bevacizumab | |||
| Enoxaparin Sodium | - | ||
| Epoetin Alfa | - | ||
| Epoetin Zeta | - | - | |
| Etanercept | |||
| Filgrastim | |||
| Follitropin Alfa | - | - | |
| Infliximab | |||
| Insulin Aspart | - | ||
| Insulin Glargine | |||
| Insulin Lispro | - | ||
| Pegfilgrastim | |||
| Ranibizumab | - | ||
| Rituximab | |||
| Somatropin | |||
| Teriparatide | - | ||
| Trastuzumab | |||
| % Biosimilar sales of overall biologics, 2021 | 15.1% | 4.4% | 7.6% |
* Multiple biosimilar trade names referencing the same originator biologic are counted as one biosimilar medicine.
Data source: US Food and Drug Administration (FDA), European Medicines Agency (EMA), and Health Canada databases;
MIDAS® Database, prescription retail and hospital markets, IQVIA (all rights reserved).
Biosimilar uptake in Canada is moderate compared to other OECD markets for high-selling products
- Canada demonstrates growing use of biosimilars
- Infliximab, the highest-selling biologic and one of the earliest with a biosimilar available in Canada, had a 28% biosimilar share in Canada in 2021, well below the OECD median of 76%
- Adalimumab, the 2nd top-selling biologic medicine in Canada, achieved a sizable uptake of 22% by 2021, with a median uptake of 36% in the OECD
Figure 3: Biosimilar uptake in Canada compared to other OECD markets
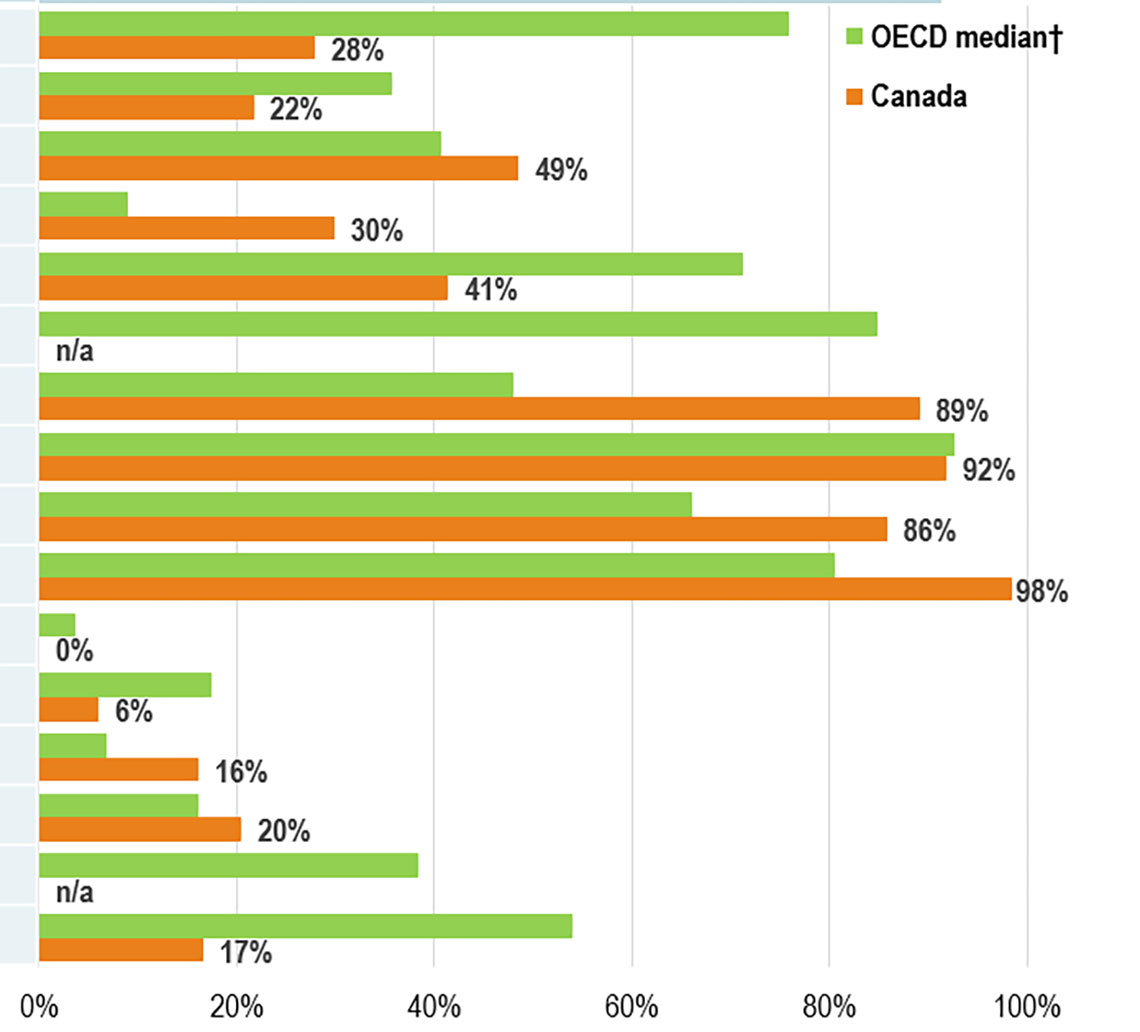
Figure 3 - text version
A bar graph reports the biosimilar uptake, in share of units, for Canada and the Organisation for Economic Co-operation and Development as of the fourth quarter of 2021. The graph compares the uptake for biologic medicines with biosimilar availability in Canada. Results for the OECD are given as a median for all countries, excluding Canada. Total 2021 Canadian sales for each medicine are also given.
| Biologic medicine | Sales in Canada, 2021,in $millions of dollars | Biosimilar uptake, Q4-2021, share of units | |
|---|---|---|---|
| Median OECD | Canada | ||
| Infliximab | $1,262 | 76% | 28% |
| Adalimumab | $969 | 36% | 22% |
| Etanercept | $264 | 41% | 49% |
| Insulin Glargine | $226 | 9% | 30% |
| Rituximab | $222 | 71% | 41% |
| Epoetin alfa* | $116 | 85% | - |
| Trastuzumab☨ | $110 | 48% | 89% |
| Filgrastim* | $98 | 93% | 92% |
| BevacizumabŦ | $98 | 66% | 86% |
| Pegfilgrastim* | $98 | 80% | 98% |
| Insulin Aspart | $92 | 4% | 0% |
| Insulin Lispro | $80 | 17% | 6% |
| Enoxaparin | $63 | 7% | 16% |
| Somatropin | $45 | 16% | 20% |
| Follitropin alfa* | $20 | 38% | - |
| Teriparatide | $11 | 54% | 17% |
- * Generally used to treat acute conditions.
- Ŧ Mainly used for treatment of oncology indications and administrated in hospitals in Canada.
- ☨ Canada is excluded from the median.
Data source: MIDAS® Database, prescription retail and hospital markets, IQVIA (all rights reserved).
Biosimilar uptake challenges and current policies
Many Canadian public drug plans have undertaken or announced initiatives to increase biosimilar uptake as of 2022
Patient switching is a key factor in biosimilar uptake and reflects the polices in the relevant jurisdiction
| Province | Jurisdiction |
|---|---|
| British Columbia | In May 2019, British Columbia became the first Canadian province to initiate a switch to biosimilar medicines for patients covered under the PharmaCare program. Under the Phase 1 & 2 policy initiatives, patients using Enbrel, Remicade, and Lantus for specific indications are required to switch to the biosimilar. The switching policy expanded to Phase 3 & 4 in 2020 and 2021 to include Rituxan and Humira. |
| Alberta | Effective Jan. 2021, Alberta announced that all patients taking Enbrel, Remicade, Lantus, Neupogen, Neulasta, Rituxan, and Copaxone for indications ranging from rheumatoid arthritis to diabetes and multiple sclerosis are required to switch to the biosimilar. This policy has since been expanded to include Humira, Lovenox, and Humalog. |
| Saskatchewan | Effective Oct. 2022, Saskatchewan started to implement mandatory biosimilars switching. The policy affects medications including Humira, Lovenox, Enbrel, Neupogen, Copaxone, Remicade, Rituxan, NovoRapid and Lantus. The list will grow as more biosimilars for reference biologics become available. |
| New Brunswick | Effective Apr. 2021, New Brunswick only reimburses biosimilar versions of approved indications of Humira, Enbrel, Remicade, Lantus, Humalog, Rituxan, Copaxone, and Lovenox. |
| Ontario | Ontario announced their biosimilars switching policy coming into effect from March 31, 2023. This policy affects the following biologics: Copaxone, Enbrel, Humira, Lantus, NovoRapid, Remicade and Rituxan. This list will expand as more biosimilars for originator biologics become available in Canada |
| Quebec | Effective Jul. 2021, the Quebec government announced a non-medical switching policy to require patients covered by the Quebec public drug plan who are treated with biologics drugs to switch to biosimilar versions where available and on an ongoing basis. |
| Nova Scotia | Effective Feb. 2022, Nova Scotia began a non-medical biosimilar switching policy. Medications that require switching to biosimilars: Humira, Enbrel, Remicade, Lantus, Humalog, NovoRapid and Rituxan. The policy will apply to other medications on the Formulary as new biosimilar medications are approved. |
| The Northwest Territories | Effective Dec. 2021, the Government of the Northwest Territories launched a Biosimilars Initiative, individuals on originator biologics must switch to a biosimilar to maintain public coverage. |
| MB, PEI, NL,YT, NIHB | Planning to implement biosimilar switching strategies. |
Cost-saving opportunities from biosimilars
Implemented biosimilar initiatives show positive signs in terms of increased utilization
- Increase in uptake of biosimilars has been observed nationally, with gradual market penetration in recent years
- As ongoing biosimilar switching initiatives are implemented at the jurisdiction level and by payer, Canada offers a unique model to observe the impacts of variations in approach and timing of biosimilar uptake across jurisdictions
- In British Columbia, the first Canadian province to implement a biosimilar switching initiative, biosimilars now account for ~90% of these high-selling biologics markets
Figure 4: Biosimilar uptake (share of units) - Canada
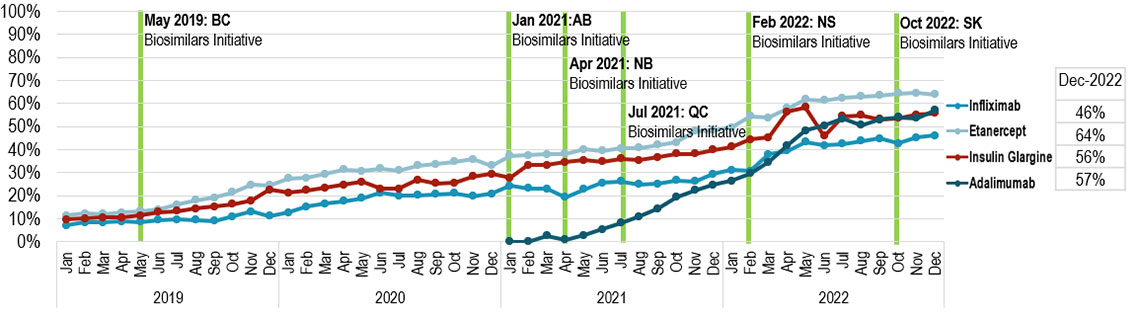
Figure 4 - text version
A line with markers graph shows the uptake of infliximab, etanercept, insulin glargine and adalimumab biosimilars as a share of their respective biologic medicines all units sold in Canada from January 2019 to December 2022. Results are given monthly for this period. The BC Biosimilars Initiative began in May 2019, the AB Biosimilars Initiative started in January 2021, the NB Biosimilar Initiative began in April 2021, the QC Biosimilars Initiative started in July 2021, the NS Biosimilars Initiative started in February 2022 and the SK Biosimilars Initiative started in October 2022.
| Year | Month | Biosimilar share of units sold | |||
|---|---|---|---|---|---|
| Infliximab | Etanercept | Insulin Glargine | Adalimumab | ||
2019 |
Jan |
7% |
11% |
10% |
- |
Feb |
8% |
12% |
10% |
- |
|
Mar |
8% |
12% |
10% |
- |
|
Apr |
9% |
13% |
11% |
- |
|
May |
9% |
13% |
11% |
- |
|
Jun |
9% |
14% |
13% |
- |
|
Jul |
10% |
16% |
13% |
- |
|
Aug |
9% |
18% |
14% |
- |
|
Sep |
9% |
19% |
15% |
- |
|
Oct |
11% |
22% |
16% |
- |
|
Nov |
13% |
25% |
18% |
- |
|
Dec |
11% |
25% |
22% |
- |
|
2020 |
Jan |
13% |
28% |
21% |
- |
Feb |
15% |
28% |
22% |
- |
|
Mar |
17% |
29% |
23% |
- |
|
Apr |
18% |
31% |
25% |
- |
|
May |
19% |
31% |
26% |
- |
|
Jun |
21% |
32% |
23% |
- |
|
Jul |
20% |
31% |
23% |
- |
|
Aug |
20% |
33% |
27% |
- |
|
Sep |
21% |
34% |
25% |
- |
|
Oct |
21% |
35% |
25% |
- |
|
Nov |
20% |
36% |
28% |
- |
|
Dec |
21% |
33% |
29% |
- |
|
2021 |
Jan |
24% |
37% |
28% |
0% |
Feb |
23% |
38% |
33% |
0% |
|
Mar |
23% |
38% |
33% |
3% |
|
Apr |
19% |
38% |
34% |
1% |
|
May |
23% |
40% |
35% |
3% |
|
Jun |
25% |
40% |
35% |
5% |
|
Jul |
26% |
41% |
36% |
8% |
|
Aug |
25% |
41% |
35% |
11% |
|
Sep |
25% |
42% |
37% |
14% |
|
Oct |
27% |
43% |
38% |
19% |
|
Nov |
26% |
48% |
38% |
22% |
|
Dec |
29% |
48% |
40% |
25% |
|
2022 |
Jan |
31% |
50% |
41% |
26% |
Feb |
31% |
54% |
44% |
30% |
|
Mar |
38% |
54% |
45% |
35% |
|
Apr |
40% |
58% |
56% |
42% |
|
May |
43% |
62% |
58% |
48% |
|
Jun |
42% |
61% |
46% |
51% |
|
Jul |
43% |
63% |
54% |
53% |
|
Aug |
44% |
63% |
55% |
51% |
|
Sep |
45% |
64% |
53% |
53% |
|
Oct |
43% |
64% |
54% |
54% |
|
Nov |
45% |
65% |
55% |
54% |
|
Dec |
46% |
64% |
56% |
57% |
|
Figure 5: Biosimilar uptake (share of units) – British Columbia

Figure 5 - text version
A line with markers graph shows the uptake of infliximab, etanercept, insulin glargine and adalimumab biosimilars as a share of their respective biologic medicines all units sold in British Columbia from January 2019 to December 2022. Results are given monthly for this period. Phase I of the Biosimilars Initiative for Enbrel, Remicade and Lantus began in May 2019, followed by Phase II for Remicade started in September 2019. Phase IV for Humira started in April 2021.
| Year | Month | Biosimilar share of units sold | |||
|---|---|---|---|---|---|
| Infliximab | Etanercept | Insulin Glargine | Adalimumab | ||
| 2019 | |||||
| Jan | 13% | 15% | 10% | - | |
| Feb | 15% | 16% | 11% | - | |
| Mar | 16% | 15% | 11% | - | |
| Apr | 14% | 18% | 11% | - | |
| May | 15% | 18% | 14% | - | |
| Jun | 18% | 24% | 22% | - | |
| Jul | 20% | 30% | 25% | - | |
| Aug | 19% | 39% | 29% | - | |
| Sep | 22% | 51% | 36% | - | |
| Oct | 30% | 61% | 45% | - | |
| Nov | 44% | 73% | 53% | - | |
| Dec | 45% | 87% | 74% | - | |
| 2020 | |||||
| Jan | 73% | 90% | 73% | - | |
| Feb | 81% | 90% | 74% | - | |
| Mar | 86% | 89% | 76% | - | |
| Apr | 88% | 91% | 77% | - | |
| May | 92% | 90% | 77% | - | |
| Jun | 92% | 89% | 79% | - | |
| Jul | 92% | 87% | 78% | - | |
| Aug | 91% | 88% | 81% | - | |
| Sep | 92% | 89% | 79% | - | |
| Oct | 91% | 88% | 79% | - | |
| Nov | 91% | 88% | 80% | - | |
| Dec | 92% | 87% | 82% | - | |
| 2021 | |||||
| Jan | 92% | 88% | 80% | 0% | |
| Feb | 90% | 88% | 84% | 0% | |
| Mar | 90% | 87% | 83% | 4% | |
| Apr | 88% | 87% | 81% | 2% | |
| May | 91% | 88% | 83% | 9% | |
| Jun | 92% | 88% | 82% | 22% | |
| Jul | 93% | 86% | 82% | 34% | |
| Aug | 92% | 87% | 82% | 48% | |
| Sep | 92% | 87% | 83% | 63% | |
| Oct | 93% | 88% | 83% | 84% | |
| Nov | 91% | 91% | 82% | 92% | |
| Dec | 94% | 89% | 85% | 92% | |
| 2022 | |||||
| Jan | 89% | 89% | 82% | 92% | |
| Feb | 91% | 90% | 84% | 92% | |
| Mar | 91% | 89% | 83% | 91% | |
| Apr | 90% | 89% | 88% | 92% | |
| May | 91% | 91% | 90% | 92% | |
| Jun | 92% | 90% | 81% | 93% | |
| Jul | 90% | 90% | 86% | 93% | |
| Aug | 89% | 89% | 86% | 93% | |
| Sep | 90% | 89% | 87% | 93% | |
| Oct | 89% | 88% | 86% | 93% | |
| Nov | 93% | 88% | 87% | 93% | |
| Dec | 90% | 90% | 87% | 93% | |
Data source: Canadian Drugstore and Hospital Purchases Audit (CDH) databases, IQVIA (all rights reserved).
Canadians are realizing a growing fraction of the potential savings from biosimilars
- National market penetration in line with the results seen in British Columbia may have significant cost implications for Canadian payers
- Biosimilars of four high-selling biologics targeted by the Biosimilars Initiative (infliximab, etanercept, insulin glargine 100IU and adalimumab) saved Canadians an estimated $990 million over 3 years (2020 – 2022)
- If national uptake for these biosimilars had followed the trends in British Columbia, additional savings of nearly $1.8 billion would have been attained from 2020 to 2022
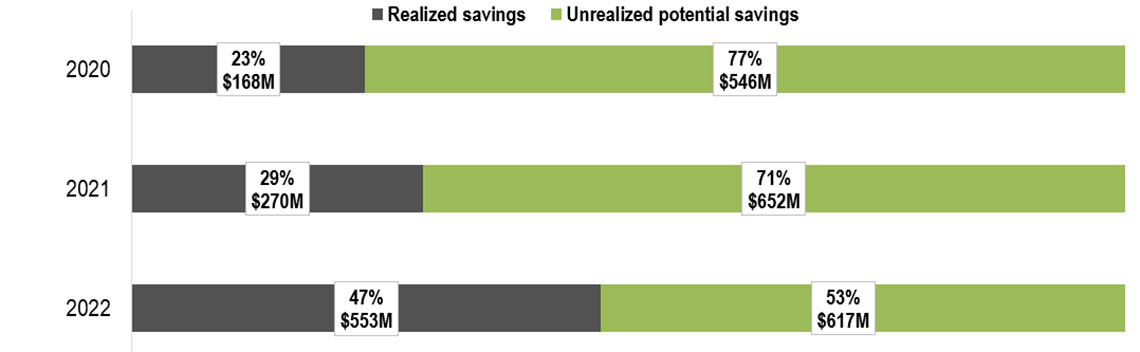
Figure 6: Realized and potential savings from biosimilar use in Canada, 2020 to 2022
| Biologic medicine | Potential savings in 2020 | Potential savings in 2021 | Potential savings in 2022 | ||||||
|---|---|---|---|---|---|---|---|---|---|
| Estimated actual savings | Unrealized savings | Total | Estimated actual savings | Unrealized savings | Total | Estimated actual savings | Unrealized savings | Total | |
| Infliximab | $118.9M | $452.2M | $571.1M | $169.5M | $460.5M | $630.0M | $286.3M | $370.2M | $656.4M |
| Etanercept | $33.4M | $64.2M | $97.6M | $42.1M | $51.7M | $93.8M | $55.2M | $34.1M | $89.3M |
| Insulin glargine | $15.4M | $29.5M | $44.9M | $20.2M | $24.7M | $44.9M | $26.1M | $15.7M | $41.8M |
| Adalimumab | - | - | - | $38.3M | $115.5M | $153.8M | $185.1M | $197.5M | $382.5M |
| Savings | $167.7M | $545.9M | $713.6M | $270.0M | $652.4M | $922.4M | $552.6M | $617.4M | $1,170.0M |
Figure 6 - text version
A horizontal bar graph shows the difference between realized and unrealized potential savings from increased biosimilar uptake of infliximab, etanercept, insulin glargine and adalimumab in Canada in 2020, 2021 and 2022. Results are given as a percentage of the total potential savings and as a dollar amount.
In 2020, realized savings amounted to $168 million (or 23% of total potential savings), leaving $546 million (77%) in unrealized potential savings.
In 2021, realized savings amounted to $270 million (or 29% of total potential savings), leaving $652 million (71%) in unrealized potential savings.
In 2022, realized savings amounted to $553 million (or 47% of total potential savings), leaving $617 million (53%) in unrealized potential savings.
Conclusions
- Biologics are a high-growth market segment in Canada, with sales tripling over the last decade
- Availability of biosimilars in Canada has increased recently, without a major impact on overall costs
- Biosimilars uptake for high-selling products in Canada is moderate compared to other OECD markets
- There are ongoing initiatives to encourage greater biosimilar uptake nationwide
- The potential savings offered by biosimilars are significant in Canada