
Canada’s Evolving Market for Biosimilars and What It Means for Payers
Introduction
Potential savings from biosimilars are a subject of keen interest internationally, with a particular relevance for Canadians. Given the high use and cost of biologics in Canada, the increased use of biosimilars offers a significant opportunity for cost savings for Canadian payers.
Unlike small molecule medicines, which experience a relatively quick market adjustment after generic entry, most originator biologics in Canada continue to dominate the market after the introduction of a biosimilar. This, in turn, limits the savings for Canadian payers and their potential ability to fund new therapies that enter the market with increasingly high prices.
Recent policy changes to promote biosimilar switching are expected to result in significant cost reductions for relevant classes of biologics in Canada, helping to offset the pressure from new higher-cost medicines in coming years.
This analysis compares the emerging Canadian market for biosimilars with our international counterparts and assesses the impact of the recent biosimilar switching initiatives, highlighting the potential for cost savings in Canada. IQVIA’s MIDAS® Database as of 2020 was used to compare the availability, uptake, and sales of biosimilars in Canada to the Organization for Economic Co-operation and Development (OECD) countries. The market dynamics of biosimilars in Canada in 2020 and 2021 and the potential for cost savings were drawn from IQVIA’s Canadian Drugstore and Hospital Purchases Audit (CDH).
Results
Biologics market trends in Canada and international comparisons
Sales of biologic medicines in Canada have tripled over the last decade, rising from $3.3 billion in 2011 to $10.0 billion in 2020. This represents a 10-year compound annual growth rate of 13.2%, with a 14.6% increase in 2020 alone.
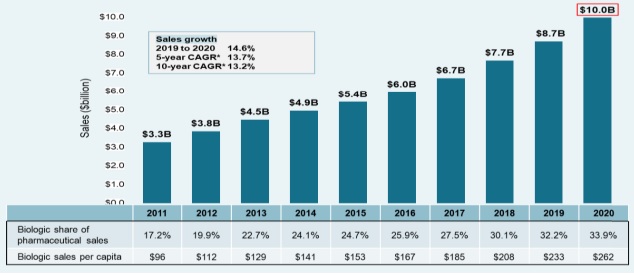
Figure description
A bar graph depicts the sales growth of biologic medicines in Canada, with annual sales reported in billions of dollars for each year from 2011 to 2020. Below, a table reports the share of biologic sales as a percentage of the total prescription pharmaceutical market for each year, as well as the annual biologic sales per capita. The growth rate in sales from 2019 to 2020 (14.6%) as well as the 5-year (13.7%) and 10-year (13.2%) compound annual growth rates are also given.
| 2011 | 2012 | 2013 | 2014 | 2015 | 2016 | 2017 | 2018 | 2019 | 2020 | |
|---|---|---|---|---|---|---|---|---|---|---|
Canadian sales in billions of dollars |
$3.3 |
$3.8 |
$4.4 |
$4.9 |
$5.4 |
$6.0 |
$6.7 |
$7.7 |
$8.7 |
$10.0 |
Biologic share of pharmaceutical sales |
17.2% |
19.9% |
22.7% |
24.1% |
24.7% |
25.9% |
27.5% |
30.1% |
32.2% |
33.9% |
Biologic sales per capita |
$96 |
$112 |
$129 |
$141 |
$153 |
$167 |
$185 |
$208 |
$233 |
$262 |
Canada spends more on biologics per capita than almost all other industrialized countries. In 2020, biologics accounted for 33.9% of pharmaceutical sales in Canada, the third-highest share in the OECD and exceeding the median of 27.4%. Canadians spent an average of $262 per person on biologic medicines in the same year, well above the international median of $156. This placed Canada fourth among the OECD countries in terms of per capita sales.
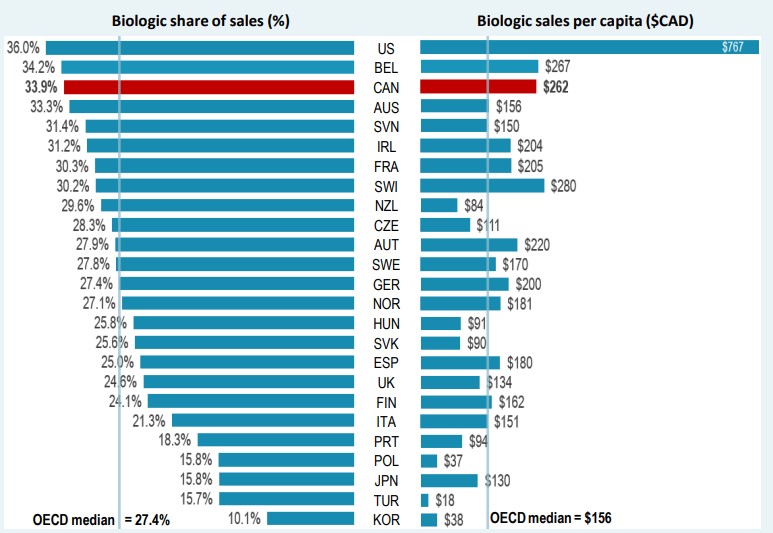
* Countries with limited sales data were excluded from this analysis.
Figure description
A split bar graph gives the biologic share of total pharmaceutical sales and biologic sales per capita for each country in the Organisation for Economic Co-operation and Development in 2020. Sales are listed in Canadian dollars. The median biologic share of sales for all countries listed was 27.4%, while the median biologic sales per capita was $156.
| Country | Biologic share of sales | Biologic sales per capita |
|---|---|---|
United States |
36.0% |
$767 |
Belgium |
34.2% |
$267 |
Canada |
33.9% |
$262 |
Australia |
33.3% |
$156 |
Slovenia |
31.4% |
$150 |
Ireland |
31.2% |
$204 |
France |
30.3% |
$205 |
Switzerland |
30.2% |
$280 |
New Zealand |
29.6% |
$84 |
Czechia |
28.3% |
$111 |
Austria |
27.9% |
$220 |
Sweden |
27.8% |
$170 |
Germany |
27.4% |
$200 |
Norway |
27.1% |
$181 |
Hungary |
25.8% |
$91 |
Slovakia |
25.6% |
$90 |
Spain |
25.0% |
$180 |
United Kingdom |
24.6% |
$134 |
Finland |
24.1% |
$162 |
Italy |
21.3% |
$151 |
Portugal |
18.3% |
$94 |
Poland |
15.8% |
$37 |
Japan |
15.8% |
$130 |
Turkey |
15.7% |
$18 |
South Korea |
10.1% |
$38 |
Biosimilar availability and uptake in Canada and other OECD countries
Despite an increase in biosimilar approvals in Canada over recent years, Europe continues to lead with the highest in terms of the number of biosimilar approvals. As of the end of 2020, biosimilars for 14 distinct biologic medicines were approved by Health Canada, compared to 17 by the European Medicines Agency (EMA) and 12 by the US Food and Drug Administration (FDA).
For distinct biologic molecules with biosimilars approved and sold across the OECD, biosimilar uptake in Canada is moderate compared to international markets, particularly for high-selling products. Infliximab, the top-selling biologic and one of the earliest with a biosimilar available in Canada, had a 20% biosimilar share in Canada in 2020, well below the OECD median of 73%. Adalimumab, the second highest-selling biologic medicine, had no recorded biosimilar sales in Canada in 2020 and a median biosimilar uptake of 28% in the OECD.
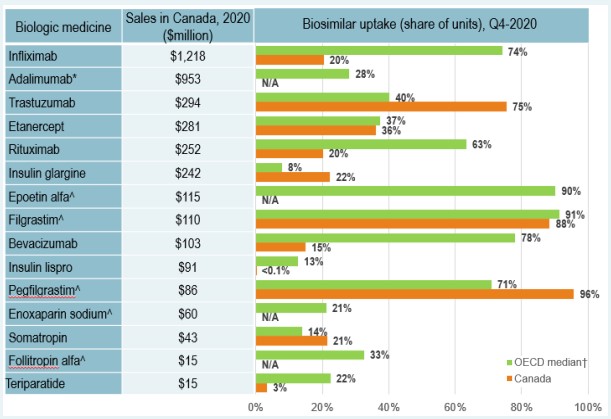
* In 2018 Adalimumab biosimilar was approved in Canada, with sales starting in February 2021. Therefore, no uptake is captured in the figure.
^ Acute biologics.
† Canada is excluded from the median.
Figure description
A bar graph reports the biosimilar uptake, in share of units, for Canada and the Organisation for Economic Co-operation and Development (OECD) as of the fourth quarter of 2020. The graph compares the uptake for biologic medicines with biosimilar availability in Canada. Results for the OECD are given as a median for all countries, excluding Canada. Total 2020 Canadian sales for each medicine are also given.
| Biologic medicine | Sales in Canada, 2020, in millions of dollars | Biosimilar uptake, Q4-2020, share of units | |
|---|---|---|---|
| Median OECD | Canada | ||
Infliximab |
$1,218 |
74% |
20% |
Adalimumab |
$953 |
28% |
— |
Trastuzumab |
$294 |
40% |
75% |
Etanercept |
$281 |
37% |
36% |
Rituximab |
$252 |
63% |
20% |
Insulin glargine |
$242 |
8% |
22% |
Epoetin alfa* |
$115 |
90% |
— |
Filgrastim* |
$110 |
91% |
88% |
Bevacizumab |
$103 |
78% |
15% |
Insulin lispro |
$91 |
13% |
<0.1% |
Pegfilgrastim* |
$86 |
71% |
96% |
Enoxaparin sodium* |
$60 |
21% |
— |
Somatropin |
$43 |
14% |
21% |
Follitropin alfa* |
$15 |
33% |
— |
Teriparatide |
$15 |
22% |
3% |
Biosimilar uptake challenges and current policies
In Canada there are several key factors may influence biosimilar uptake:
- Interchangeability: As in most countries, biosimilars are not interchangeable with the originator biologic.
- Patient Switching: Switching is not universally mandatory. The decision to switch a patient from the originator biologic drug to a biosimilar rests primarily with the treating physician in consultation with the patient and takes into account any policies of the relevant jurisdiction.
- Maintaining Market Share: Strategies/initiatives undertaken by the manufacturer of the originator biologic may limit the uptake of biosimilars.
Since May 2019, several Canadian payers have undertaken a number of initiatives to encouraging switching from biologics to biosimilars with an aim of increasing biosimilar uptake, as outlined in the table below.
| Payer | Initiative | |
|---|---|---|
Public payers |
British Columbia |
In 2019, British Columbia became the first Canadian province to initiate a switch to biosimilar medicines for patients covered under the PharmaCare program. Under the Phase 1 & 2 policy initiatives, patients using Enbrel, Remicade, and Lantus for specific indications are required to switch to the biosimilar. The switching policy expanded to Phase 3 & 4 in 2020 and 2021 to include Rituxan and Humira. |
Alberta |
Effective Jan. 2021, Alberta announced that all patients taking Enbrel, Remicade, Lantus, Neupogen, Neulasta, Rituxan, and Copaxone for indications ranging from rheumatoid arthritis to diabetes and multiple sclerosis are required to switch to the biosimilar. This policy has since been expanded to include Humira, Lovenox, and Hamlog. |
|
New Brunswick |
Effective Apr. 2021, New Brunswick only reimburses biosimilar versions of approved indications of Humira, Enbrel, Remicade, Lantus, Humalog, Rituxan, Copaxone, and Lovenox. |
|
Quebec |
Effective Apr. 2021, the Quebec government announced a non-medical switching policy to require patients covered by the Quebec public drug plan who are treated with biologics drugs to switch to biosimilar versions where available and on an ongoing basis. |
|
MB, ON, NS, PEI, NL,YT, NIHB |
Planning to implement biosimilar switching strategies. |
|
Private payers |
Green Shield Canada (GSC), Sun Life and Pacific Blue Cross (PBC) have introduced policy initiatives to promote the use of biosimilar drugs. |
|
These biosimilar switching policies have prompted wider uptake of biosimilar use in their respective jurisdictions. Infliximab, which holds one of the first biosimilar sales
in Canada, was among the medicines targeted by British Columbia PharmaCare’s Biosimilars Initiative. As a result of this initiative, biosimilars now account for 94% of the infliximab market in British Columbia, compared to just 30% of infliximab units sold nationally.
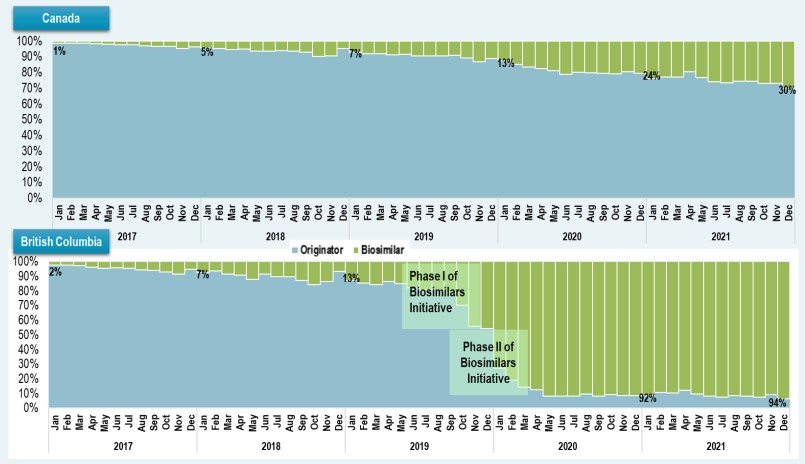
Figure description
Canada
A stacked bar graph shows the uptake of infliximab biosimilars as a share of all infliximab units sold in Canada from January 2017 to December 2021. Results are given monthly for this period.
| Year | Month | Originator share of units sold | Biosimilar share of units sold |
|---|---|---|---|
2017 |
January |
99% |
1% |
February |
99% |
1% |
|
March |
98% |
2% |
|
April |
98% |
2% |
|
May |
98% |
2% |
|
June |
97% |
3% |
|
July |
97% |
3% |
|
August |
97% |
3% |
|
September |
97% |
3% |
|
October |
96% |
4% |
|
November |
95% |
5% |
|
December |
96% |
4% |
|
2018 |
January |
95% |
5% |
February |
95% |
5% |
|
March |
94% |
6% |
|
April |
95% |
5% |
|
May |
93% |
7% |
|
June |
94% |
6% |
|
July |
94% |
6% |
|
August |
93% |
7% |
|
September |
93% |
7% |
|
October |
90% |
10% |
|
November |
91% |
9% |
|
December |
95% |
5% |
|
2019 |
January |
93% |
7% |
February |
92% |
8% |
|
March |
92% |
8% |
|
April |
91% |
9% |
|
May |
91% |
9% |
|
June |
91% |
9% |
|
July |
90% |
10% |
|
August |
91% |
9% |
|
September |
91% |
9% |
|
October |
89% |
11% |
|
November |
87% |
13% |
|
December |
89% |
11% |
|
2020 |
January |
87% |
13% |
February |
85% |
15% |
|
March |
83% |
17% |
|
April |
82% |
18% |
|
May |
81% |
19% |
|
June |
79% |
21% |
|
July |
80% |
20% |
|
August |
80% |
20% |
|
September |
79% |
21% |
|
October |
79% |
21% |
|
November |
80% |
20% |
|
December |
79% |
21% |
|
2021 |
January |
76% |
24% |
February |
77% |
23% |
|
March |
77% |
23% |
|
April |
80% |
20% |
|
May |
77% |
23% |
|
June |
74% |
26% |
|
July |
73% |
27% |
|
August |
74% |
26% |
|
September |
74% |
26% |
|
October |
73% |
27% |
|
November |
73% |
27% |
|
December |
70% |
30% |
British Columbia
A stacked bar graph shows the uptake of infliximab biosimilars as a share of all infliximab units sold in British Columbia from January 2017 to December 2021. Results are given monthly for this period. Phase I of the Biosimilars Initiative started in May 2019 and Phase II started in September 2019.
| Year | Month | Originator share of units sold | Biosimilar share of units sold |
|---|---|---|---|
2017 |
January |
98% |
2% |
February |
98% |
2% |
|
March |
97% |
3% |
|
April |
96% |
4% |
|
May |
96% |
4% |
|
June |
96% |
4% |
|
July |
95% |
5% |
|
August |
94% |
6% |
|
September |
94% |
6% |
|
October |
93% |
7% |
|
November |
92% |
8% |
|
December |
95% |
5% |
|
2018 |
January |
93% |
7% |
February |
94% |
6% |
|
March |
91% |
9% |
|
April |
91% |
9% |
|
May |
88% |
12% |
|
June |
91% |
9% |
|
July |
90% |
10% |
|
August |
89% |
11% |
|
September |
87% |
13% |
|
October |
84% |
16% |
|
November |
87% |
13% |
|
December |
93% |
7% |
|
2019 |
January |
87% |
13% |
February |
85% |
15% |
|
March |
84% |
16% |
|
April |
86% |
14% |
|
May |
85% |
15% |
|
June |
82% |
18% |
|
July |
80% |
20% |
|
August |
81% |
19% |
|
September |
78% |
22% |
|
October |
70% |
30% |
|
November |
56% |
44% |
|
December |
54% |
46% |
|
2020 |
January |
27% |
73% |
February |
19% |
81% |
|
March |
14% |
86% |
|
April |
12% |
88% |
|
May |
8% |
92% |
|
June |
8% |
92% |
|
July |
8% |
92% |
|
August |
9% |
91% |
|
September |
8% |
92% |
|
October |
9% |
91% |
|
November |
9% |
91% |
|
December |
8% |
92% |
|
2021 |
January |
8% |
92% |
February |
11% |
89% |
|
March |
10% |
90% |
|
April |
12% |
88% |
|
May |
9% |
91% |
|
June |
8% |
92% |
|
July |
7% |
93% |
|
August |
9% |
91% |
|
September |
8% |
92% |
|
October |
7% |
93% |
|
November |
9% |
91% |
|
December |
6% |
94% |
Cost savings opportunities from biosimilars
As the historic savings from generic price reductions and substitutions begin to wane, savings from biosimilars could play in increasing role in offsetting rising drug costs. Given that these switching initiatives are implemented at the jurisdiction level and by payer, Canada offers a unique model to observe the impacts of variations in approach and timing of biosimilar uptake across jurisdictions.
National market penetration in line with the results seen in British Columbia may bear significant cost implications for Canadian payers, as evidenced by the increased use of three biosimilars targeted by British Columbia PharmaCare’s Biosimilars Initiative: infliximab, etanercept, and insulin glargine 100IU. These biosimilars saved Canadians an estimated $168 million and $232 million in 2020 and 2021, respectively. If national uptake for these biosimilars had followed the trends in British Columbia, additional savings of nearly $1.1 billion would have been attained from 2020 to 2021.
As of the end of 2021, Canadians had only realized a fraction (30%) of the potential savings from the use of these biosimilars, with up to 70% in annual cost savings if biosimilar switching initiatives were implemented across all payers on a national scale.
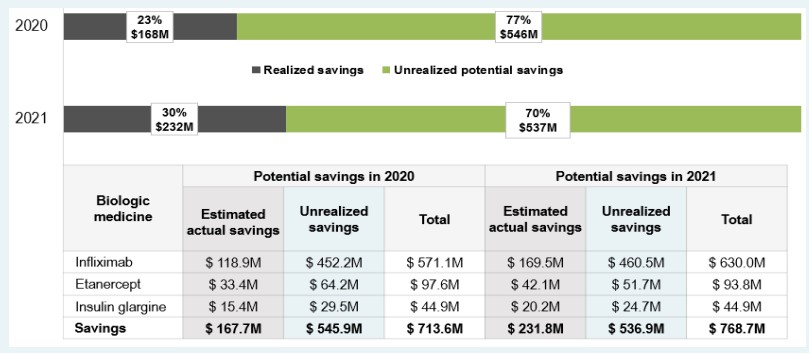
Figure description
A horizontal bar graph shows the difference between realized and unrealized potential savings from increased biosimilar uptake and/or lower prices in Canada in 2020 and 2021. Results are given as a percentage of the total potential savings and as a dollar amount.
In 2020, realized savings amounted to $168 million (or 23% of total potential savings), leaving $546 million (77%) in unrealized potential savings.
In 2021, realized savings amounted to $232 million (or 30% of total potential savings), leaving $537 million (70%) in unrealized potential savings.
A table below the graph breaks these results down by biologic medicine.
| Biologic medicine | Potential savings in 2020, in millions of dollars | Potential savings in 2021, in millions of dollars | ||||
|---|---|---|---|---|---|---|
| Estimated actual savings | Unrealized savings | Total | Estimated actual savings | Unrealized savings | Total | |
Infliximab |
$118.9 |
$452.2 |
$571.1 |
$169.5 |
$460.5 |
$630.0 |
Etanercept |
$33.4 |
$64.2 |
$97.6 |
$42.1 |
$51.7 |
$93.8 |
Insulin glargine |
$15.4 |
$29.5 |
$44.9 |
$20.2 |
$24.7 |
$44.9 |
Savings |
$167.7 |
$545.9 |
$713.6 |
$231.8 |
$536.9 |
$768.7 |
Notes
Data source: IQVIA MIDAS® Database, 2020 (all rights reserved); IQVIA Canadian Drugstore and Hospital Purchases Audit (CDH), 2020 to 2021; US Food and Drug Administration (FDA), European Medicines Agency (EMA), and Health Canada databases; and the World Bank.
Limitations
This analysis focuses on biologic medicines with sales in the Canadian market. Biologic medicines were selected based on Health Canada’s Drug Product Database (DPD) Schedule D and Prescription lists and include insulin biologics. The cost savings model does not explore the impact of policy changes on biosimilar price levels; prices of biosimilars in the study period were used to calculate cost implications and savings.
Disclaimer
Although based in part on data obtained under license from the MIDAS® and CDH databases proprietary to IQVIA Solutions Canada Inc. and/or its affiliates ("IQVIA"), the statements, findings, conclusions, views, and opinions expressed in this presentation are exclusively those of the PMPRB and are not attributable to IQVIA.