
Playing catch-up: where Canada stands three years into the pCPA–CGPA generics pricing initiative
Prices for generic medicines in Canada have traditionally been much higher than those in international markets. Similarly, sales growth for these medicines in Canada from 2006 to 2010 was the highest of any PMPRB7 country. Today, the Canadian generics market remains one of the strongest in the Organisation for Economic Co-operation and Development (OECD) in terms of use and per capita sales and, while the generics share of units sold in the retail pharmaceutical market continues to rise, sales growth has become more moderate, due in part to pricing policies implemented by individual provinces as well as the efforts of the pan-Canadian Pharmaceutical Alliance (pCPA).
In 2018, the pCPA and Canadian Generic Pharmaceutical Association (CGPA) reached a five-year joint agreement to further lower generic prices, producing price reductions that have been sustained three years later. With some of the most commonly prescribed generics reduced to 10% of the brand price, this initiative has lowered the cost of treatment for millions of Canadians with high blood pressure, high cholesterol, and depression, among other ailments.
This analysis examines the market segments targeted by the recent pricing initiative, as the gap continues to narrow between Canadian and international generic prices. It also highlights the latest trends in Canadian sales, utilization, and pricing of generic medicines within an international context. The primary data source is the IQVIA MIDAS® Database current to the fourth quarter of 2020 (Q4-2020).
International price comparisons are based on 628 leading oral solid prescription medicines, making up 79% (over $1 billion) of all generic sales in Canada in Q4-2020. The international markets examined include the Organisation for Economic Co-operation and Development (OECD) members, with a focus on the seven countries the PMPRB considers in reviewing the prices of patented medicines (PMPRB7): France, Germany, Italy, Sweden, Switzerland, the United Kingdom (UK), and the United States (US).
This analysis is based on the PMPRB’s Generics360 report, which provides information on generic pricing, sales, and utilization to inform discussions and support evidence-based decision making for policy makers, the pharmaceutical industry, and patients.
1. The 2018 pCPA-CGPA agreement resulted in substantial price reductions that have been sustained through 2020.
Generic prices in Canada were reduced by 22% between 2016 and 2020, largely due to an average 18% drop following the coming into effect of the pCPA-CGPA joint initiative. Among the PMPRB7 countries, only the US saw a greater price decrease over the same period.
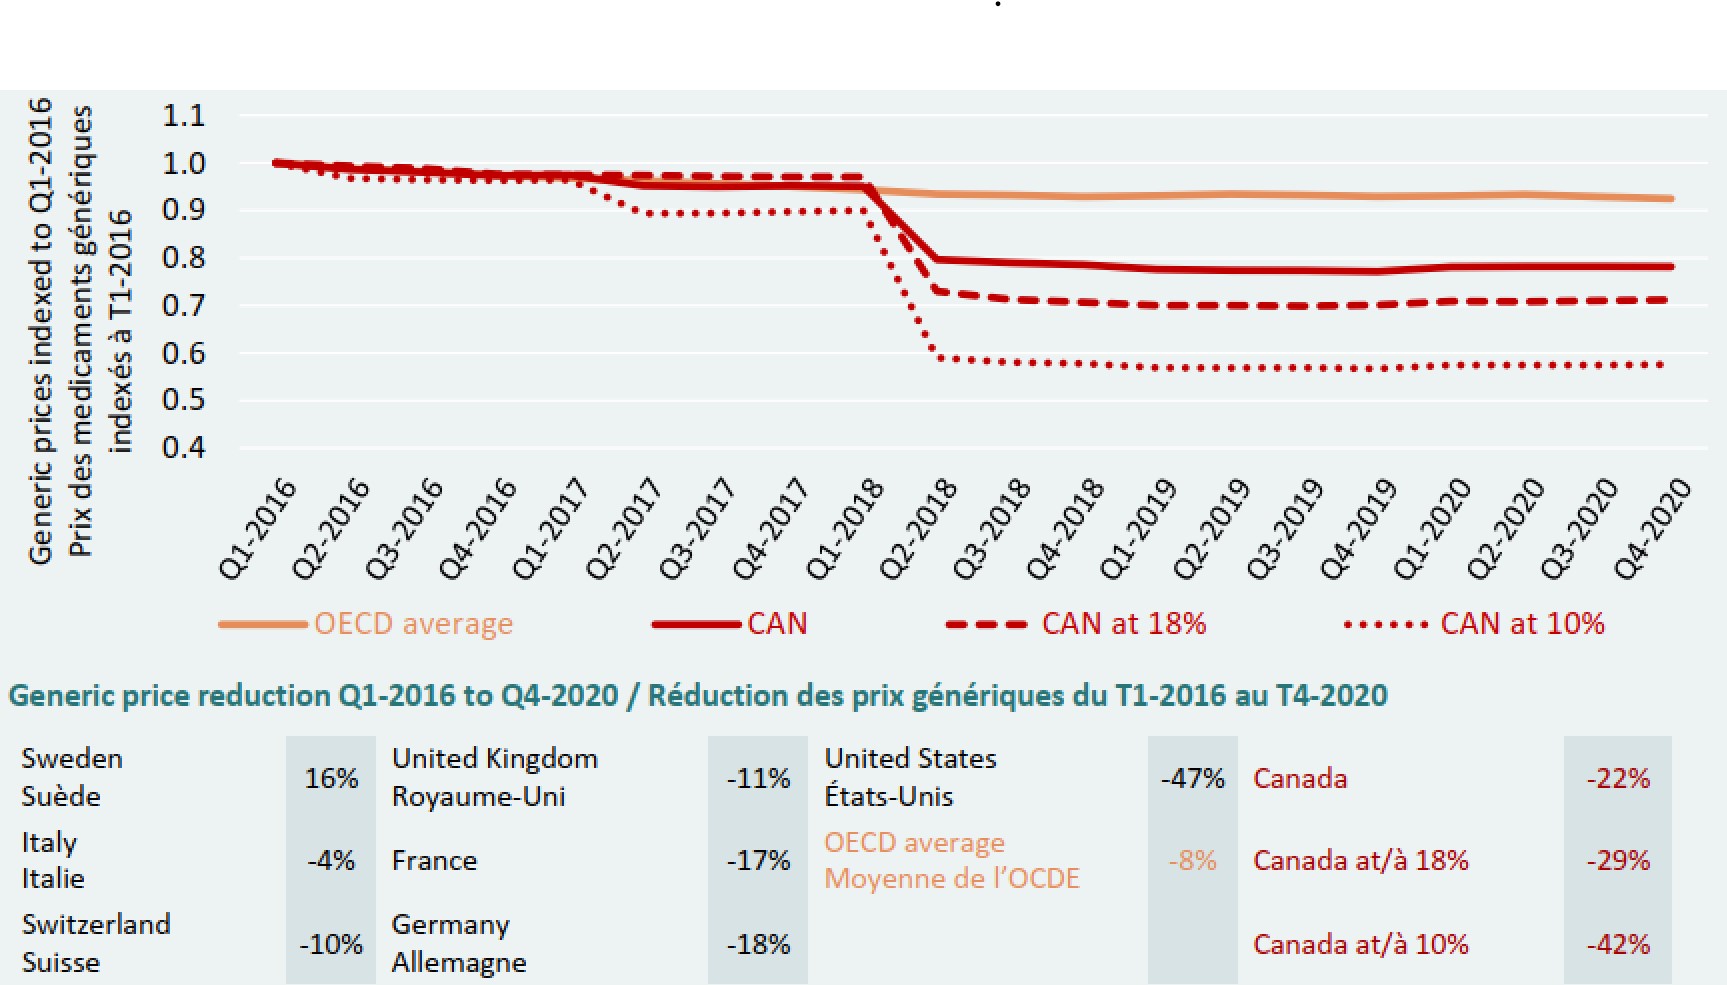
Figure description
This line graph and accompanying table focus on the price reductions for generic medicines from the first quarter of 2016 (Q1-2016) to the fourth quarter of 2020 (Q4-2020). The line graph gives the price indices for all generic medicines in Canada, as well as those at 18% and 10% of their brand-reference prices, and compares these with the average for the Organisation for Economic Co-operation and Development (OECD) countries over the same period. The accompanying table gives the associated generic price reductions for the Canadian markets and OECD average, as well as for each of the PMPRB7 countries.
Price indices:
| Canada: all generics | Canada: generics at 18% | Canada: generics at 10% | OECD average | |
|---|---|---|---|---|
Q1-2016 |
1.00 |
1.00 |
1.00 |
1.00 |
Q2-2016 |
0.99 |
0.99 |
0.97 |
0.99 |
Q3-2016 |
0.98 |
0.99 |
0.96 |
0.98 |
Q4-2016 |
0.97 |
0.98 |
0.96 |
0.97 |
Q1-2017 |
0.97 |
0.97 |
0.96 |
0.97 |
Q2-2017 |
0.95 |
0.97 |
0.89 |
0.96 |
Q3-2017 |
0.95 |
0.97 |
0.89 |
0.96 |
Q4-2017 |
0.95 |
0.97 |
0.90 |
0.95 |
Q1-2018 |
0.95 |
0.97 |
0.90 |
0.94 |
Q2-2018 |
0.80 |
0.73 |
0.59 |
0.93 |
Q3-2018 |
0.79 |
0.71 |
0.58 |
0.93 |
Q4-2018 |
0.79 |
0.71 |
0.58 |
0.93 |
Q1-2019 |
0.78 |
0.70 |
0.57 |
0.93 |
Q2-2019 |
0.77 |
0.70 |
0.57 |
0.93 |
Q3-2019 |
0.77 |
0.70 |
0.57 |
0.93 |
Q4-2019 |
0.77 |
0.70 |
0.57 |
0.93 |
Q1-2020 |
0.78 |
0.71 |
0.57 |
0.93 |
Q2-2020 |
0.78 |
0.71 |
0.57 |
0.93 |
Q3-2020 |
0.78 |
0.71 |
0.57 |
0.93 |
Q4-2020 |
0.78 |
0.71 |
0.58 |
0.92 |
Price reductions from Q1-2016 to Q4-2020:
| Country | Generic price reduction |
|---|---|
Sweden |
16% |
Italy |
-4% |
OECD average |
-8% |
Switzerland |
-10% |
United Kingdom |
-11% |
France |
-17% |
Germany |
-18% |
United States |
-47% |
Canada |
-22% |
Canada: generics at 18% |
-29% |
Canada: generics at 10% |
-42% |
Note: Canada at 18% and 10% refer to the 67 generic medicines reduced to 18% and 10% of their brand reference prices through the generic pricing policy introduced in April 2018.
2. Following the 2018 decline, sales for Canadian generics held steady in 2019 and grew 5% in 2020.
After double-digit annual sales growth from 2006 to 2010, and more moderate growth from 2011 to 2015, Canadian generic sales growth was flat from 2016 to 2020, with a compound annual growth rate (CAGR) of -0.3%. Generic sales totaled $5.48 billion in 2020, slightly lower than the 2016 total of $5.55 billion, before the 2018 pCPA-CGPA joint initiative came into effect. Domestically, generics continue to grow as a share of units in the Canadian market, even as their share of sales declines due to faster sales growth among patented medicines.
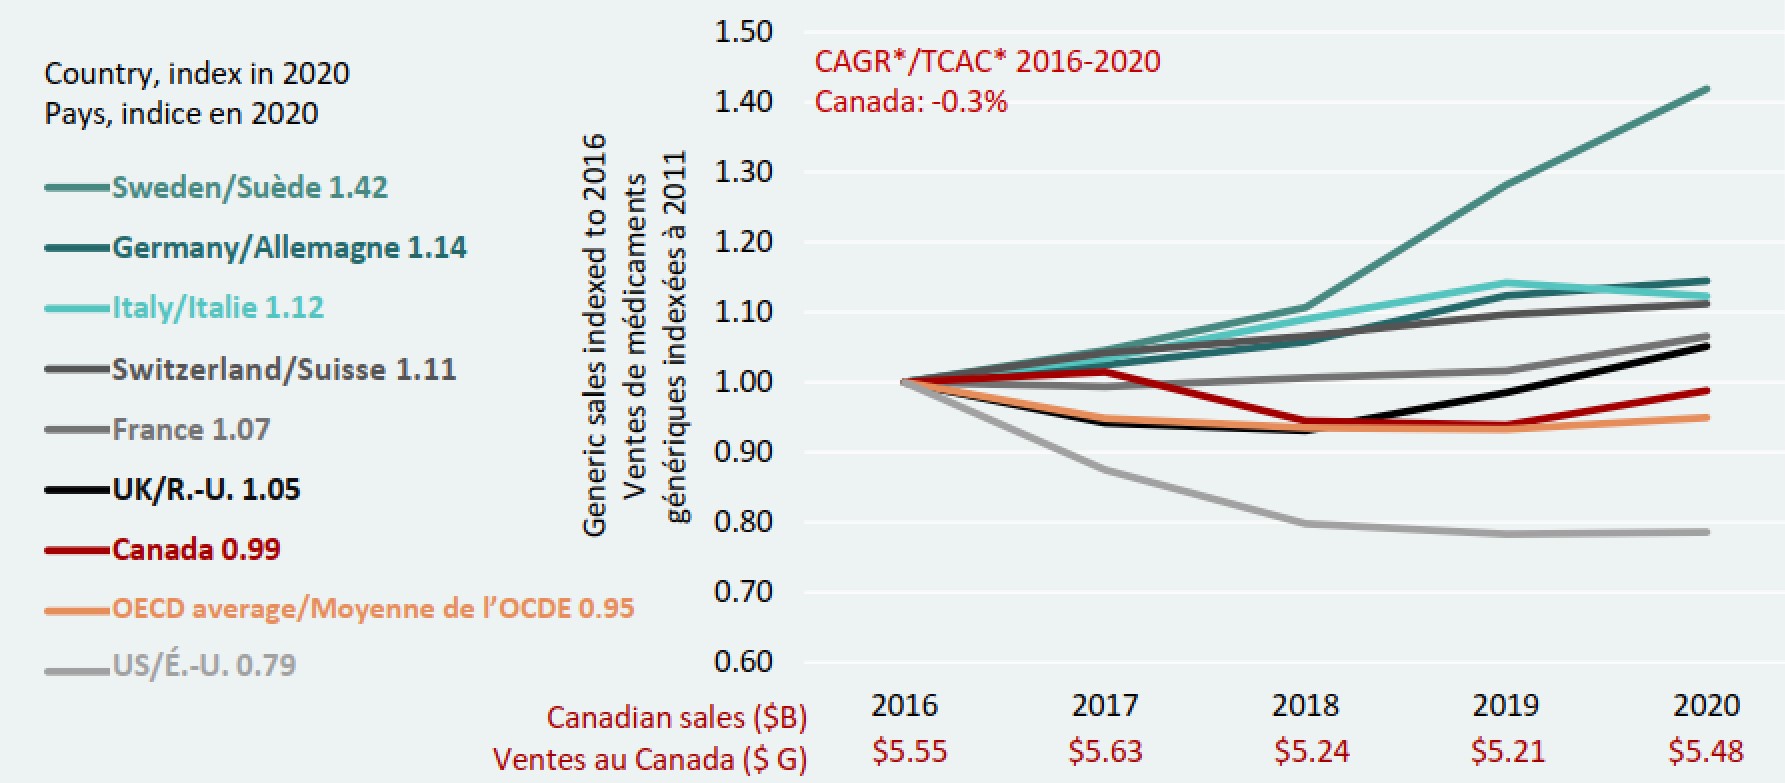
Figure description
This line graph presents the indexed rate of growth of generic retail sales for Canada and the seven PMPRB comparator countries, as well as the average for the Organisation for Economic Co-operation and Development countries from 2016 to 2020. The compound annual growth rate in Canada for this period was -0.3%.
| 2016 | 2017 | 2018 | 2019 | 2020 | |
|---|---|---|---|---|---|
Canada |
1.00 |
1.01 |
0.94 |
0.94 |
0.99 |
Switzerland |
1.00 |
1.04 |
1.07 |
1.10 |
1.11 |
Germany |
1.00 |
1.02 |
1.06 |
1.12 |
1.14 |
France |
1.00 |
0.99 |
1.01 |
1.02 |
1.07 |
United Kingdom |
1.00 |
0.94 |
0.93 |
0.99 |
1.05 |
Italy |
1.00 |
1.03 |
1.09 |
1.14 |
1.12 |
Sweden |
1.00 |
1.05 |
1.11 |
1.28 |
1.42 |
United States |
1.00 |
0.87 |
0.80 |
0.78 |
0.79 |
OECD average |
1.00 |
0.95 |
0.93 |
0.93 |
0.95 |
A table below the graph gives the total Canadian generic retail sales for each year: 2016: $5.55 billion; 2017: $5.63 billion; 2018: $5.24 billion; 2019: $5.21 billion; 2020: $5.48 billion.
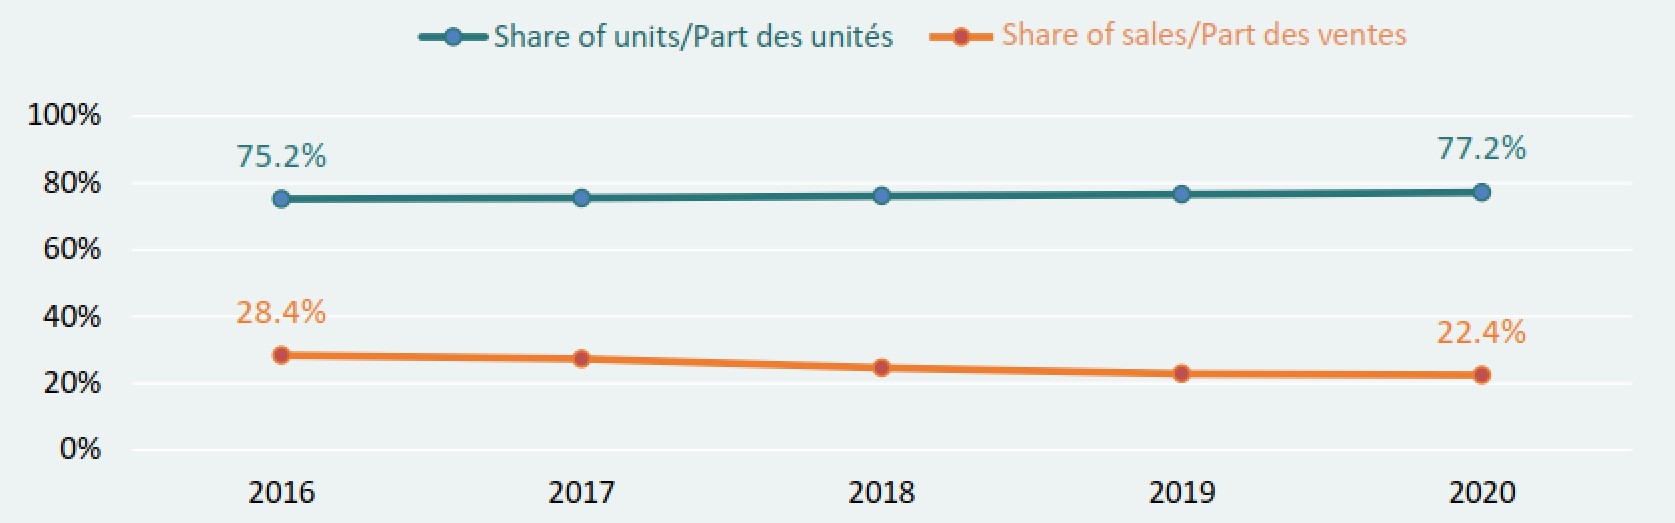
Figure description
This line graph gives the generic share of the retail pharmaceutical market in Canada from 2016 to 2020 in terms of spending (sales) and units sold.
| 2016 | 2017 | 2018 | 2019 | 2020 | |
|---|---|---|---|---|---|
Share of units |
75.2% |
75.5% |
76.1% |
76.6% |
77.2% |
Share of sales |
28.4% |
27.3% |
24.6% |
22.8% |
22.4% |
3. Canada’s generic market has shifted toward lower prices since 2016.
By the end of 2018, the structure of the Canadian generic market had shifted toward a higher volume of medicines being sold at lower generic-to-brand price ratios than the same point in 2016. Results for Q4-2018 and Q4-2020 show that over 40% of generic units are now being sold at or below 10% of their respective brand prices. By comparison, there were no generic sales below 15% of the brand price in Q4-2016, when the pCPA-CGPA joint agreement had not yet come into effect.
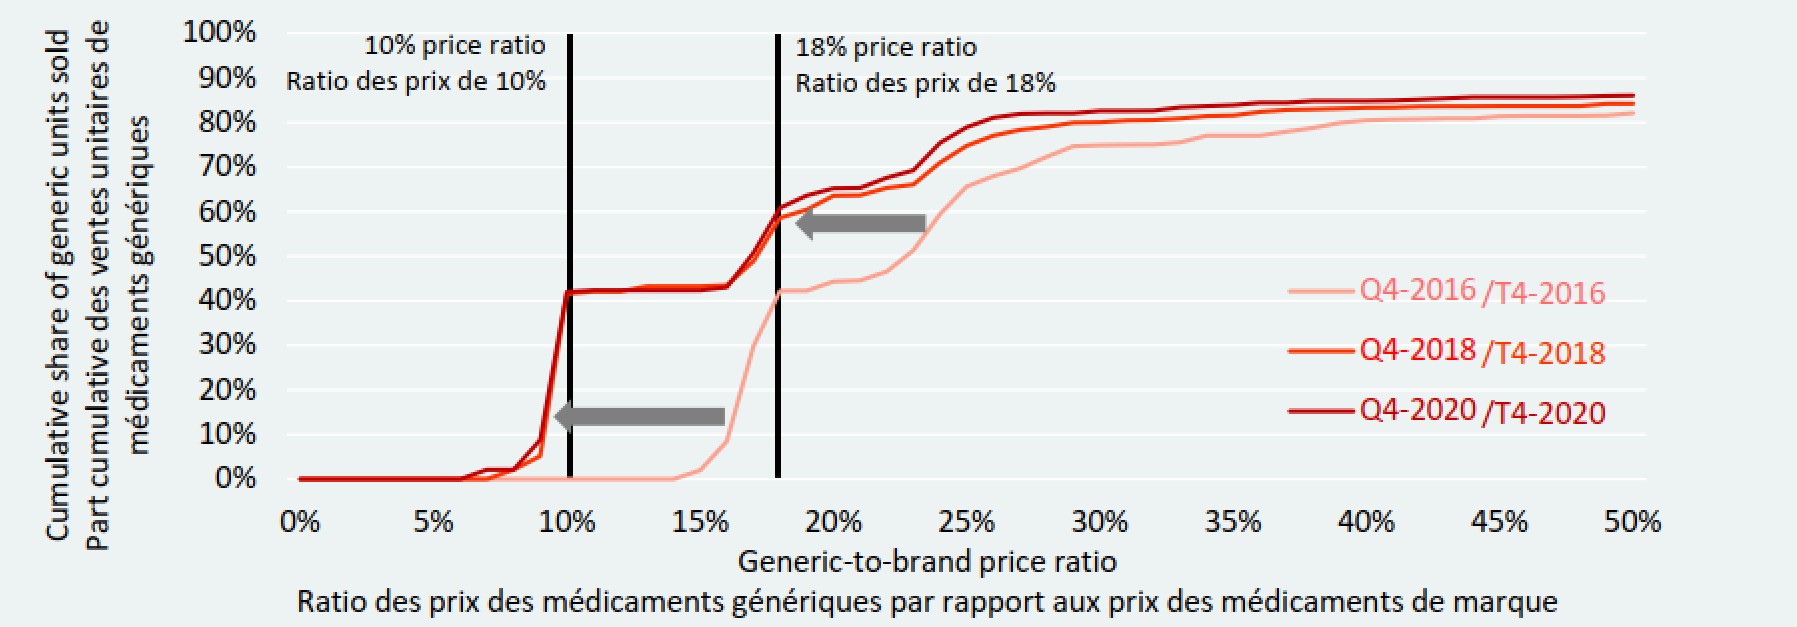
Figure description
This line graph illustrates the cumulative share of generic unit sales in Canada by generic-to-brand price ratio, from 1% to 50%. Results are given for Q4-2016, Q4-2018, and Q4-2020.
| Generic-to-brand price ratio | Cumulative share of sales in Q4-2016 | Cumulative share of sales in Q4-2018 | Cumulative share of sales in Q4-2020 |
|---|---|---|---|
1% |
0.0% |
0.0% |
0.0% |
2% |
0.0% |
0.0% |
0.0% |
3% |
0.0% |
0.0% |
0.0% |
4% |
0.0% |
0.0% |
0.0% |
5% |
0.0% |
0.0% |
0.0% |
6% |
0.0% |
0.0% |
0.0% |
7% |
0.0% |
0.0% |
0.0% |
8% |
0.0% |
0.0% |
2.1% |
9% |
0.0% |
2.1% |
2.1% |
10% |
0.0% |
5.1% |
8.8% |
11% |
0.0% |
41.6% |
42.0% |
12% |
0.0% |
42.1% |
42.4% |
13% |
0.0% |
42.1% |
42.4% |
14% |
0.0% |
43.3% |
42.4% |
15% |
0.0% |
43.3% |
42.4% |
16% |
2.0% |
43.3% |
42.4% |
17% |
8.5% |
43.5% |
43.0% |
18% |
29.8% |
48.9% |
50.8% |
19% |
42.2% |
58.6% |
60.8% |
20% |
42.3% |
60.4% |
63.6% |
21% |
44.3% |
63.6% |
65.2% |
22% |
44.6% |
63.7% |
65.3% |
23% |
46.6% |
65.3% |
67.6% |
24% |
51.3% |
66.1% |
69.3% |
25% |
59.4% |
71.0% |
75.4% |
26% |
65.6% |
74.8% |
78.9% |
27% |
68.0% |
77.1% |
81.1% |
28% |
69.7% |
78.4% |
81.9% |
29% |
72.3% |
79.0% |
82.1% |
30% |
74.7% |
80.0% |
82.1% |
31% |
74.9% |
80.1% |
82.6% |
32% |
75.0% |
80.4% |
82.6% |
33% |
75.1% |
80.5% |
82.6% |
34% |
75.5% |
80.9% |
83.4% |
35% |
77.1% |
81.5% |
83.7% |
36% |
77.1% |
81.6% |
83.9% |
37% |
77.1% |
82.4% |
84.5% |
38% |
78.0% |
82.8% |
84.5% |
39% |
78.8% |
82.9% |
84.8% |
40% |
79.9% |
83.1% |
84.8% |
41% |
80.5% |
83.3% |
84.8% |
42% |
80.7% |
83.4% |
85.0% |
43% |
80.8% |
83.6% |
85.2% |
44% |
80.9% |
83.6% |
85.4% |
45% |
80.9% |
83.6% |
85.7% |
46% |
81.4% |
83.7% |
85.7% |
47% |
81.5% |
83.7% |
85.7% |
48% |
81.5% |
83.7% |
85.7% |
49% |
81.5% |
83.7% |
85.8% |
50% |
81.6% |
84.2% |
86.0% |
4. Canadian generic prices are increasingly aligned with international levels, though a significant gap remains with the OECD median.
In bilateral comparisons, generic prices in Canada were found to be third highest in the PMPRB7 and 11th in the OECD in the last quarter of 2020, with a 16% difference between Canadian prices and the medicine-level OECD median. While the price ratios for France, Germany, and the UK were 4% to 10% lower than Canada, those gaps have narrowed since Q4-2016, when respective price ratios for these countries were 25%, 26%, and 27% lower than Canada. Bilateral comparisons also differ depending on the number of generics in Canada with prices available in the other country.
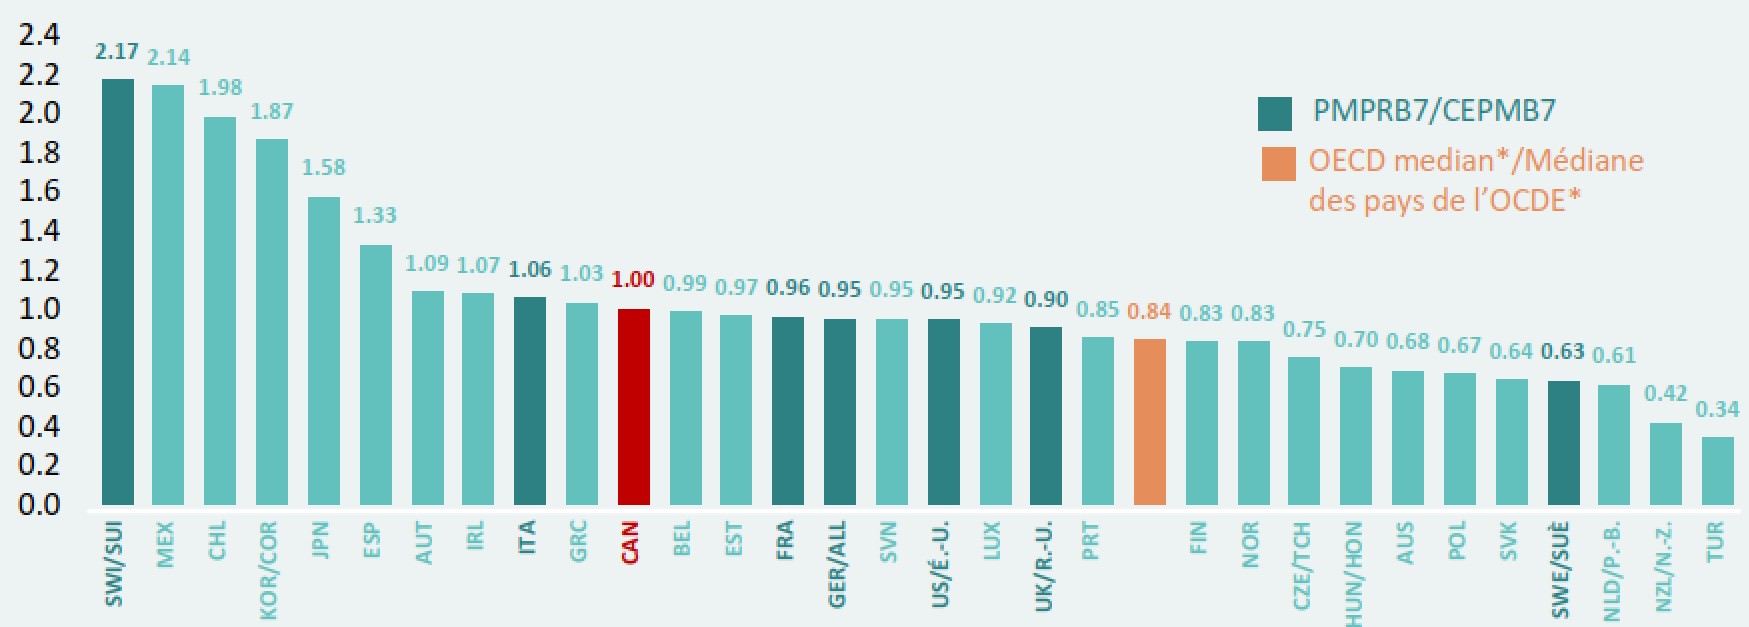
Figure description
This horizontal bar graph gives the average foreign-to-Canadian price ratios for generic medicines in the last quarter of 2020 for each of the countries in the Organisation for Economic Co-operation and Development. The Canadian generic price level is set to one; ratios greater than one indicate higher foreign prices, while ratios less than one indicate lower foreign prices. The median across all countries listed was 0.84. The OECD median does not necessarily represent the median result for the individual countries reported in this graph, as it is calculated at the medicine level for generics with prices available in at least three foreign markets.
| Country | Average foreign-to-Canadian price ratio |
|---|---|
Switzerland |
2.17 |
Mexico |
2.14 |
Chile |
1.98 |
South Korea |
1.87 |
Japan |
1.58 |
Spain |
1.33 |
Austria |
1.09 |
Ireland |
1.07 |
Italy |
1.06 |
Greece |
1.03 |
Canada |
1.00 |
Belgium |
0.99 |
Estonia |
0.97 |
France |
0.96 |
Germany |
0.95 |
Slovenia |
0.95 |
United States |
0.95 |
Luxembourg |
0.92 |
United Kingdom |
0.90 |
Portugal |
0.85 |
Finland |
0.83 |
Norway |
0.83 |
Czech Republic |
0.75 |
Hungary |
0.70 |
Australia |
0.68 |
Poland |
0.67 |
Slovakia |
0.64 |
Sweden |
0.63 |
Netherlands |
0.61 |
New Zealand |
0.42 |
Turkey |
0.34 |
* The OECD median does not necessarily represent the median result for the individual countries reported in this graph, as it is calculated at the medicine level for generics with prices available in at least three foreign markets.
5. Canada continues to have one of the strongest generic markets in the OECD.
Similar to 2016 results, 2020 per capita spending in Canada was second only to the US among the entire OECD. At $158 per capita, Canadians spent 49% more than the OECD median and 20% more than the PMPBR7 median. Generics accounted for 77% of units sold in the Canadian retail market, the third-highest share in the OECD.
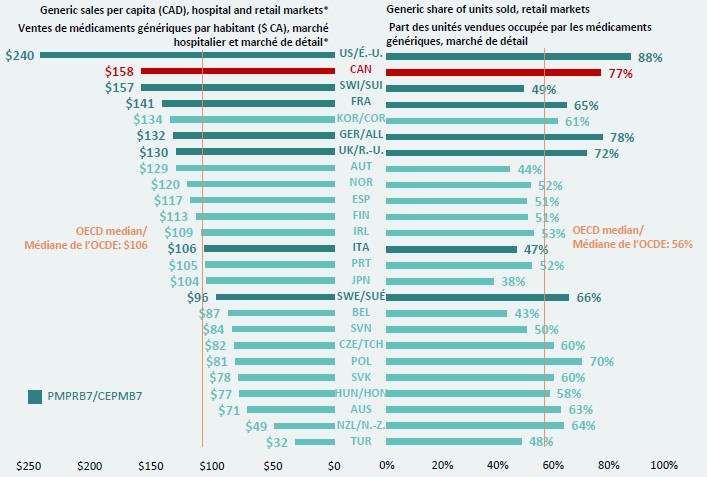
Figure description
This is a split bar graph. The left side gives the sales per capita, in Canadian dollars, for the combined hospital and retail market in each of the Organisation for Economic Co-operation and Development countries. These results are based on market exchange rates. The right side gives the generic share of units sold in the retail markets for each country. The median sales per capita across all countries was $106 and the median share of units was 56%.
| Country | Sales per capita | Share of units sold |
|---|---|---|
Turkey |
$32 |
48% |
New Zealand |
$49 |
64% |
Australia |
$71 |
63% |
Hungary |
$77 |
58% |
Slovakia |
$78 |
60% |
Poland |
$81 |
70% |
Czech Republic |
$82 |
60% |
Slovenia |
$84 |
50% |
Netherlands |
$87 |
76% |
Belgium |
$87 |
43% |
Sweden |
$96 |
66% |
Japan |
$104 |
38% |
Portugal |
$105 |
52% |
Italy |
$106 |
47% |
Ireland |
$109 |
53% |
Finland |
$113 |
51% |
Spain |
$117 |
51% |
Norway |
$120 |
52% |
Austria |
$129 |
44% |
United Kingdom |
$130 |
72% |
German |
$132 |
78% |
South Korea |
$134 |
61% |
France |
$141 |
65% |
Switzerland |
$157 |
49% |
Canada |
$158 |
77% |
United States |
$240 |
88% |
* Based on market exchange rates.
Note: The term “generic” used in this analysis includes both patented and non-patented generic medicines. Results are based on manufacturer ex-factory list prices in the national retail markets. The analysis was restricted to oral solid generic medicines that had been on the market for at least one year. Countries where hospital data was unavailable were excluded from the international comparisons. The Netherlands was excluded from the PMPRB11 analysis due to inconsistencies in the available data.
Data source: IQVIA MIDAS® Database, 2016 to 2020 (all rights reserved); Generics360: Generic Drugs in Canada, 2016.
Disclaimer: Although based in part on data obtained under license from the MIDAS® database proprietary to IQVIA Solutions Canada Inc. and/or its affiliates ("IQVIA"), the statements, findings, conclusions, views, and opinions expressed in this presentation are exclusively those of the PMPRB and are not attributable to IQVIA.