
Insight into approvals, marketing, and pricing of new medicines in Canadian and international markets
Background and Objective
High-cost specialty medicines are increasingly dominating the landscape of new medicines launched in Canada and around the world. A growing share of these medicines, which include biologics, orphan drugs, and oncology products, have treatment costs in the tens or hundreds of thousands of dollars per year, although some have limited evidence of therapeutic benefit. This presentation provides an overview of new medicine approvals, sales, pricing, characteristics, and access in Canada and internationally.
Methodology
This study explores the market entry dynamics of new medicines approved by Health Canada, the US FDA, or the EMA from 2015 to 2020. A new medicine is selected for analysis if it received market authorization from any of these regulatory bodies during the calendar year for the first time. The analysis explores the availability, treatment cost, and sales of these medicines within one calendar year following the year of first international approval and monitors how these metrics compare year over year. Primary data for this analysis was sourced from IQVIA’s MIDAS Database, with additional information from the Health Canada, US FDA, and EMA online drug databases.
Results
Section 1: Trends in approvals and sales
An average of 45 new medicines were approved each year from 2015 to 2020, although the number of new medicine approvals since 2017 has outpaced the average. Orphan and oncology medicines consistently make up a significant portion of new approvals.
Fifty new medicines were approved in 2020, including greater shares of orphan and oncology treatments: orphan medicines accounted for 58% of new approvals while oncology medicines rose to 34%, the highest share since 2015.
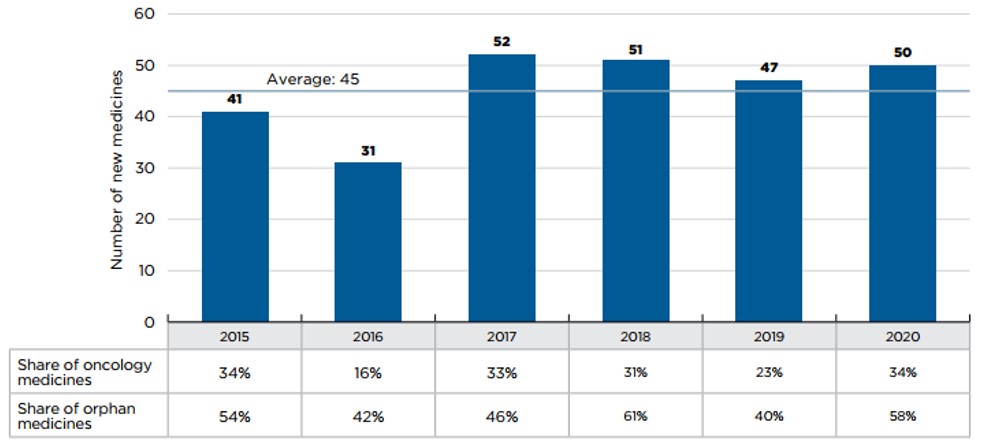
Figure description
This bar graph depicts the number of new medicines approved by the US Food and Drug Administration, the European Medicines Agency, and Health Canada from 2015 to 2020. A table shows the share of orphan and oncology medicines for each annual total. The average number of annual approvals for the period was 45.
| 2015 | 2016 | 2017 | 2018 | 2019 | 2020 | |
|---|---|---|---|---|---|---|
Number of new medicines |
41 |
31 |
52 |
51 |
47 |
50 |
Share of orphan medicines |
54% |
42% |
46% |
61% |
40% |
58% |
Share of oncology medicines |
34% |
16% |
33% |
31% |
23% |
34% |
As a group, medicines approved from 2015 to 2019 accounted for approximately 15% of pharmaceutical sales by 2020.
Figure 2 illustrates the year-over-year uptake in sales for medicines first approved between 2015 and 2019. By Q4-2020, these medicines collectively accounted for 15.5% of the total brand-name pharmaceutical market in Canada. In any given year, the impact of new medicines on pharmaceutical sales depends on their number, therapeutic relevance, and treatment costs. Over this five-year period, direct-acting antiviral medicines approved in 2016 for the treatment of hepatitis C quickly gained large market shares by 2018, but have since started to decline, due in part to the curative nature of these treatments. By Q4-2020, the highest-selling new medicines in Canada were semaglutide, a diabetes medicine introduced in 2017, as well as palbociclib and daratumumab, two cancer medicines introduced in 2015.
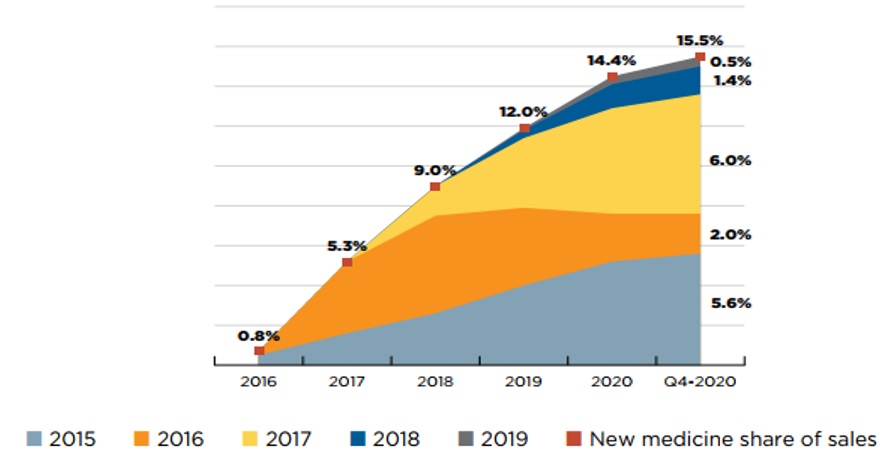
Figure description
This area graph depicts the new medicine cumulative share of total brand-name medicine sales by year of approval between 2015 and 2019 for the eleven PMPRB comparator countries and the second is for Canada alone. The figure tracks the percentage of new medicines in yearly sales up to the fourth quarter of 2020. New medicine share of sales for each year are also marked. For the eleven PMPRB comparator countries and the second is for Canada alone.
| Year of approval | 2016 | 2017 | 2018 | 2019 | 2020 | Q4-2020 |
|---|---|---|---|---|---|---|
2015 |
0.5% |
1.6% |
2.6% |
4.0% |
5.2% |
5.6% |
2016 |
0.2% |
3.6% |
4.9% |
3.9% |
2.4% |
2.0% |
2017 |
0.0% |
0.0% |
1.5% |
3.5% |
5.3% |
6.0% |
2018 |
0.0% |
0.0% |
0.0% |
0.4% |
1.2% |
1.4% |
2019 |
0.0% |
0.0% |
0.0% |
0.1% |
0.4% |
0.5% |
New medicine share of sales |
0.8% |
5.3% |
9.0% |
12.0% |
14.4% |
15.5% |
Section 2: High cost and specialty medicines
Sixty-five percent of 2019 new medicines had high treatment costs: over $10,000 per year or $5,000 per 28-day cycle.
Ten of eleven new oncology medicines fell into this “high-cost” category, along with more than half of non-oncology medicines. Eight non-oncology and five oncology medicines were identified as expensive drugs for rare diseases (EDRDs)—orphan-designated therapies exceeding $100,000 in annual treatment costs, or $7,500 per 28-day cycle for oncology. Together, these 13 EDRDs accounted for over 36% of 2019 new medicine sales. These characteristics no longer represent an exceptional year for new medicines prices. Previous editions of Meds Entry Watch have shown that of the new medicines approved internationally between 2017 and 2019, over half had annual treatment costs more than ten thousand dollars, with a substantial share reaching into the six figures.
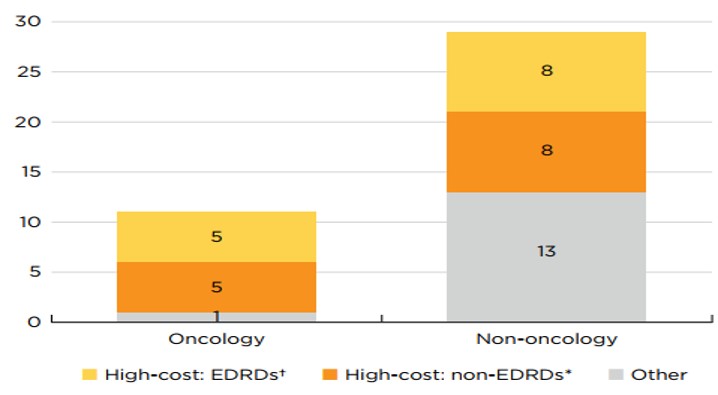
* High-cost medicines are defined as those with treatment costs exceeding $10,000 annually or $5,000 per 28-day cycle.
† Expensive drugs for rare diseases (EDRDs) are defined as those with an orphan designation through the FDA or EMA and treatment costs exceeding $7,500 per 28-day cycle or $100,000 annually.
Figure description
This stacked bar graph gives the distribution of the 40 2019 new medicines with available treatment costs by high-cost bracket. The first bar shows the distribution of new oncology medicines, while the second gives the totals for non-oncology medicines. Each bar is broken down into the number of new medicines that are expensive drugs for rare diseases (EDRDs), those that are high-cost but do not qualify as EDRDs, and all other non-high-cost medicines. High-cost medicines exceed $10,000 in annual treatment costs or $5,000 per 28-day cycle. Expensive drugs for rare diseases are defined as having treatment costs in excess of $100,000 annually or $7,500 per 28-day cycle, as well as an orphan designation from either the US Food and Drug Administration or the European Medicines Agency.
| Expensive drugs for rare diseases† | High-cost medicines*, other than EDRDs | Other | Total | |
|---|---|---|---|---|
Oncology medicines |
5 |
5 |
1 |
11 |
Non-oncology medicines |
8 |
8 |
13 |
29 |
Forty percent of the 2019 new medicines received an orphan designation from the FDA and/or the EMA. Approximately 23% (11) of new medicines were for the treatment of cancer and 30% (14) were biologics. As illustrated in figure 4, there is a notable overlap between these categories, where over half of orphan designated medicines were either a biologic, indicated to treat cancer, or both. Figure 1 indicates that the number of medicines receiving orphan status was slightly lower in 2019 as both 2018 and 2020 rates were closer to 60%.
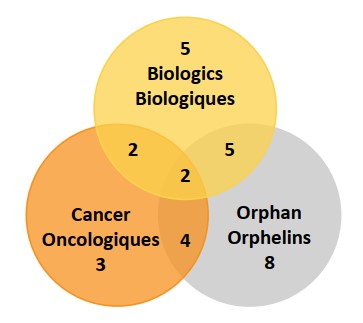
Figure description
This is a Venn diagram illustrating the overlap between orphan, biologic, and oncology treatments among the 2019 new medicines. Of the 47 new approvals, a total of 14 medicines were biologic, 19 had an orphan designation, and 11 were cancer medicines. Of these, five were both biologic and orphan, two were both biologic and oncological, four were both orphan and oncological, and two were biologic cancer medicines that also received an orphan designation.
Section 3: Market launches
Canada had recorded sales for 30% of 2015 to 2019 new medicines within the calendar year following first international approval, placing it fifth among the PMPRB11 countries. Figure 5 uses a retrospective analysis to identify the number of new medicines that were approved and marketed in Canada and comparator countries by the end of the calendar year following their first international authorization. Of the 222 new medicines first approved between 2015 and 2019, Canada had recorded sales for 66 (30%) within one year of their first international approval. Canada outperformed the PMPRB11 median of 62, ranking higher than France, Italy, Japan, the Netherlands, Spain, Belgium, and Australia. The US was an outlier among the countries shown, having recorded sales for 182 (82%) of the new medicines within a one-year period. Of the PMPRB11 countries, only Germany marketed more than 100 new medicines within a one-year period.
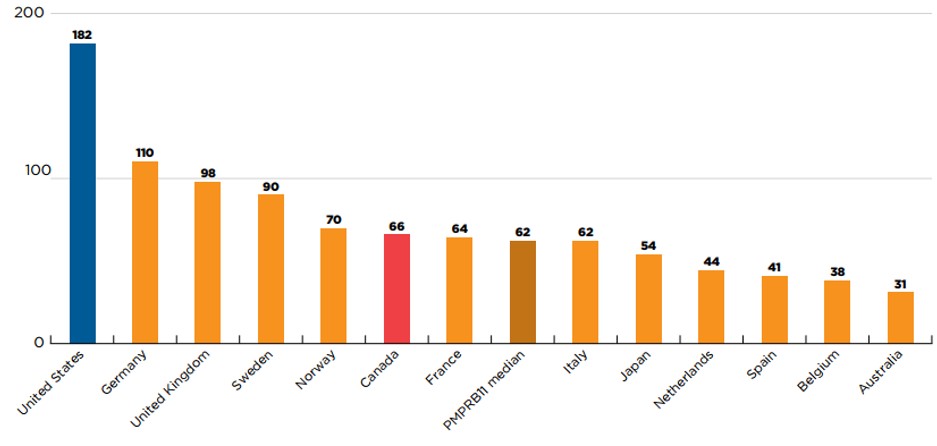
Figure description
This is a bar graph that gives the number of new medicines with sales within one year of their first international approval in Canada, the US, and each of the 11 PMPRB comparator countries. The median across the PMPRB11 countries was 62. For the purposes of this analysis, new medicines were defined as those that received their first market authorization through the US Food and Drug Administration (FDA), the European Medicines Agency (EMA), or Health Canada between 2015 and 2019. A medicine was considered to be marketed within a one-year period if it had sales before the end of the calendar year following its first international approval.
| Country | Number of new medicines with sales within one year |
|---|---|
United States |
182 |
Germany |
110 |
United Kingdom |
98 |
Sweden |
90 |
Norway |
70 |
Canada |
66 |
France |
64 |
Italy |
62 |
Japan |
54 |
Netherlands |
44 |
Spain |
41 |
Belgium |
38 |
Australia |
31 |
Canada had an approval rate of 40% to 50% and sales for 22% to 38% of the new medicines within the calendar year following their first international approval. Figure 6 illustrates the percentage of new medicines approved and sold in Canada within one year of first international approval for each year from 2015 to 2019. The results indicate that Health Canada approved approximately half of 2015 to 2017 new medicines within a year of their international authorization, and closer to 40% of the medicines from 2018 and 2019. Previous editions of Meds Entry Watch have shown a similar decline in the proportion of medicines approved within one calendar year by the EMA during the same period. Shares of new medicines with sales in Canada within the same period were approximately 15 percentage points lower than for approvals, fluctuating between a low of 22% to a high of 38%, for 2018 and 2017 new medicines, respectively.
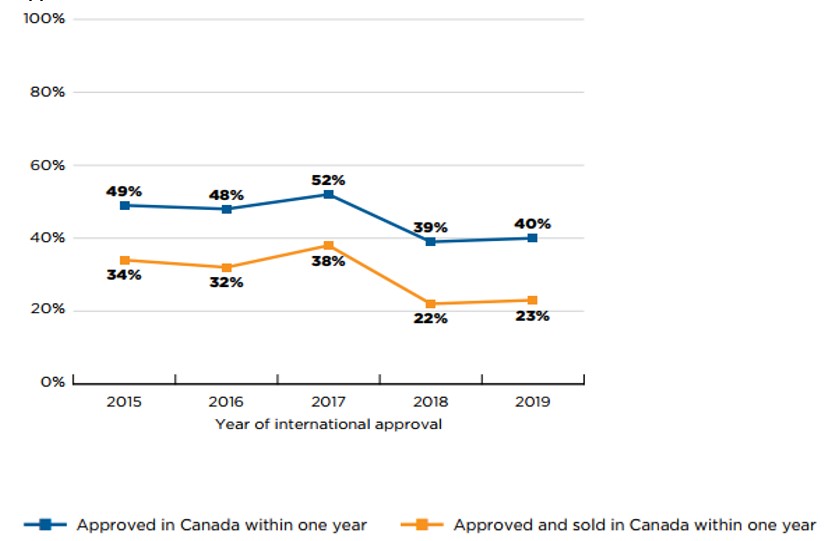
* New medicines in figure 6 were defined as those that received first market authorization through the FDA, EMA, or Health Canada between 2015 and 2019
Figure description
This line graphs gives the percentage of new medicines approved and sold in Canada within one year of their first international approval. Results are given annually by the year the medicine received its first market authorization through the US Food and Drug Administration (FDA), the European Medicines Agency (EMA), or Health Canada from 2015 to 2019. A medicine was considered to be approved or marketed within a one-year period if its approval date or date of first sale fell before the end of the calendar year following its first international approval.
| Year of approval | Approved in Canada within one year | Approved and sold in Canada within one year |
|---|---|---|
2015 |
49% |
34% |
2016 |
48% |
32% |
2017 |
52% |
38% |
2018 |
39% |
22% |
2019 |
40% |
23% |
Conclusion
Following the trend seen in recent years, this poster highlights a prevalence of high-cost and rare disease drugs among new approvals. More of these new medicines reach Canadian patients than in most Organisation for Economic Co-operation and Development (OECD) countries, though Canada lags behind some key markets with lower average patented medicine prices. As Canada vies to keep up with approval rates for new medicines in comparator countries, there is a need for more information on the impact of new approvals on payers and patients alike.
Data Sources
The main source of sales data for the report is sourced from IQVIA MIDAS database with some additional information coming from the Health Canada Notice of Compliance (NOC) database and Drug Product Database (DPD), as well as the EMA and the FDA.
Limitations
As we focus on three approval bodies, it is possible that some new medicines listed in the report may have an earlier approval date in other jurisdictions. Along the same lines, it is possible that some medicines with first international approval in 2019 and 2020 are not presented in the report.
Sales data does not reflect price rebates, agreements, or patient access schemes. Some medicines with sales may not be reported in MIDAS resulting in the potential for new medicine sales in any given country to be under-represented.