
The missing claimants of the pandemic: Who went without claims in Canada during the first two years of the COVID-19 pandemic and what does it mean for public and private drug plans?
Presented at ICPE 2023, August 23-27, 2023
Étienne Gaudette, PhD, and Yvonne Zhang, MA
On this page
Introduction
Background and objectives: This study aims to draw attention to the sharp swings in the number of claimants observed in 2020 and 2021 in Canada, and to examine whether the “missing claimants” of the COVID-19 pandemic could impact drug claims and spending for years to come.
Approach: We analyze data from public and private drug plans since 2015, investigating the changes in the number of claimants in 2020 and 2021 relative to 2015–2019 trends by public/private plan, age group, and spending level. We also document the therapeutic classes that saw the greatest shifts in the number of claims filed. This research expands on an analysis focused on 2020 data published in 2022.Footnote 1 For more detail, see Data section below.
Data
Public drug plans: Annual aggregates from publicly financed drug benefit programs affiliated were compiled with the National Prescription Drug Utilization Information System (NPDUIS) database, which represent approximately 7 million publicly covered active beneficiaries. Public drug plans from British Columbia, Alberta, Saskatchewan, Manitoba, Ontario, New Brunswick, Nova Scotia, Prince Edward Island, and Newfoundland were included in the analysis.
Private drug plans: Aggregated annual data from the IQVIA Private Drug Plan database were used for the analysis. This database houses adjudicated prescription claim-level data collected from a large sample of Canadian pay-direct private drug plans representing all provinces and territories, and was estimated by IQVIA to represent 85.7% of the Canadian private pay direct insurance market in 2020. In 2021, IQVIA reported changes in the data provided by one plan administrator, resulting in a decline in the capture rate to 79.9% over all provinces in that year. Private claimants and claims data were thus adjusted by a factor of 0.857 / 0.799 = 1.0726 in that year.
Definitions: Claimants are individuals with at least one prescription drug claim accepted for reimbursement during a given year. “Missing claimants” refer to differences between the projected number of claimants in 2020 and 2021, based on pre-pandemic trends from 2015–2019, and the actual number of claimants observed during these two years. Pre-pandemic trends were estimated for all groups using second-order polynomial regressions for years 2015 to 2019. Public plan annual data were aggregated at fiscal years (Apr. to Mar.), while private plan data were available at calendar years (Jan. to Dec.). Therapeutic classes are defined based on the second level of the World Health Organization’s Anatomical Therapeutic Chemical classification system.
Exclusions: Because design changes impacted public plan eligibility of Ontario claimants under 25 during the study period,Footnote 2 they were excluded from Figure 1 to Figure 3. For the same reason, Ontario claimants by spending level and Ontario claims were excluded from Figure 4 and Figure 5, since they were not disaggregated by age group for private plans and were impacted by the eligibility changes. Claimants with an unknown age group were excluded from Figure 2. Claims for vaccines were excluded from public plan data in all analyses because of differences in their reporting by jurisdiction.
Results
1. Claimants greatly declined in 2020 and remained over 1M below trend in 2021
- A decline of nearly one million (920,000) claimants was observed in the first year of the COVID-19 pandemic (Figure 1). The decline contrasted with the steady growth observed in the pre-pandemic period.
- Claimants rebounded in 2021 but remained 1.2 million below trend in that year.
- The 2021 rebound in publicly covered claimants was below pre-pandemic growth rates, resulting in an increase in missing claimants in public plans (Figure 2).
Figure 1: Drug plan claimants, 2015 to 2021
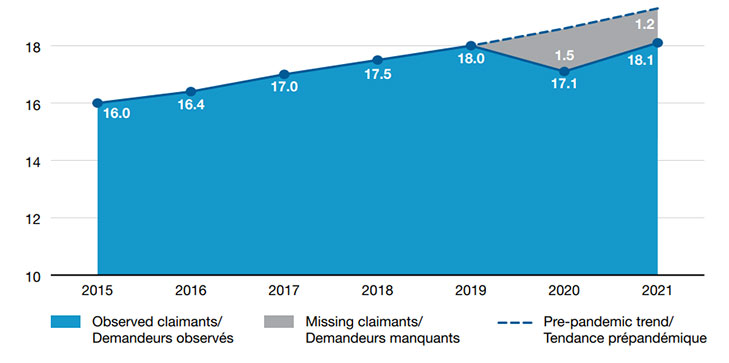
Figure 1 - Text version
| 2015 | 2016 | 2017 | 2018 | 2019 | 2020 | 2021 | |
|---|---|---|---|---|---|---|---|
| Observed claimants | 16.0 | 16.4 | 17.0 | 17.5 | 18.0 | 17.1 | 18.1 |
| Pre-pandemic trend | - | - | - | - | 18.0 | 18.6 | 19.3 |
| Missing claimants | - | - | - | - | 0.0 | 1.5 | 1.2 |
Figure 2: Missing claimants by plan type
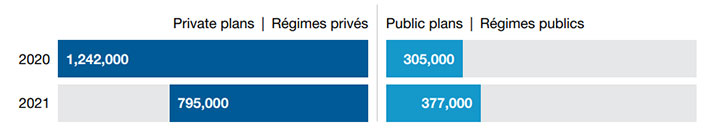
Figure 2 - Text version
| Private plans | Public plans | |
|---|---|---|
| 2020 | 1,242,000 | 305,000 |
| 2021 | 795,000 | 377,000 |
Note: For reference, private and public plans included in the analysis counted 11.8M and 5.3M observed claimants in 2020, respectively.
2. Who were the missing claimants?
- Only specific groups of claimants declined.
- By spending group, claimants with less than $5,000 in annual spending declined relative to pre-pandemic trends, for both private and public plans, while those with spending over $5,000 increased (Figure 3).
- Adults aged 25 to 64 were the age group with the most missing claimants (Figure 4).
Figure 3: Missing claimants by spending level and plan type
Public plan claimants

Figure 3 - Text version
| Spending level | 2020 | 2021 |
|---|---|---|
| Under $5,000 | 152,300 | 250,200 |
| Over $5,000 | -1,600 | -1,300 |
Private plan claimants

Figure 3 - Text version
| Spending level | 2020 | 2021 |
|---|---|---|
| Under $5,000 | 823,100 | 635,400 |
| Over $5,000 | -6,700 | -14,900 |
Figure 4: Missing claimants by age group and plan type
Public plan claimants
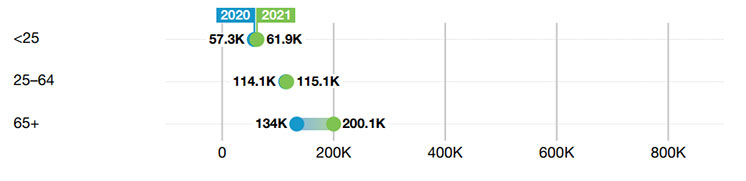
Figure 4 - Text version
| Age group | 2020 | 2021 |
|---|---|---|
| Less than 25 | 57,300 | 61,900 |
| 25 to 64 | 114,100 | 115,100 |
| 65 and older | 134,000 | 200,100 |
Private plan claimants
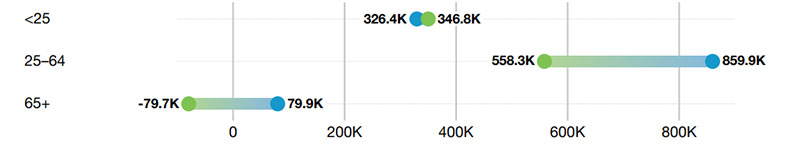
Figure 4 - Text version
| Age group | 2020 | 2021 |
|---|---|---|
| Less than 25 | 326,400 | 346,800 |
| 25 to 64 | 859,900 | 558,300 |
| 65 and older | 79,900 | -79,700 |
3. Some therapeutic classes saw important declines in claims
- Despite a decline in claimants relative to pre-pandemic trends, the total number of claims filed to public and private plans continued to grow in 2020 and 2021. Specific therapeutic classes, however, saw important declines in claims.
- The therapeutic classes that saw the greatest declines in claims suggest reduced prescriptions for prophylactics and acute non-COVID-19 infections and infestations rather than avoided care, especially among private plans (Figure 5).
- Claims for classes associated with chronic diseases did not decline.
Figure 5: Therapeutic classes with the greatest declines in claims for public and private plans
Public plans
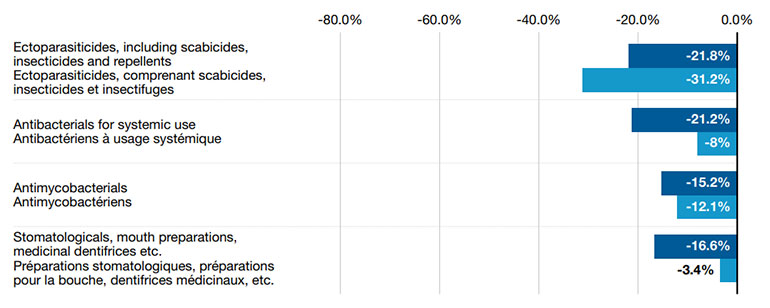
Figure 5 - Text version
| Therapeutic class | Percent change from 2019 to 2020 | Percent change from 2019 to 2021 |
|---|---|---|
| Ectoparasiticides, including scabicides, insecticides and repellents | -21.8% | -31.2% |
| Antibacterials for systemic use | -21.2% | -8.0% |
| Antimycobacterials | -15.2% | -12.1% |
| Stomatologicals, mouth preparations, medicinal dentifrices etc. | -16.6% | -3.4% |
Private plans
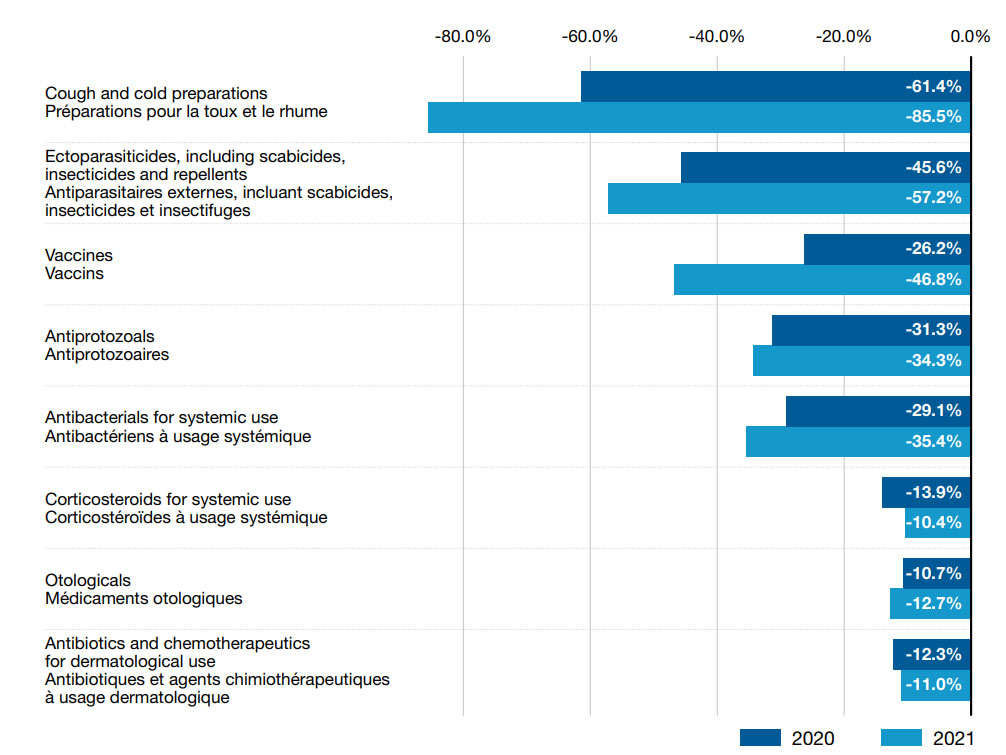
Figure 5 - Text version
| Therapeutic class | Percent change from 2019 to 2020 | Percent change from 2019 to 2021 |
|---|---|---|
| Cough and cold preparations | -61.4% | -85.5% |
| Ectoparasiticides, including scabicides, insecticides and repellents | -45.6% | -57.2% |
| Vaccines | -26.2% | -46.8% |
| Antiprotozoals | -31.3% | -34.3% |
| Antibacterials for systemic use | -29.1% | -35.4% |
| Corticosteroids for systemic use | -13.9% | -10.4% |
| Otologicals | -10.7% | -12.7% |
| Antibiotics and chemotherapeutics for dermatological use | -12.3% | -11% |
Note: Declines shown are relative to 2019 claims. Classes shown had 10,000+ annual claims on average during the pre-pandemic (2015–2019) period, had declines greater than 10% in 2020 or 2021 relative to 2019 levels, and had declines relative to the pre-pandemic trend greater than 1.96 times the standard deviation observed during the pre-pandemic period.
Conclusions
With the onset of the COVID-19 pandemic, over 1M fewer Canadians filed drug plan claims in 2020 and 2021 than expected based on pre-pandemic trends. A decline in claimants was found in both public and private drug plans. Groups of claimants showing the greatest declines were those with lower spending levels and privately covered adults aged less than 65.
Despite a partial rebound in 2021, the number of claimants in both types of plans remained well below historical trends, possibly foreshadowing further rebound in the coming years.
Limitations
All analyses performed are observational and cannot inform about the causal effect of the COVID-19 pandemic. Two public plans were not included in the analysis: the Régie de l’Assurance Maladie du Québec is not included in the NPDUIS data and data for the Non-Insured Health Benefits program were not available for fiscal years 2020-21 and 2021-22. Private plan data for year 2021 were adjusted to account for an exogenous change in data capture (see Data section) and may be considered preliminary pending revisions from the data supplier. No data were available to study public and private drug plan enrollees during the period. For that reason, the analyses could not distinguish between changes due to eligibility/enrollment (e.g., because of job loss) and those attributable to utilization.