
Biosimilars in Canada: building momentum in the wake of recent switching policies
Presentation to the 2021 CADTH Symposium - November 2021
NPDUIS, Policy and Economic Analysis Branch
Patented Medicine Prices Review Board
Disclosure
I have no actual or potential conflict of interest in relation to this topic or presentation.
Background and Objectives
- In Canada, sales of biologics reached nearly $10 billion in 2020, placing Canada among the top-ranked countries in the Organisation for Economic Co-operation and Development (OECD) in terms of per capita spending
- Given the strength of this market, biosimilars offer a significant opportunity for cost savings for Canadian payers
- This presentation compares the emerging Canadian market for biosimilars with our international counterparts
- The analysis delves more deeply into the market dynamics of biosimilars in Canada and assesses the impact of recent and upcoming biosimilar switching initiatives, highlighting the potential for cost savings
Approach and Data Sources
- This study is part of the PMPRB’s broader reporting in the Biologics in Canada chartbook series
- Data sources:
- IQVIA’s MIDAS® and Canadian Drugstore and Hospital Purchases Audit (CDH) databases
- NPDUIS Database at the Canadian Institute for Health Information (CIHI)
- Limitations:
- IQVIA CDH data comes from purchases made directly from the manufacturer or through a wholesaler and may include mark-ups. While MIDAS data is reported at various levels in the distribution chain, NPDUIS reporting is typically based on manufacturer ex-factory list prices. Cash discounts are not captured in these databases.
- Drug costs from the NPDUIS database are the amounts accepted toward reimbursement and do not reflect rebates and confidential product listing agreements.
Overview
- Biologics market trends in Canada and international comparisons
- Biosimilar availability and uptake in Canada vs. other OECD countries
- Biosimilar uptake challenges and current policies
- Cost-saving opportunities from biosimilars
Biologic medicine sales have tripled over the last decade
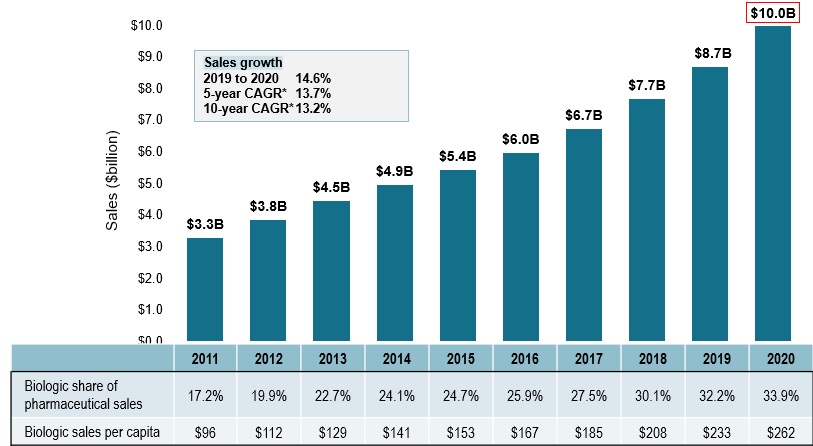
- Biologic medicine sales in Canada tripled over the last 10 years, rising from $3.3B in 2011 to $10.0B in 2020
- This represents a 10-year compound annual growth rate of 13.2%, with a 14.6% increase in the last year alone
- Sales of biologic medicines accounted for 1/3 of pharmaceutical spending in Canada in 2020 and sales per capita reached $262
Sales of biologic medicines in Canada, 2011 to 2020
Long description
A bar graph depicts the sales growth of biologic medicines in Canada, with annual sales reported in billions of dollars for each year from 2011 to 2020. Below, a table reports the share of biologic sales as a percentage of the total prescription pharmaceutical market for each year, as well as the annual biologic sales per capita. The growth rate in sales from 2019 to 2020 (14.6%) as well as the 5-year (13.7%) and 10-year (13.2%) compound annual growth rates are also given.
| 2011 | 2012 | 2013 | 2014 | 2015 | 2016 | 2017 | 2018 | 2019 | 2020 | |
|---|---|---|---|---|---|---|---|---|---|---|
Canadian sales in billions of dollars |
$3.3 |
$3.8 |
$4.5 |
$4.9 |
$5.4 |
$6.0 |
$6.7 |
$7.7 |
$8.7 |
$10.0 |
Biologic share of pharmaceutical sales |
17.2% |
19.9% |
22.7% |
24.1% |
24.7% |
25.9% |
27.5% |
30.1% |
32.2% |
33.9% |
Biologic sales per capita |
$96 |
$112 |
$129 |
$141 |
$153 |
$167 |
$185 |
$208 |
$233 |
$262 |
Note: Includes all prescription biologics as per Health Canada’s Drug Product Database (DPD) Schedule D and Prescription lists, as well as insulin biologics in Canada as of 2020.
Data source: MIDAS® Database, prescription retail and hospital markets, 2020, IQVIA (all rights reserved).
Canada placed among the top-ranked countries in the OECD for biologics spending
- The biologic medicines approved in Canada make up a large share of pharmaceutical sales in international markets
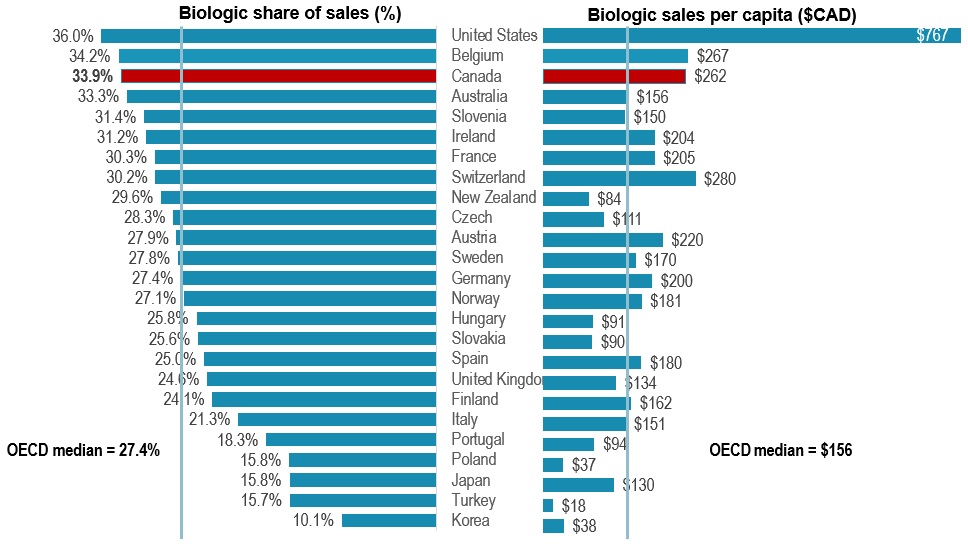
- In 2020, biologics accounted for 33.9% of pharmaceutical sales in Canada, the third-highest share in the OECD and exceeding the median of 27.4%
- Canada spends more on biologics per capita than most industrialized countries, at an average of $262 per person in 2020, representing the fourth-highest per capita sales among the OECD countries
Biologic share of total sales and sales per capita, OECD*, 2020
Long description
A split bar graph gives the biologic share of total pharmaceutical sales and biologic sales per capita for each country in the Organisation for Economic Co-operation and Development in 2020. The median share of sales for all countries listed was 27.4% while the median sales per capita was $156.
| Country | Biologic share of sales | Biologic sales per capita |
|---|---|---|
United States |
36.0% |
$767 |
Belgium |
34.2% |
$267 |
Canada |
33.9% |
$262 |
Australia |
33.3% |
$156 |
Slovenia |
31.4% |
$150 |
Ireland |
31.2% |
$204 |
France |
30.3% |
$205 |
Switzerland |
30.2% |
$280 |
New Zealand |
29.6% |
$84 |
Czech Republic |
28.3% |
$111 |
Austria |
27.9% |
$220 |
Sweden |
27.8% |
$170 |
Germany |
27.4% |
$200 |
Norway |
27.1% |
$181 |
Hungary |
25.8% |
$91 |
Slovakia |
25.6% |
$90 |
Spain |
25.0% |
$180 |
United Kingdom |
24.6% |
$134 |
Finland |
24.1% |
$162 |
Italy |
21.3% |
$151 |
Portugal |
18.3% |
$94 |
Poland |
15.8% |
$37 |
Japan |
15.8% |
$130 |
Turkey |
15.7% |
$18 |
South Korea |
10.1% |
$38 |
* Countries with limited sales data were excluded from this analysis.
Note: Includes all prescription biologics as per Health Canada’s Drug Product Database (DPD) Schedule D and Prescription lists, as well as insulin biologics in Canada as of 2020.
Data source: MIDAS® Database, prescription retail and hospital markets, 2020, IQVIA (all rights reserved).
Availability of biosimilars in Canada has increased recently, without a major impact on overall costs
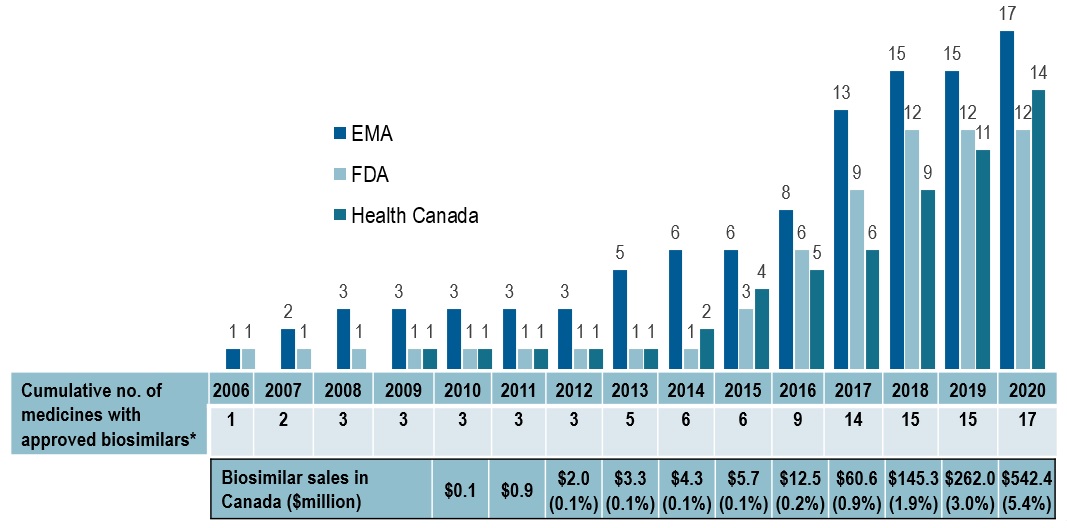
- Despite the increase in the number of biosimilars, both Canada and the US continue to lag behind the European market in terms of the number of approvals and availability
- There has been an uptake in Canada over the last two years as several biologic drugs now face biosimilar competition
- While the number of biosimilars has increased in Canada, their share of overall biologic sales remains modest, at 5.4% in 2020
Cumulative number of medicines* with biosimilars approved in Europe, the US, or Canada, 2006 to 2020
Long description
A bar graph gives the cumulative number of medicines with biosimilars approved from 2006 to 2020 by each of three regulatory agencies: the Food and Drug Administration in the United States, the European Medicines Agency, and Health Canada. A table below gives the total cumulative number of medicines with approved biosimilars across all three jurisdictions as well as the biosimilar sales in Canada, in millions of dollars, and biosimilar share of biologic sales.
| 2006 | 2007 | 2008 | 2009 | 2010 | 2011 | 2012 | 2013 | 2014 | 2015 | 2016 | 2017 | 2018 | 2019 | 2020 | |
|---|---|---|---|---|---|---|---|---|---|---|---|---|---|---|---|
European Medicines Agency |
1 |
2 |
3 |
3 |
3 |
3 |
3 |
5 |
6 |
6 |
8 |
13 |
15 |
15 |
17 |
US Food and Drug Administration |
1 |
1 |
1 |
1 |
1 |
1 |
1 |
1 |
1 |
3 |
6 |
9 |
12 |
12 |
12 |
Health Canada |
– |
– |
– |
1 |
1 |
1 |
1 |
1 |
2 |
4 |
5 |
6 |
9 |
11 |
14 |
Cumulative number of medicines with approved biosimilars |
1 |
2 |
3 |
3 |
3 |
3 |
3 |
5 |
6 |
6 |
9 |
14 |
15 |
15 |
17 |
Biosimilar sales in Canada, in millions of dollars |
– |
– |
– |
– |
$0.1 |
$0.9 |
$2.0 |
$3.3 |
$4.3 |
$5.7 |
$12.5 |
$60.6 |
$145.3 |
$262.0 |
$542.4 |
Biosimilar share of biologic sales in Canada |
– |
– |
– |
– |
– |
– |
0.1% |
0.1% |
0.1% |
0.1% |
0.2% |
0.9% |
1.9% |
3.0% |
5.4% |
* Multiple biosimilar trade names referencing the same originator biologic are counted as one biosimilar medicine.
Data source: US Food and Drug Administration (FDA), European Medicines Agency (EMA), and Health Canada databases;
MIDAS® Database, prescription retail and hospital markets, 2006-2020, IQVIA (all rights reserved).
Biosimilar uptake in Canada is moderate compared to other OECD markets
- Canada demonstrates growing use of biosimilars, compared to two years ago
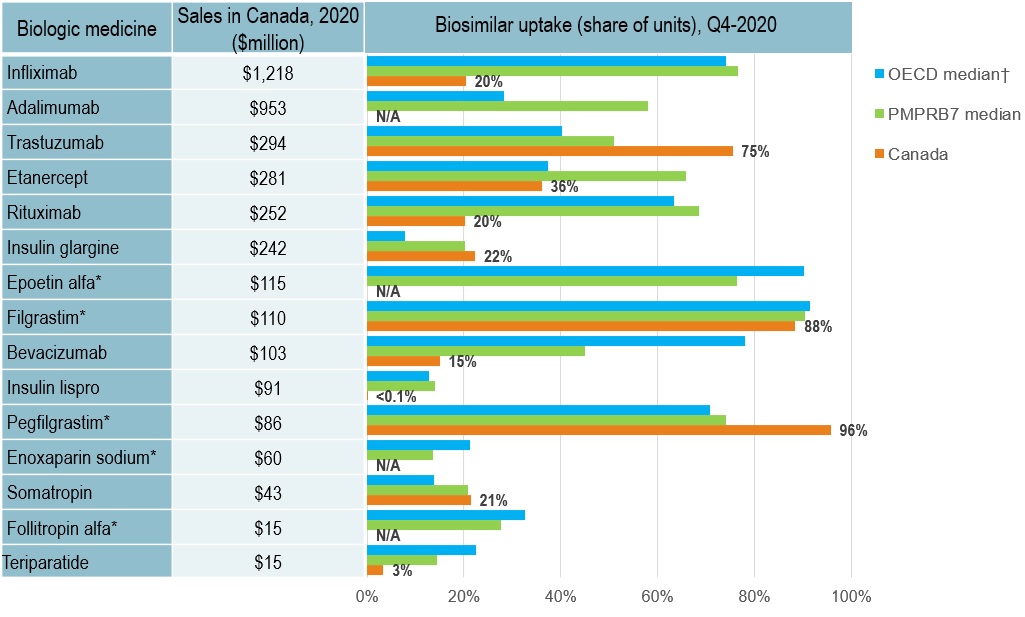
- Infliximab, the highest-selling biologic and one of the earliest with a biosimilar available in Canada, had a 20% biosimilar share in Canada in 2020, well below the OECD median of 73%
- Adalimumab, the 2nd top-selling biologic medicine, had no recorded biosimilar sales in Canada in 2020 and a median uptake of 58% in the PMPRB7 and 28% in the OECD
Long description
A bar graph reports the biosimilar uptake, in share of units, for Canada, the PMPRB7, and the Organisation for Economic Co-operation and Development as of the fourth quarter of 2020. The graph compares the uptake for biologic medicines with biosimilar availability in Canada. Total 2020 Canadian sales for each medicine are also given.
| Biologic medicine | Sales in Canada, 2020, in millions of dollars | Biosimilar uptake, Q4-2020, share of units | ||
|---|---|---|---|---|
| Median OECD | Median PMPRB7 | Canada | ||
Infliximab |
$1,218 |
74% |
77% |
20% |
Adalimumab |
$953 |
28% |
58% |
0% |
Trastuzumab |
$294 |
40% |
51% |
75% |
Etanercept |
$281 |
37% |
66% |
36% |
Rituximab |
$252 |
63% |
69% |
20% |
Insulin glargine |
$242 |
8% |
20% |
22% |
Epoetin alfa* |
$115 |
90% |
76% |
0% |
Filgrastim* |
$110 |
91% |
90% |
88% |
Bevacizumab |
$103 |
78% |
45% |
15% |
Insulin lispro |
$91 |
13% |
14% |
0% |
Pegfilgrastim* |
$86 |
71% |
74% |
96% |
Enoxaparin sodium* |
$60 |
21% |
14% |
0% |
Somatropin |
$43 |
14% |
21% |
21% |
Follitropin alfa* |
$15 |
33% |
28% |
0% |
Teriparatide |
$15 |
22% |
14% |
3% |
* Acute biologics.
† Canada is excluded from the median
Data source: MIDAS® Database, prescription retail and hospital markets, 2020, IQVIA (all rights reserved).
Uptake of biosimilars in the public plans has been modest in 2019/20 owing to a number of limiting factors
Several key factors influence biosimilar uptake in Canada
Interchangeability
Biosimilars are not interchangeable with the reference biologic.
Patient Switching
Switching is not mandatory; Health Canada recommends that a decision to switch a patient from a reference biologic drug to a biosimilar be made by the treating physician in consultation with the patient and take into account any policies of the relevant jurisdiction.
Maintaining Market Share
Strategies/initiatives undertaken by the manufacturer of the originator biologic may limit the uptake of biosimilars.
Biosimilars recently approved in Canada and reimbursed in NPDUIS public drug plans, 2019/20
| Originator biologic | Biosimilar | |||||
|---|---|---|---|---|---|---|
| Trade name (medicinal ingredient) | Drug cost, $million (% share) |
Trade name | Market approval | First reimbursement | Price discount† from reference biologic | Share of prescriptions for medicinal ingredient |
Remicade (infliximab) |
$372.0 (3.7%) |
Inflectra |
15-Jan-14 |
Q1-2016 |
46.8% |
18.4% |
Renflexis |
01-Dec-17 |
Q3-2018 |
50.1% |
|||
Enbrel (etanercept) |
$119.3 (1.2%) |
Brenzys |
31-Aug-16 |
Q3-2017 |
33.7% |
30.6% |
Erelzi |
06-Apr-17 |
Q4-2017 |
37.2% |
|||
Lantus |
$117.3 (1.2%) |
Basaglar |
01-Sep-15 |
Q3-2017 |
25.0% |
15.3% |
Neupogen (filgrastim) |
$4.2 (<0.1%) |
Grastofil |
07-Dec-15 |
Q4-2016 |
25.0% |
94.0% |
Neulasta (pegfilgrastim) |
$1.7 (<0.1%) |
Lapelga |
05-Apr-18 |
Q2-2019 |
25.0%‡ |
94.4% |
† Based on Ontario Drug Benefit formulary listing price at the time of the biosimilar entry. This price may change over time; for
example, the list price for Brenzys was recently lowered to match Erelzi.
‡ Based on the value reported in CADTH’s Biosimilar Summary Dossier, which sourced prices from Alberta’s Health Formulary
as Alberta was the only CDR-participating jurisdiction with publicly available pricing for Neulasta at the time of the biosimilar entry.
Data source: National Prescription Drug Utilization Information System Database, Canadian Institute for Health Information.
National and pan-Canadian approaches related to biosimilars
National approaches related to biosimilars:
Regulatory and Pricing
Health Canada - Regulatory Review of Drugs and Devices, which included a project to improve access to biologicals (biosimilars and non-biosimilars)
Patented Medicine Prices Review Board - under the October 2020 Guidelines which operationalize the amended Patented Medicines Regulations (anticipated to come into force January 1, 2022), patented biosimilars will always be classified as Category II; furthermore, an investigation into the pricing of patented biosimilars will only be initiated if a complaint is filed
Reimbursement
Health Technology Assessments - to streamline access, as of June 2019, CADTH no longer reviews biosimilars
pCPA - launched a more comprehensive biosimilar policy and in 2018 released a Biologics Policy Directive in which biological drugs for which biosimilars are already reimbursed as well as any new biosimilar will not be considered for reimbursement unless there are transparent price reductions to the lowest list price
Provincial and territorial biologics policies:
Listing Policies
Same listing status and reimbursement criteria for biologic/biosimilar: Saskatchewan, Nova Scotia, Prince Edward Island, and the NIHB
Preferential access to biosimilars for naïve patients: Ontario, Quebec, Manitoba, Nova Scotia, New Brunswick, Newfoundland and Labrador, Prince Edward Island, Yukon, Nunavut, and the Northwest Territories
Biosimilar Switching Policies
Since May 2019, public drug plans in four provinces have launched non-medical biosimilar switching policies, including British Columbia, Alberta, New Brunswick and Quebec, requiring patients to use biosimilars of approved indications
Such policies are widely discussed and expected to be introduced across Canada
Several Canadian payers have announced or undertaken initiatives to increase biosimilar uptake
| Payer | Initiative | |
|---|---|---|
Public payers |
British Columbia |
Phase 1 & 2, taking place in May and Sept. 2019, British Columbia became the first Canadian province to initiate a switch to biosimilar medicines for patients covered under the PharmaCare program. Under the policy, patients using Enbrel, Remicade, and Lantus for specific indications are required to switch to the biosimilar. |
Phase 3 effective in Aug 2020, the government expanded their switching policy to Rituxan for specific indications. |
||
Phase 4 effective in Apr 2021, individuals on Humira must switch to one of five biosimilars before Oct. 6, 2021. |
||
In 2019, the BC Cancer Agency implemented an Oncology Biosimilars Utilization Policy. Individuals starting new treatment on bevacizumab, trastuzumab, and rituximab will only receive coverage for its biosimilar versions. |
||
Alberta |
Effective Jan. 2021, Alberta announced that all patients taking Enbrel, Remicade, Lantus, Neupogen, Neulasta, Rituxan and Copaxone for indications ranging from rheumatoid arthritis to diabetes and multiple sclerosis will be required to switch to the biosimilar. |
|
The non-medical switching policy has further expanded to include Humira, Lovenox and Hamlog since May 1, 2021. |
||
New Brunswick |
Effective Apr. 2021, New Brunswick will only reimburse biosimilar versions of approved indications of Humira, Enbrel, Remicade, Lantus, Humalog, Rituxan, Copaxone and Lovenox. As at Dec. 8, 2020, they will only cover the biosimilars of Grastofil and Rituxan for specific indications. |
|
Quebec |
Effective Apr. 2021, the Quebec government has banned manufacturers’ loyalty programs (i.e. co-pay cards), that pay the difference between the cost of the innovative medicine and the generic/biosimilar version. |
|
Ministère de la Santé et des Services sociaux (MSSS) announced a non-medical switching policy: between July 7, 2021, and April 13, 2022, patients covered by the Quebec public drug plan who are treated with biologics drugs will be required to switch to biosimilar versions where available and on an ongoing basis, applicable to biosimilar versions of originator biologics are listed on the drug formulary (RAMQ liste des medicaments). |
||
MB, ON, NS, PEI, NL,YT, NIHB |
Planning to implement biosimilar switching strategies. |
|
Private payers |
Green Shield Canada (GSC) initiated a pilot program in 2018 that targeted patients taking Remicade and Enbrel for three rheumatic conditions and reduced reimbursement to the biosimilar price. Under the program, the patient could switch to the biosimilar or remain on the biologic and pay the cost difference. Since then, GSC has opened its biosimilar transition program to any sponsor who wishes to take part. Sun Life introduced its Reference Drug Program (RDP) for certain therapeutic categories of drugs to promote the use of biosimilar drugs. The implementation was delayed to October 1, 2020, because of the COVID-19 pandemic. Pacific Blue Cross (PBC) aligned with BC PharmaCare’s Biosimilars Initiative to transition patients on high-cost originator drugs to their biosimilars. |
|
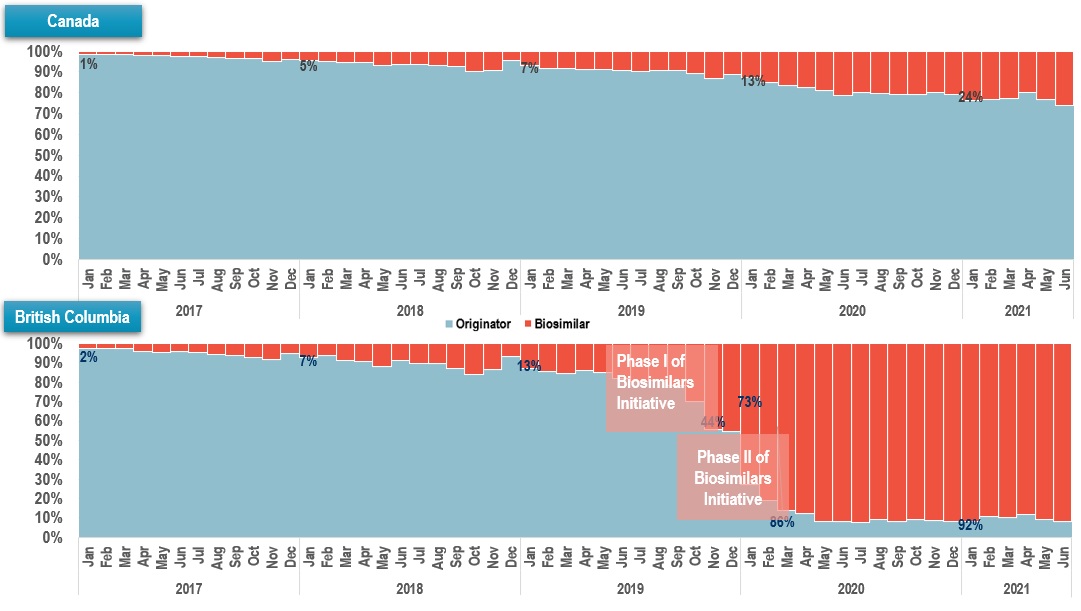
Implemented biosimilar initiatives show positive signs in terms of increased utilization
- Infliximab is one of the biologic medicines targeted by British Columbia PharmaCare’s Biosimilars Initiative
- National uptake of infliximab biosimilars has been slow, with gradual market penetration
- Biosimilar policies in British Columbia led to a dramatic increase in utilization
Biosimilar uptake (share of units), infliximab, Jan 2017 – Jun 2021
Long description
Canada
A stacked bar graph shows the uptake of infliximab biosimilars as a share of all infliximab units sold in Canada from January 2017 to June 2021. Results are given monthly for this period.
| Year | Month | Originator share of units sold | Biosimilar share of units sold |
|---|---|---|---|
2017 |
January |
99% |
1% |
February |
99% |
1% |
|
March |
98% |
2% |
|
April |
98% |
2% |
|
May |
98% |
2% |
|
June |
97% |
3% |
|
July |
97% |
3% |
|
August |
97% |
3% |
|
September |
97% |
3% |
|
October |
96% |
4% |
|
November |
95% |
5% |
|
December |
96% |
4% |
|
2018 |
January |
95% |
5% |
February |
95% |
5% |
|
March |
94% |
6% |
|
April |
95% |
5% |
|
May |
93% |
7% |
|
June |
94% |
6% |
|
July |
94% |
6% |
|
August |
93% |
7% |
|
September |
93% |
7% |
|
October |
90% |
10% |
|
November |
91% |
9% |
|
December |
95% |
5% |
|
2019 |
January |
93% |
7% |
February |
92% |
8% |
|
March |
92% |
8% |
|
April |
91% |
9% |
|
May |
91% |
9% |
|
June |
91% |
9% |
|
July |
90% |
10% |
|
August |
91% |
9% |
|
September |
91% |
9% |
|
October |
89% |
11% |
|
November |
87% |
13% |
|
December |
89% |
11% |
|
2020 |
January |
87% |
13% |
February |
85% |
15% |
|
March |
83% |
17% |
|
April |
82% |
18% |
|
May |
81% |
19% |
|
June |
79% |
21% |
|
July |
80% |
20% |
|
August |
80% |
20% |
|
September |
79% |
21% |
|
October |
79% |
21% |
|
November |
80% |
20% |
|
December |
79% |
21% |
|
2021 |
January |
76% |
24% |
February |
77% |
23% |
|
March |
77% |
23% |
|
April |
80% |
20% |
|
May |
77% |
23% |
|
June |
74% |
26% |
British Columbia
A stacked bar graph shows the uptake of infliximab biosimilars as a share of all infliximab units sold in British Columbia from January 2017 to June 2021. Results are given monthly for this period. Phase I of the Biosimilars Initiative started in May 2019 and Phase II started in September 2019.
| Year | Month | Originator share of units sold | Biosimilar share of units sold |
|---|---|---|---|
2017 |
January |
98% |
2% |
February |
98% |
2% |
|
March |
97% |
3% |
|
April |
96% |
4% |
|
May |
96% |
4% |
|
June |
96% |
4% |
|
July |
95% |
5% |
|
August |
94% |
6% |
|
September |
94% |
6% |
|
October |
93% |
7% |
|
November |
92% |
8% |
|
December |
95% |
5% |
|
2018 |
January |
93% |
7% |
February |
94% |
6% |
|
March |
91% |
9% |
|
April |
91% |
9% |
|
May |
88% |
12% |
|
June |
91% |
9% |
|
July |
90% |
10% |
|
August |
89% |
11% |
|
September |
87% |
13% |
|
October |
84% |
16% |
|
November |
87% |
13% |
|
December |
93% |
7% |
|
2019 |
January |
87% |
13% |
February |
85% |
15% |
|
March |
84% |
16% |
|
April |
86% |
14% |
|
May |
85% |
15% |
|
June |
82% |
18% |
|
July |
80% |
20% |
|
August |
81% |
19% |
|
September |
78% |
22% |
|
October |
70% |
30% |
|
November |
56% |
44% |
|
December |
54% |
46% |
|
2020 |
January |
27% |
73% |
February |
19% |
81% |
|
March |
14% |
86% |
|
April |
12% |
88% |
|
May |
8% |
92% |
|
June |
8% |
92% |
|
July |
8% |
92% |
|
August |
9% |
91% |
|
September |
8% |
92% |
|
October |
9% |
91% |
|
November |
9% |
91% |
|
December |
8% |
92% |
|
2021 |
January |
8% |
92% |
February |
11% |
89% |
|
March |
10% |
90% |
|
April |
12% |
88% |
|
May |
9% |
91% |
|
June |
8% |
92% |
Data source: Canadian Drugstore and Hospital Purchases Audit (CDH) databases, prescription retail and hospital markets, IQVIA (all rights reserved).
Canadians are only realizing a fraction of the potential savings from biosimilars
Cost implications of wider uptake* of biosimilar use prompted by biosimilar switching initiatives, 2020
| Biologic medicine** | Scenarios | Sales in Canadian national market† | BC | AB | SK | MB | ON | QC | NB | NS | PE+NL |
|---|---|---|---|---|---|---|---|---|---|---|---|
Infliximab |
Drug cost – status quo |
$ 1,245.3M |
$ 65.4M |
$ 158.5M |
$ 49.0M |
$ 40.8M |
$ 408.5M |
$ 388.7M |
$ 50.7M |
$ 50.2M |
$ 33.5M |
Estimated cost implication by biosimilars uptake under switching initiatives (share of total drug cost) |
$ 452.2M |
$ 49.7M |
$ 20.7M |
$ 14.9M |
$ 166.2M |
$ 141.2M |
$ 22.3M |
$ 22.3M |
$ 14.9M |
||
36% |
31% |
42% |
37% |
41% |
36% |
44% |
44% |
45% |
|||
Etanercept |
Drug cost – status quo |
$ 287.0M |
$ 30.3M |
$ 31.8M |
$ 10.5M |
$ 13.9M |
$ 106.9M |
$ 66.4M |
$ 9.8M |
$ 11.3M |
$ 6.1M |
Estimated cost implication by biosimilars uptake under switching initiatives (share of total drug cost) |
$ 64.2M |
$ 7.1M |
$ 2.7M |
$ 4.1M |
$ 28.4M |
$ 13.8M |
$ 2.9M |
$ 3.5M |
$ 1.7M |
||
22% |
22% |
26% |
29% |
27% |
21% |
30% |
31% |
28% |
|||
Insulin glargine |
Drug cost – status quo |
$ 204.5M |
$ 26.1M |
$ 26.1M |
$ 12.3M |
$ 8.2M |
$ 77.6M |
$ 30.2M |
$ 7.7M |
$ 9.2M |
$ 7.0M |
Estimated cost implication by biosimilars uptake under switching initiatives (share of total drug cost) |
$ 29.5M |
$ 4.4M |
$ 2.5M |
$ 1.8M |
$ 15.1M |
$ 3.7M |
$ 0.8M |
$ 0.9M |
$ 0.4M |
||
14% |
17% |
20% |
21% |
19% |
12% |
11% |
10% |
6% |
|||
Total^ drug cost implication for biologics under biosimilars switching initiatives ($, %) |
$ 545.9M |
$ 61.3M |
$ 25.9M |
$ 20.8M |
$ 209.6M |
$ 158.6M |
$ 26.0M |
$ 26.7M |
$ 17.0M |
||
31% |
28% |
36% |
33% |
35% |
33% |
38% |
38% |
37% |
|||
Canadian savings versus potential savings, 2020

Long description
A horizontal bar graph shows the difference between realized and unrealized potential savings from increased biosimilar uptake and/or lower prices in Canada in 2020. Results are given as a percentage of the total potential savings and as a dollar amount.
In 2020, realized savings amounted to $168 million (or 23% of total potential savings), leaving $546 million (77%) in unrealized potential savings.
* Based on the biosimilar uptakes in British Columbia, resulting from Phase I & II Biosimilars Initiatives under the PharmaCare program.
** The biologic medicines targeted by Phase I & II Biosimilars Initiatives in British Columbia PharmaCare.
† Prescription retail and hospital markets, sales made directly from the manufacturer or through a wholesaler and may include mark-ups. Cash discounts and rebates are not reflected.
^ Total results for the biologic medicines and provinces reported in this table.
Data source: Canadian Drugstore and Hospital Purchases Audit (CDH) databases, prescription retail and hospital markets, IQVIA (all rights reserved).
Methods and limitations about the estimation of cost implications and potential savings from higher biosimilar uptakes
Data:
- CDH databases, prescription retail and hospital markets, units, dollars, 2017 to 2020 (monthly)
Selection of medicines:
- The biologic medicines, targeted by Phase I & II Biosimilars Initiatives in British Columbia, effective in 2019: infliximab, etanercept and insulin glargine (100IU)
Methods:
- Drug cost – status quo: the actual drug cost of status quo uptake trend across provinces
- Estimated cost implication: the cost differentials between status quo and a scenario if the biosimilar uptakes for the targeted medicines were aligned with the uptake* of biosimilar utilization prompted by non-medical biosimilar switching policies, i.e., Biosimilars Initiatives in British Columbia
- Realized savings: the cost differentials between status quo and a market without biosimilars
- Unrealized potential savings: obtained from the estimated cost implications
Limitations:
- Effects on the price levels of biosimilars were not explored in the estimation; prices from status quo scenario were used to calculate cost implications and savings
* The aggregated biosimilar units share out of the total units for the same biologic ingredient in the year of 2020.
Conclusions
- Biologics are a high-growth market segment in Canada, with sales tripling over the last decade
- Availability of biosimilars in Canada has increased recently, without a major impact on overall costs
- Biosimilars uptake in Canada is moderate compared to other OECD markets
- There are ongoing initiatives to improve uptake and pricing nation-wide
- The potential savings offered by biosimilars are significant in Canada