
Biosimilars in Canada: Policies to Promote Switching and What It Means for Payers
Presentation to the 2025 Annual CAHSPR Conference May 2025
Presented by: Yvonne Zhang, Senior Economist
NPDUIS Research Initiative, Patented Medicine Prices Review Board
Disclosure: I have no actual or potential conflict of interest in relation to this topic or presentation.
Background and Objectives
- Potential savings from biosimilars are a topic of international interest with relevance for Canada.
- Given Canada’s high-use, high-cost biologics market, increased biosimilar adoption offers a significant opportunity for cost savings for Canadian payers.
- This presentation compares the evolving Canadian market for biosimilars with international counterparts.
- The analysis focuses on biosimilar market dynamics in Canada, assessing the impact of biosimilar switching to date and the potential for further cost savings.
Data Sources and Limitations
- This study is part of the PMPRB’s broader reporting in the Biologics in Canada chartbook series.
- Data sources:
- IQVIA’s MIDAS® Database (2014–2023); US Food and Drug Administration (FDA), European Medicines Agency (EMA), and Health Canada (HC) databases:
- for international comparisons of biosimilar availability, uptake, and sales.
- IQVIA’s Canadian Drugstore and Hospital Purchases Audit (CDH, 2019–2023):
- for Canadian biosimilar uptake and savings potential.
- IQVIA’s MIDAS® Database (2014–2023); US Food and Drug Administration (FDA), European Medicines Agency (EMA), and Health Canada (HC) databases:
- Limitations:
- Biologic medicines were selected based on Health Canada’s Drug Product Database (DPD) Schedule D and Prescription lists and include insulin biologics.
- The cost savings model does not explore the impact of policy changes on biosimilar price levels; prices of biosimilars in the study period were used to calculate cost implications and savings.
Overview
- Biologics market trends in Canada and international comparisons
- Biosimilar availability and uptake in Canada and other OECD countries
- Biosimilar uptake challenges and current policies in Canada
- Cost-saving opportunities from biosimilars
Biologic medicine sales tripled over the last decade
Sales of biologic medicines in Canada, 2014 to 2023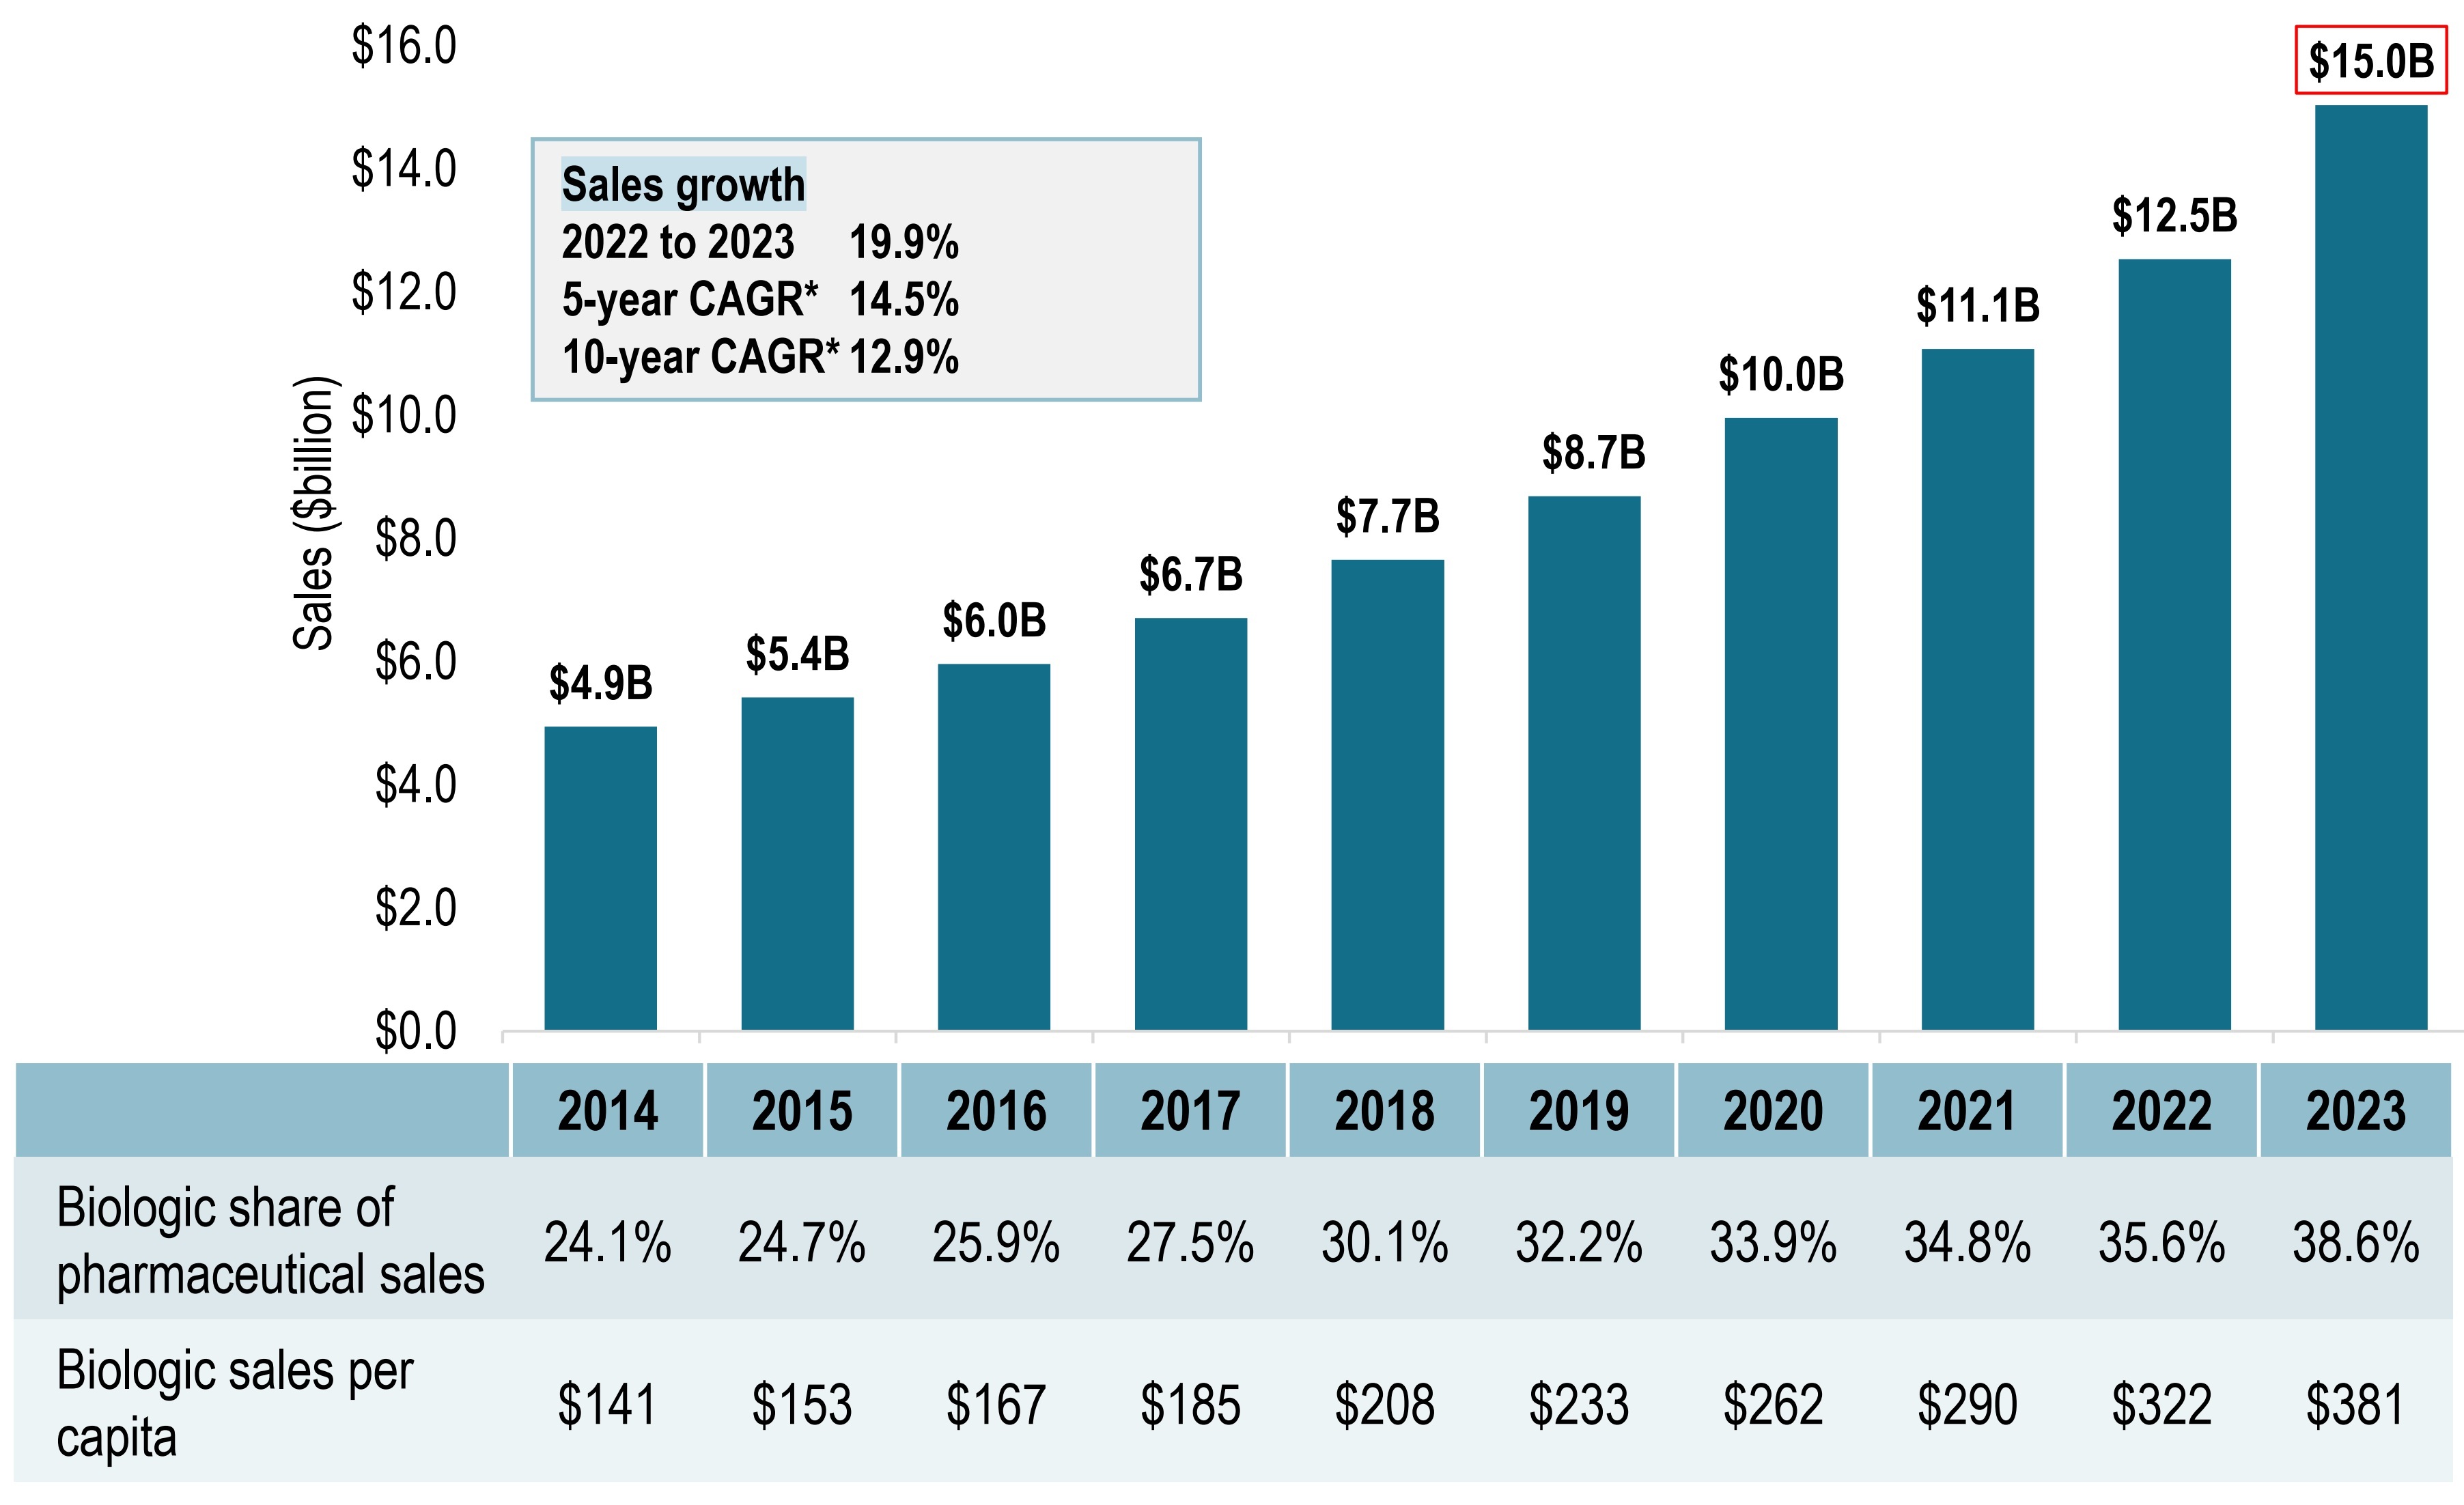
Figure - Text version
Sales growth, 2022 to 2023: 19.9%
5-year compound annual growth rate: 14.5%
10- year compound annual growth rate: 12.9%
| 2014 | 2015 | 2016 | 2017 | 2018 | 2019 | 2020 | 2021 | 2022 | 2023 | |
|---|---|---|---|---|---|---|---|---|---|---|
Sales in billions of dollars |
$4.9 |
$5.4 |
$6.0 |
$6.7 |
$7.7 |
$8.7 |
$10.0 |
$11.1 |
$12.5 |
$15.0 |
Biologic share of pharmaceutical sales |
24.1% |
24.7% |
25.9% |
27.5% |
30.1% |
32.2% |
33.9% |
34.8% |
35.6% |
38.6% |
Biologic sales per capita |
$141 |
$153 |
$167 |
$185 |
$208 |
$233 |
$262 |
$290 |
$322 |
$381 |
Note: Includes all prescription biologics as per Health Canada’s Drug Product Database (DPD) Schedule D and Prescription lists, as well as insulin biologics.
Data source: IQVIA MIDAS® Database. All rights reserved.
- Sales of biologic medicines in Canada tripled from $4.9B in 2014 to $15.0B in 2023.
- This represents a 10-year compound annual growth rate of 12.9%.
- In 2023 alone, biologics sales increased by 19.9%.
Canada placed among the top-ranked countries in the OECD for biologics spending
Biologic share of total sales and sales per capita, OECD*, 2023
Figure - Text version
| Country | Biologic share of sales as a percentage | Biologic sales per capita in Canadian dollars |
|---|---|---|
US |
41.5% |
$1,176 |
Canada |
38.6% |
$381 |
Belgium |
38.0% |
$331 |
Australia |
37.5% |
$210 |
Ireland |
36.5% |
$273 |
France |
35.8% |
$301 |
Switzerland |
34.9% |
$393 |
Austria |
33.5% |
$321 |
Slovenia |
32.7% |
$187 |
Sweden |
32.7% |
$210 |
Norway |
32.7% |
$272 |
Germany |
30.3% |
$252 |
Spain |
30.1% |
$263 |
Finland |
29.6% |
$206 |
Czechia |
29.1% |
$155 |
United Kingdom |
28.5% |
$205 |
Hungary |
28.4% |
$112 |
Italy |
27.9% |
$245 |
Slovakia |
27.4% |
$118 |
New Zealand |
24.4% |
$74 |
Poland |
23.2% |
$75 |
Portugal |
21.9% |
$136 |
Japan |
19.4% |
$134 |
Turkïye |
15.4% |
$23 |
South Korea |
12.7% |
$55
|
OECD median |
30.1% |
$210 |
Note: Includes all prescription biologics as per Health Canada’s Drug Product
Database (DPD) Schedule D and Prescription lists, as well as insulin biologics.
Data source: IQVIA MIDAS® Database. All rights reserved.
* Six OECD countries with incomplete biologic sales data in 2023 were excluded from the figure.
- Biologics accounted for 38.6% of total pharmaceutical sales in Canada in 2023, a higher share than the OECD median of 30.1%.
- Per capita spending on biologics was $381, 80% more than the OECD median of $210, placing Canada second to the U.S.
Biosimilar availability and sales in Canada close to EU and exceed U.S.
Number of medicines* with biosimilars approved in Europe, the US, or Canada, as of 2023
| Biologic Medicine | EMA (n=22) | FDA (n=15) | Health Canada (n=18) |
|---|---|---|---|
Adalimumab |
✔ |
✔ |
✔ |
Aflibercept |
✔ |
|
|
Bevacizumab |
✔ |
✔ |
✔ |
Eculizumab |
✔ |
|
|
Enoxaparin sodium |
✔ |
|
✔ |
Epoetin alfa |
✔ |
✔ |
|
Epoetin zeta |
✔ |
|
|
Etanercept |
✔ |
✔ |
✔ |
Filgrastim |
✔ |
✔ |
✔ |
Follitropin alfa |
✔ |
|
|
Human insulin |
|
|
✔ |
Infliximab |
✔ |
✔ |
✔ |
Insulin aspart |
✔ |
|
✔ |
Insulin glargine |
✔ |
✔ |
✔ |
Insulin lispro |
✔ |
|
✔ |
Natalizumab |
✔ |
✔ |
|
Pegfilgrastim |
✔ |
✔ |
✔ |
Ranibizumab |
✔ |
✔ |
✔ |
Rituximab |
✔ |
✔ |
✔ |
Somatropin |
✔ |
✔ |
✔ |
Teriparatide |
✔ |
|
✔ |
Tocilizumab |
✔ |
✔ |
✔ |
Trastuzumab |
✔ |
✔ |
✔ |
Ustekinumab |
|
✔ |
✔ |
% Biosimilar sales of overall biologics, 2023 |
14.2% |
3.2% |
11.8% |
* Multiple biosimilar trade names referencing the same originator biologic are counted as one biosimilar medicine.
Data source: US Food and Drug Administration (FDA), European Medicines Agency (EMA), and Health Canada databases;
IQVIA MIDAS® Database, prescription retail and hospital markets, All rights reserved.
- As of 2023, biosimilars were approved for 18 biologic medicines in Canada, compared to 22 in the EU and 15 in the U.S.
- Biosimilars accounted for 12% of total biologic sales in Canada, close to 14% in the EU and ahead of 3% in the U.S.
- Availability and market share of biosimilars in Canada have kept pace with Europe, despite fewer approvals.
Canada’s biosimilar uptake kept pace with the OECD trends
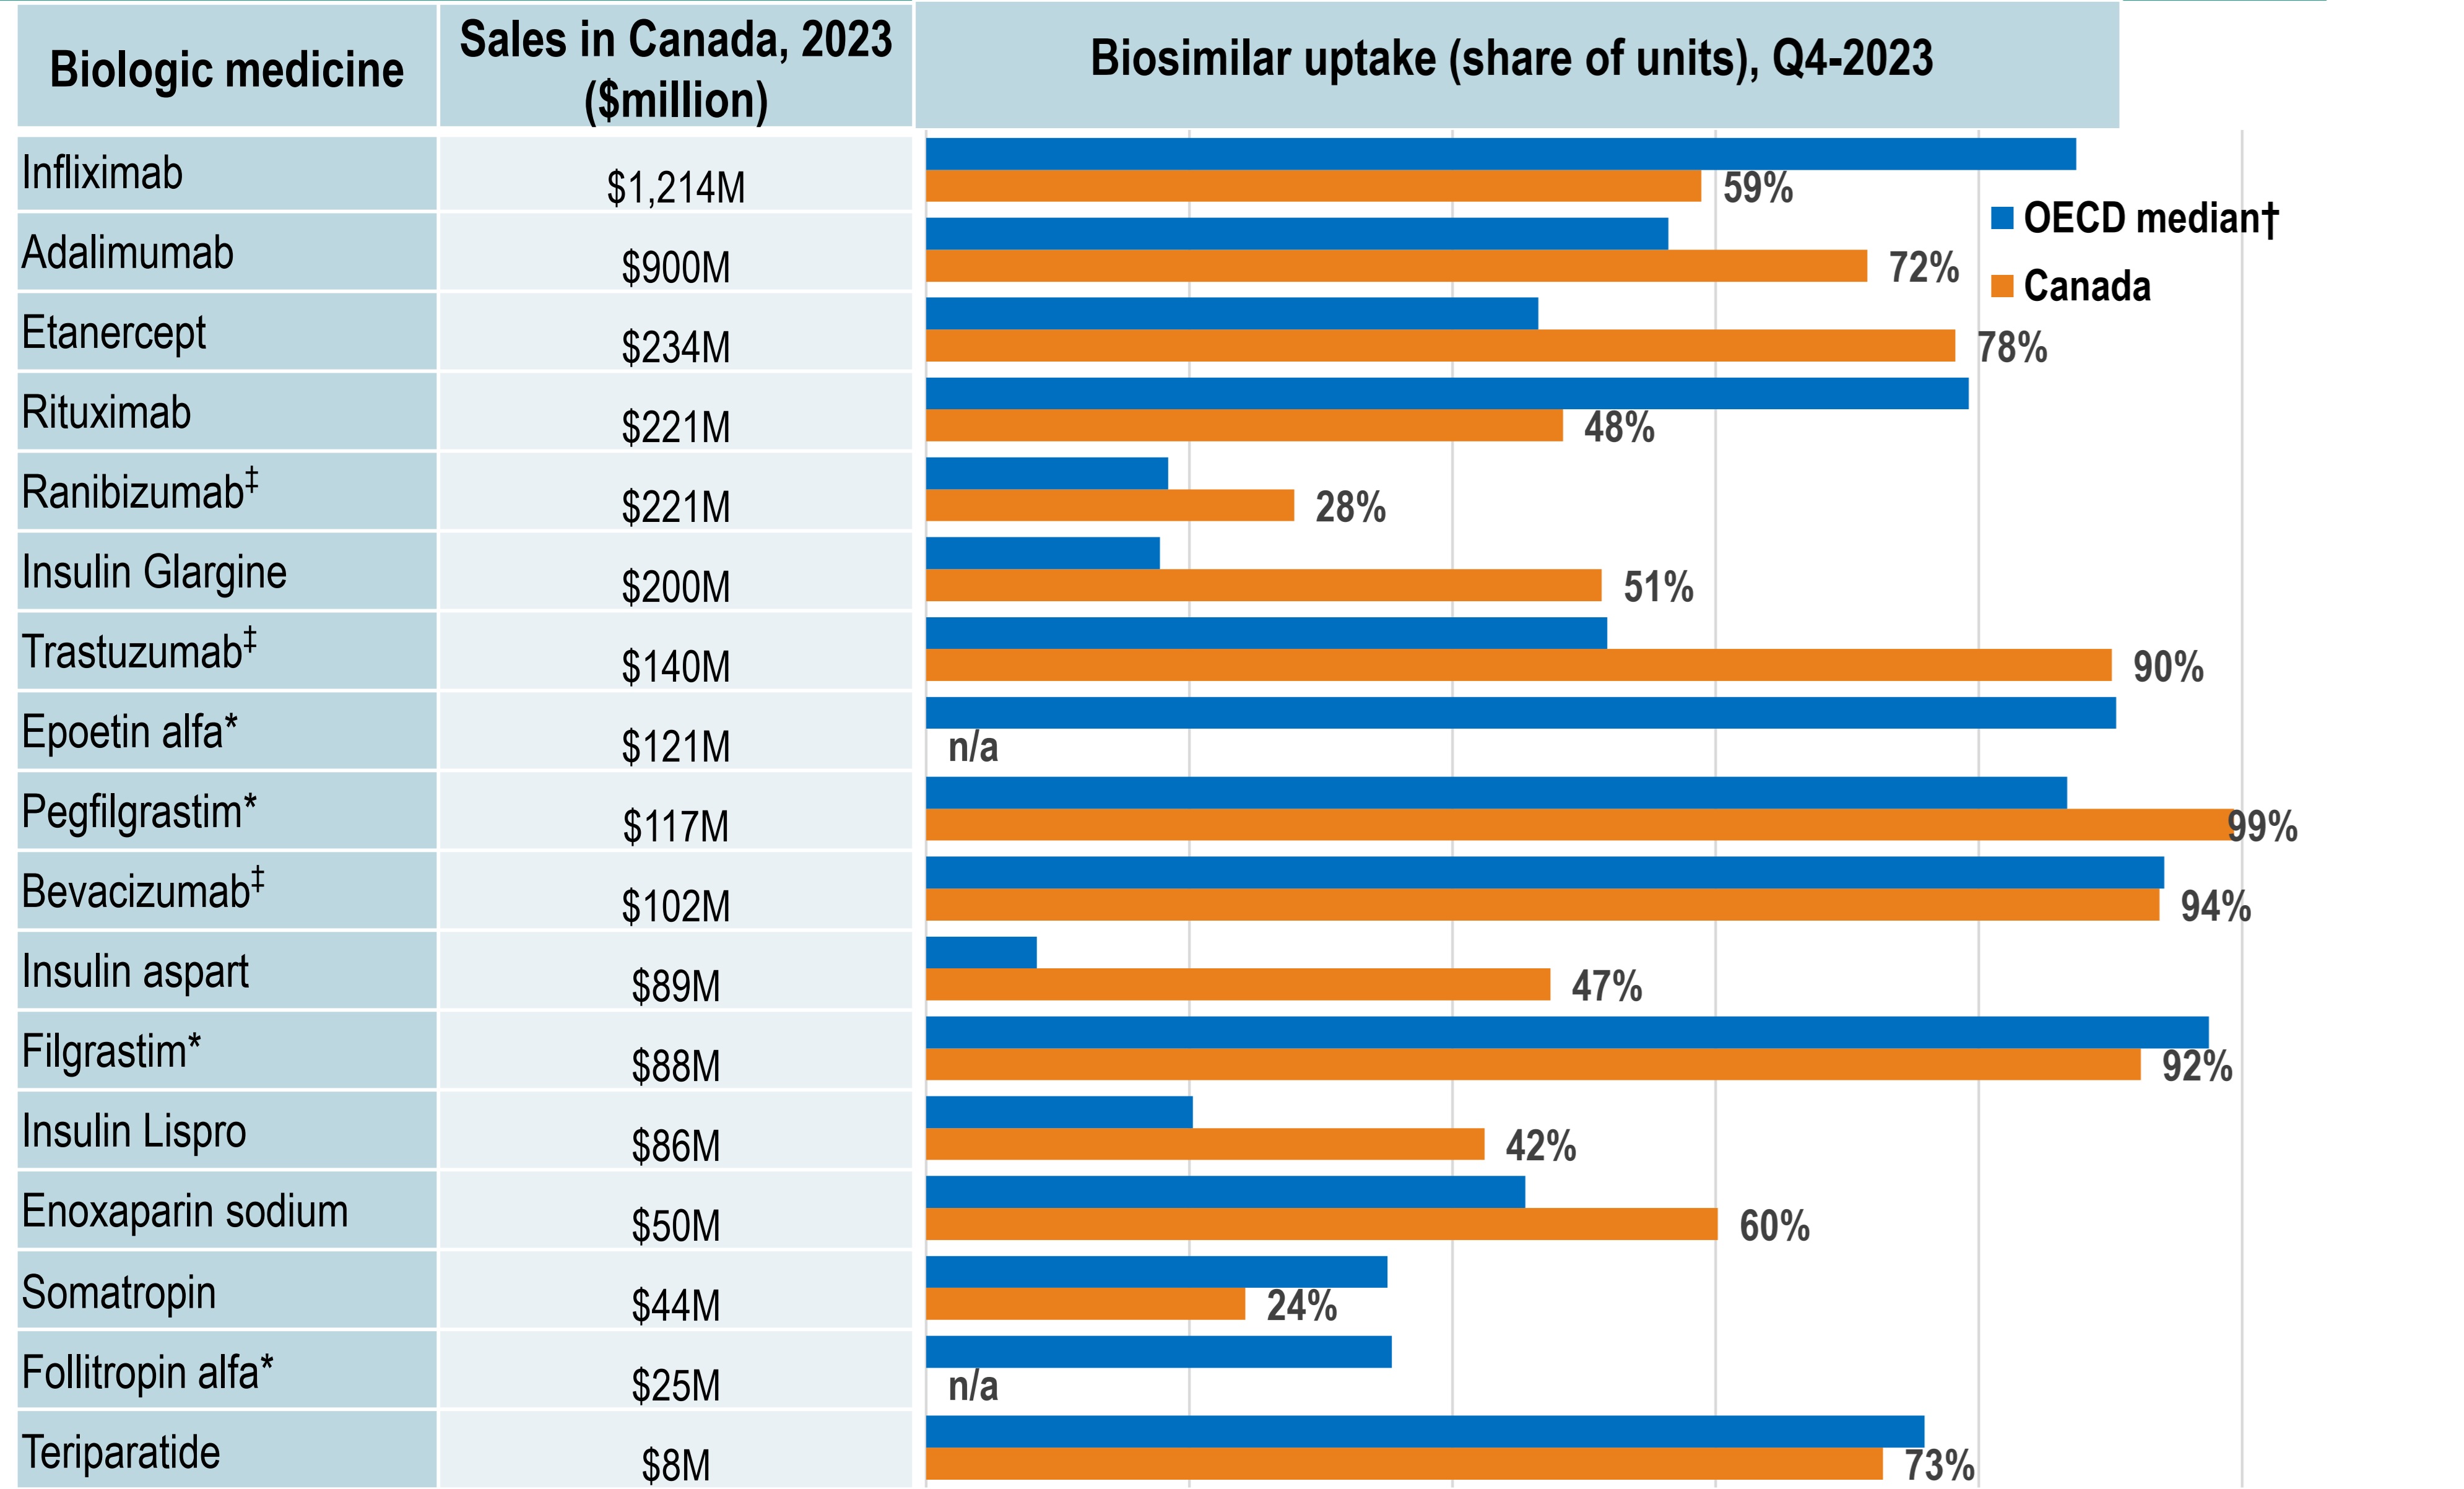
Figure - Text version
| Biologic medicine | Sales in Canada, in millions of dollars, 2023 | Biosimilar uptake as a share of units, fourth quarter of 2023, Canada | Biosimilar uptake as a share of units, fourth quarter of 2023, OECD median |
|---|---|---|---|
Infliximab |
$1,214 |
59% |
87% |
Adalimumab |
$900 |
72% |
56% |
Etanercept |
$234 |
78% |
47% |
Rituximab |
$221 |
48% |
79% |
Ranibizumab‡ |
$221 |
28% |
18% |
Insulin glargine |
$200 |
51% |
18% |
Trastuzumab‡ |
$140 |
90% |
52% |
Epoetin alfa* |
$121 |
n/a |
90% |
Pegfilgrastim* |
$117 |
99% |
87% |
Bevacizumab‡ |
$102 |
94% |
94% |
Insulin aspart |
$89 |
47% |
8% |
Filgrastim* |
$88 |
92% |
97% |
Insulin lispro |
$86 |
42% |
20% |
Enoxaparin sodium |
$50 |
60% |
46% |
Somatropin |
$44 |
24% |
35% |
Follitropin alfa* |
$25 |
n/a |
35% |
Teriparatide |
$8 |
73% |
76% |
*Generally used on a short-term basis.
‡ Mainly indicated in oncology or ophthalmology.
Administered in hospitals or clinic setting in Canada.
† Canada is excluded from the median.
Data source: IQVIA MIDAS® Database. All rights reserved.
- Canada achieved biosimilar uptake similar to or above that of the OECD median for most high-selling biologics.
- Infliximab, the highest-selling biologic, had a 59% biosimilar share in Canada in 2023, below the OECD median of 87%.
- Adalimumab, another high-selling biologic medicine, had a 72% biosimilar uptake in Canada in 2023, higher than the OECD median of 56%.
Uptake of biosimilars in Canada has increased following switching initiatives, led by BC
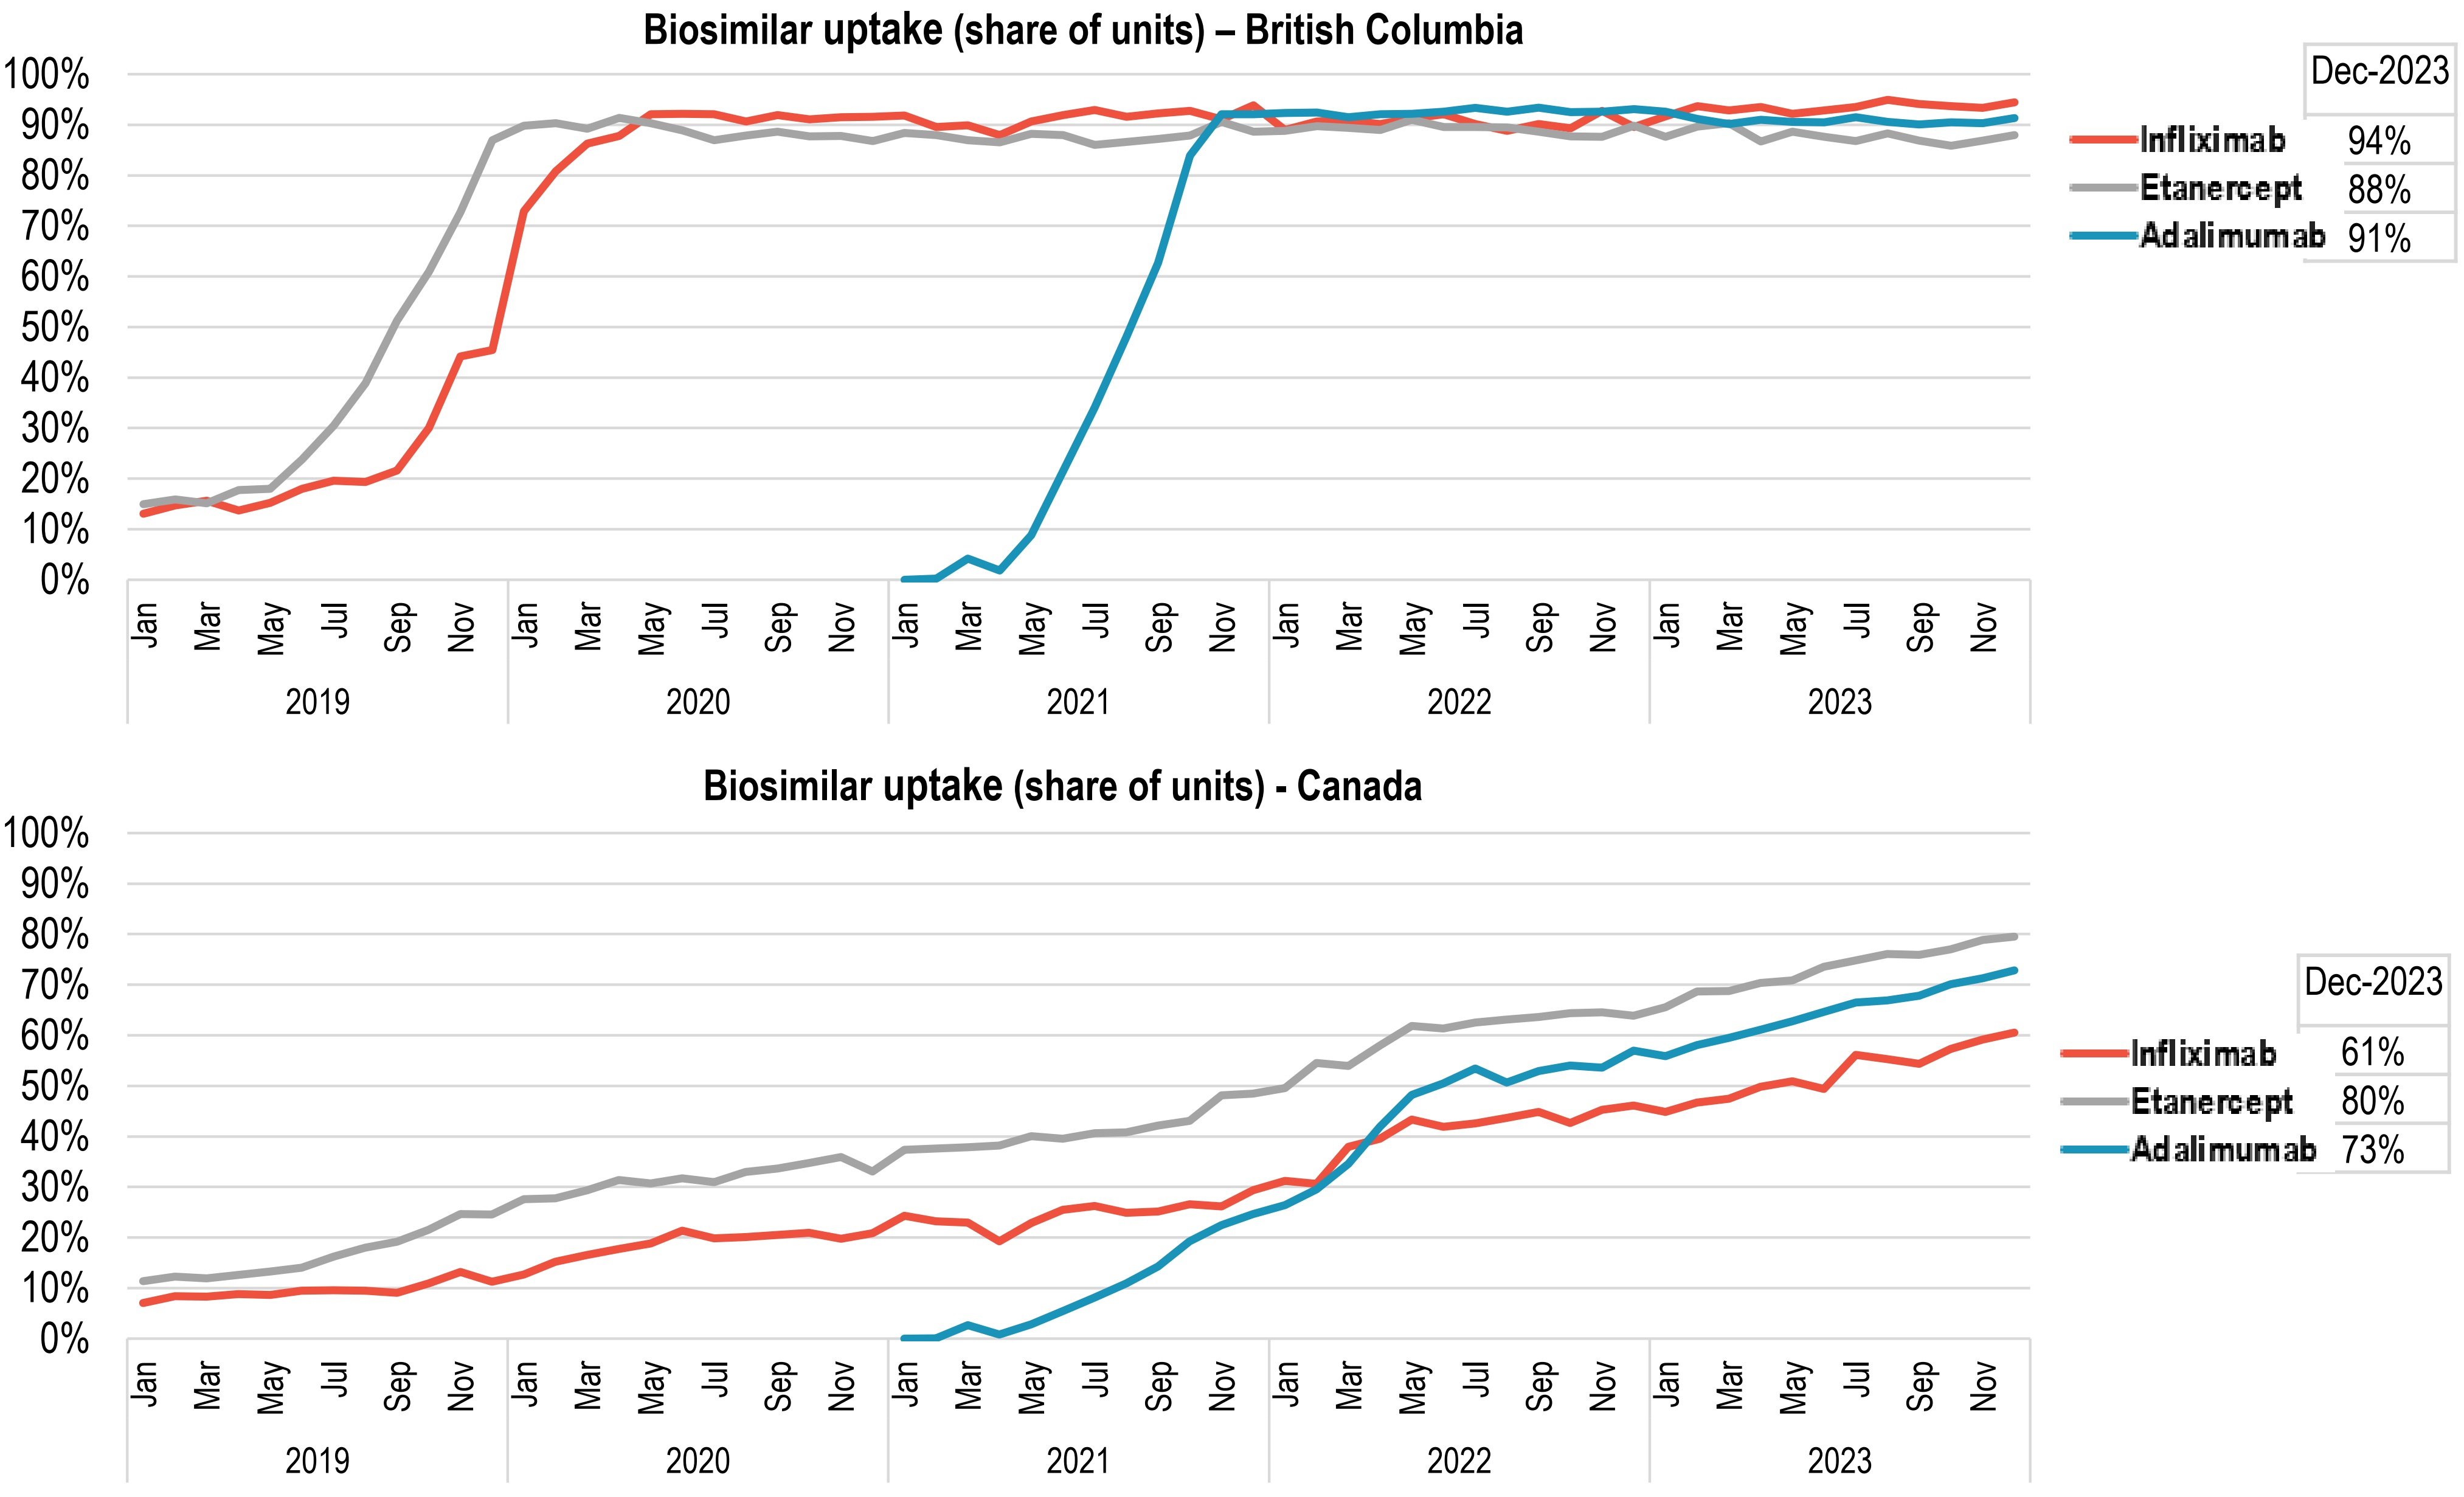
Figure - Text version
| Canada | British Columbia | |||||||||
|---|---|---|---|---|---|---|---|---|---|---|
| Biosimilar uptake by year and month | Infliximab | Etanercept | Adalimumab | Biosimilar uptake by year and month | Infliximab | Etanercept | Adalimumab | |||
2019 |
Jan |
7% |
11% |
- |
- |
2019 |
Jan |
13% |
15% |
- |
Feb |
8% |
12% |
- |
- |
Feb |
15% |
16% |
- |
||
Mar |
8% |
12% |
- |
- |
Mar |
16% |
15% |
- |
||
Apr |
9% |
13% |
- |
- |
Apr |
14% |
18% |
- |
||
May |
9% |
13% |
- |
- |
May |
15% |
18% |
- |
||
Jun |
9% |
14% |
- |
- |
Jun |
18% |
24% |
- |
||
Jul |
10% |
16% |
- |
- |
Jul |
20% |
30% |
- |
||
Aug |
9% |
18% |
- |
- |
Aug |
19% |
39% |
- |
||
Sep |
9% |
19% |
- |
- |
Sep |
22% |
51% |
- |
||
Oct |
11% |
22% |
- |
- |
Oct |
30% |
61% |
- |
||
Nov |
13% |
25% |
- |
- |
Nov |
44% |
73% |
- |
||
Dec |
11% |
25% |
- |
- |
Dec |
45% |
87% |
- |
||
2020 |
Jan |
13% |
28% |
- |
- |
2020 |
Jan |
73% |
90% |
- |
Feb |
15% |
28% |
- |
- |
Feb |
81% |
90% |
- |
||
Mar |
17% |
29% |
- |
- |
Mar |
86% |
89% |
- |
||
Apr |
18% |
31% |
- |
- |
Apr |
88% |
91% |
- |
||
May |
19% |
31% |
- |
- |
May |
92% |
90% |
- |
||
Jun |
21% |
32% |
- |
- |
Jun |
92% |
89% |
- |
||
Jul |
20% |
31% |
- |
- |
Jul |
92% |
87% |
- |
||
Aug |
20% |
33% |
- |
- |
Aug |
91% |
88% |
- |
||
Sep |
21% |
34% |
- |
- |
Sep |
92% |
89% |
- |
||
Oct |
21% |
35% |
- |
- |
Oct |
91% |
88% |
- |
||
Nov |
20% |
36% |
- |
- |
Nov |
91% |
88% |
- |
||
Dec |
21% |
33% |
- |
- |
Dec |
92% |
87% |
- |
||
2021 |
Jan |
24% |
37% |
0% |
- |
2021 |
Jan |
92% |
88% |
0% |
Feb |
23% |
38% |
0.1% |
- |
Feb |
90% |
88% |
0.2% |
||
Mar |
23% |
38% |
3% |
- |
Mar |
90% |
87% |
4% |
||
Apr |
19% |
38% |
1% |
- |
Apr |
88% |
87% |
2% |
||
May |
23% |
40% |
3% |
- |
May |
91% |
88% |
9% |
||
Jun |
25% |
40% |
5% |
- |
Jun |
92% |
88% |
22% |
||
Jul |
26% |
41% |
8% |
- |
Jul |
93% |
86% |
34% |
||
Aug |
25% |
41% |
11% |
- |
Aug |
92% |
87% |
48% |
||
Sep |
25% |
42% |
14% |
- |
Sep |
92% |
87% |
63% |
||
Oct |
27% |
43% |
19% |
- |
Oct |
93% |
88% |
84% |
||
Nov |
26% |
48% |
22% |
- |
Nov |
91% |
91% |
92% |
||
Dec |
29% |
48% |
25% |
- |
Dec |
94% |
89% |
92% |
||
2022 |
Jan |
31% |
50% |
26% |
- |
2022 |
Jan |
89% |
89% |
92% |
Feb |
31% |
54% |
30% |
- |
Feb |
91% |
90% |
92% |
||
Mar |
38% |
54% |
35% |
- |
Mar |
91% |
89% |
91% |
||
Apr |
40% |
58% |
42% |
- |
Apr |
90% |
89% |
92% |
||
May |
43% |
62% |
48% |
- |
May |
91% |
91% |
92% |
||
Jun |
42% |
61% |
51% |
- |
Jun |
92% |
90% |
93% |
||
Jul |
43% |
63% |
53% |
- |
Jul |
90% |
90% |
93% |
||
Aug |
44% |
63% |
51% |
- |
Aug |
89% |
89% |
93% |
||
Sep |
45% |
64% |
53% |
- |
Sep |
90% |
89% |
93% |
||
Oct |
43% |
64% |
54% |
- |
Oct |
89% |
88% |
93% |
||
Nov |
45% |
65% |
54% |
- |
Nov |
93% |
88% |
93% |
||
Dec |
46% |
64% |
57% |
- |
Dec |
90% |
90% |
93% |
||
2023 |
Jan |
45% |
66% |
56% |
- |
2023 |
Jan |
92% |
88% |
93% |
Feb |
47% |
69% |
58% |
- |
Feb |
94% |
90% |
91% |
||
Mar |
47% |
69% |
60% |
- |
Mar |
93% |
90% |
90% |
||
Apr |
50% |
70% |
61% |
- |
Apr |
94% |
87% |
91% |
||
May |
51% |
71% |
63% |
- |
May |
92% |
89% |
91% |
||
Jun |
49% |
74% |
65% |
- |
Jun |
93% |
88% |
91% |
||
Jul |
56% |
75% |
66% |
- |
Jul |
94% |
87% |
91% |
||
Aug |
55% |
76% |
67% |
- |
Aug |
95% |
88% |
91% |
||
Sep |
54% |
76% |
68% |
- |
Sep |
94% |
87% |
90% |
||
Oct |
57% |
77% |
70% |
- |
Oct |
94% |
86% |
90% |
||
Nov |
59% |
79% |
71% |
- |
Nov |
93% |
87% |
90% |
||
Dec |
61% |
80% |
73% |
- |
Dec |
94% |
88% |
91% |
||
Data source: Canadian Drugstore and Hospital Purchases Audit (CDH) databases, IQVIA. All rights reserved
- Since May 2019, Canadian payers have launched switching initiatives to increase uptake, led by British Columbia (BC).
- Biosimilars for three widely used anti-TNF-α drugs (adalimumab, infliximab, and etanercept) reached ~90% market share in BC between mid-2020 and late 2021.
- National uptake for these medicines gradually rose to 60– 80% of units sold by December 2023.
Growing biosimilar savings in Canada, with more to gain
Realized and potential savings from biosimilar use in Canada, 2020 to 2023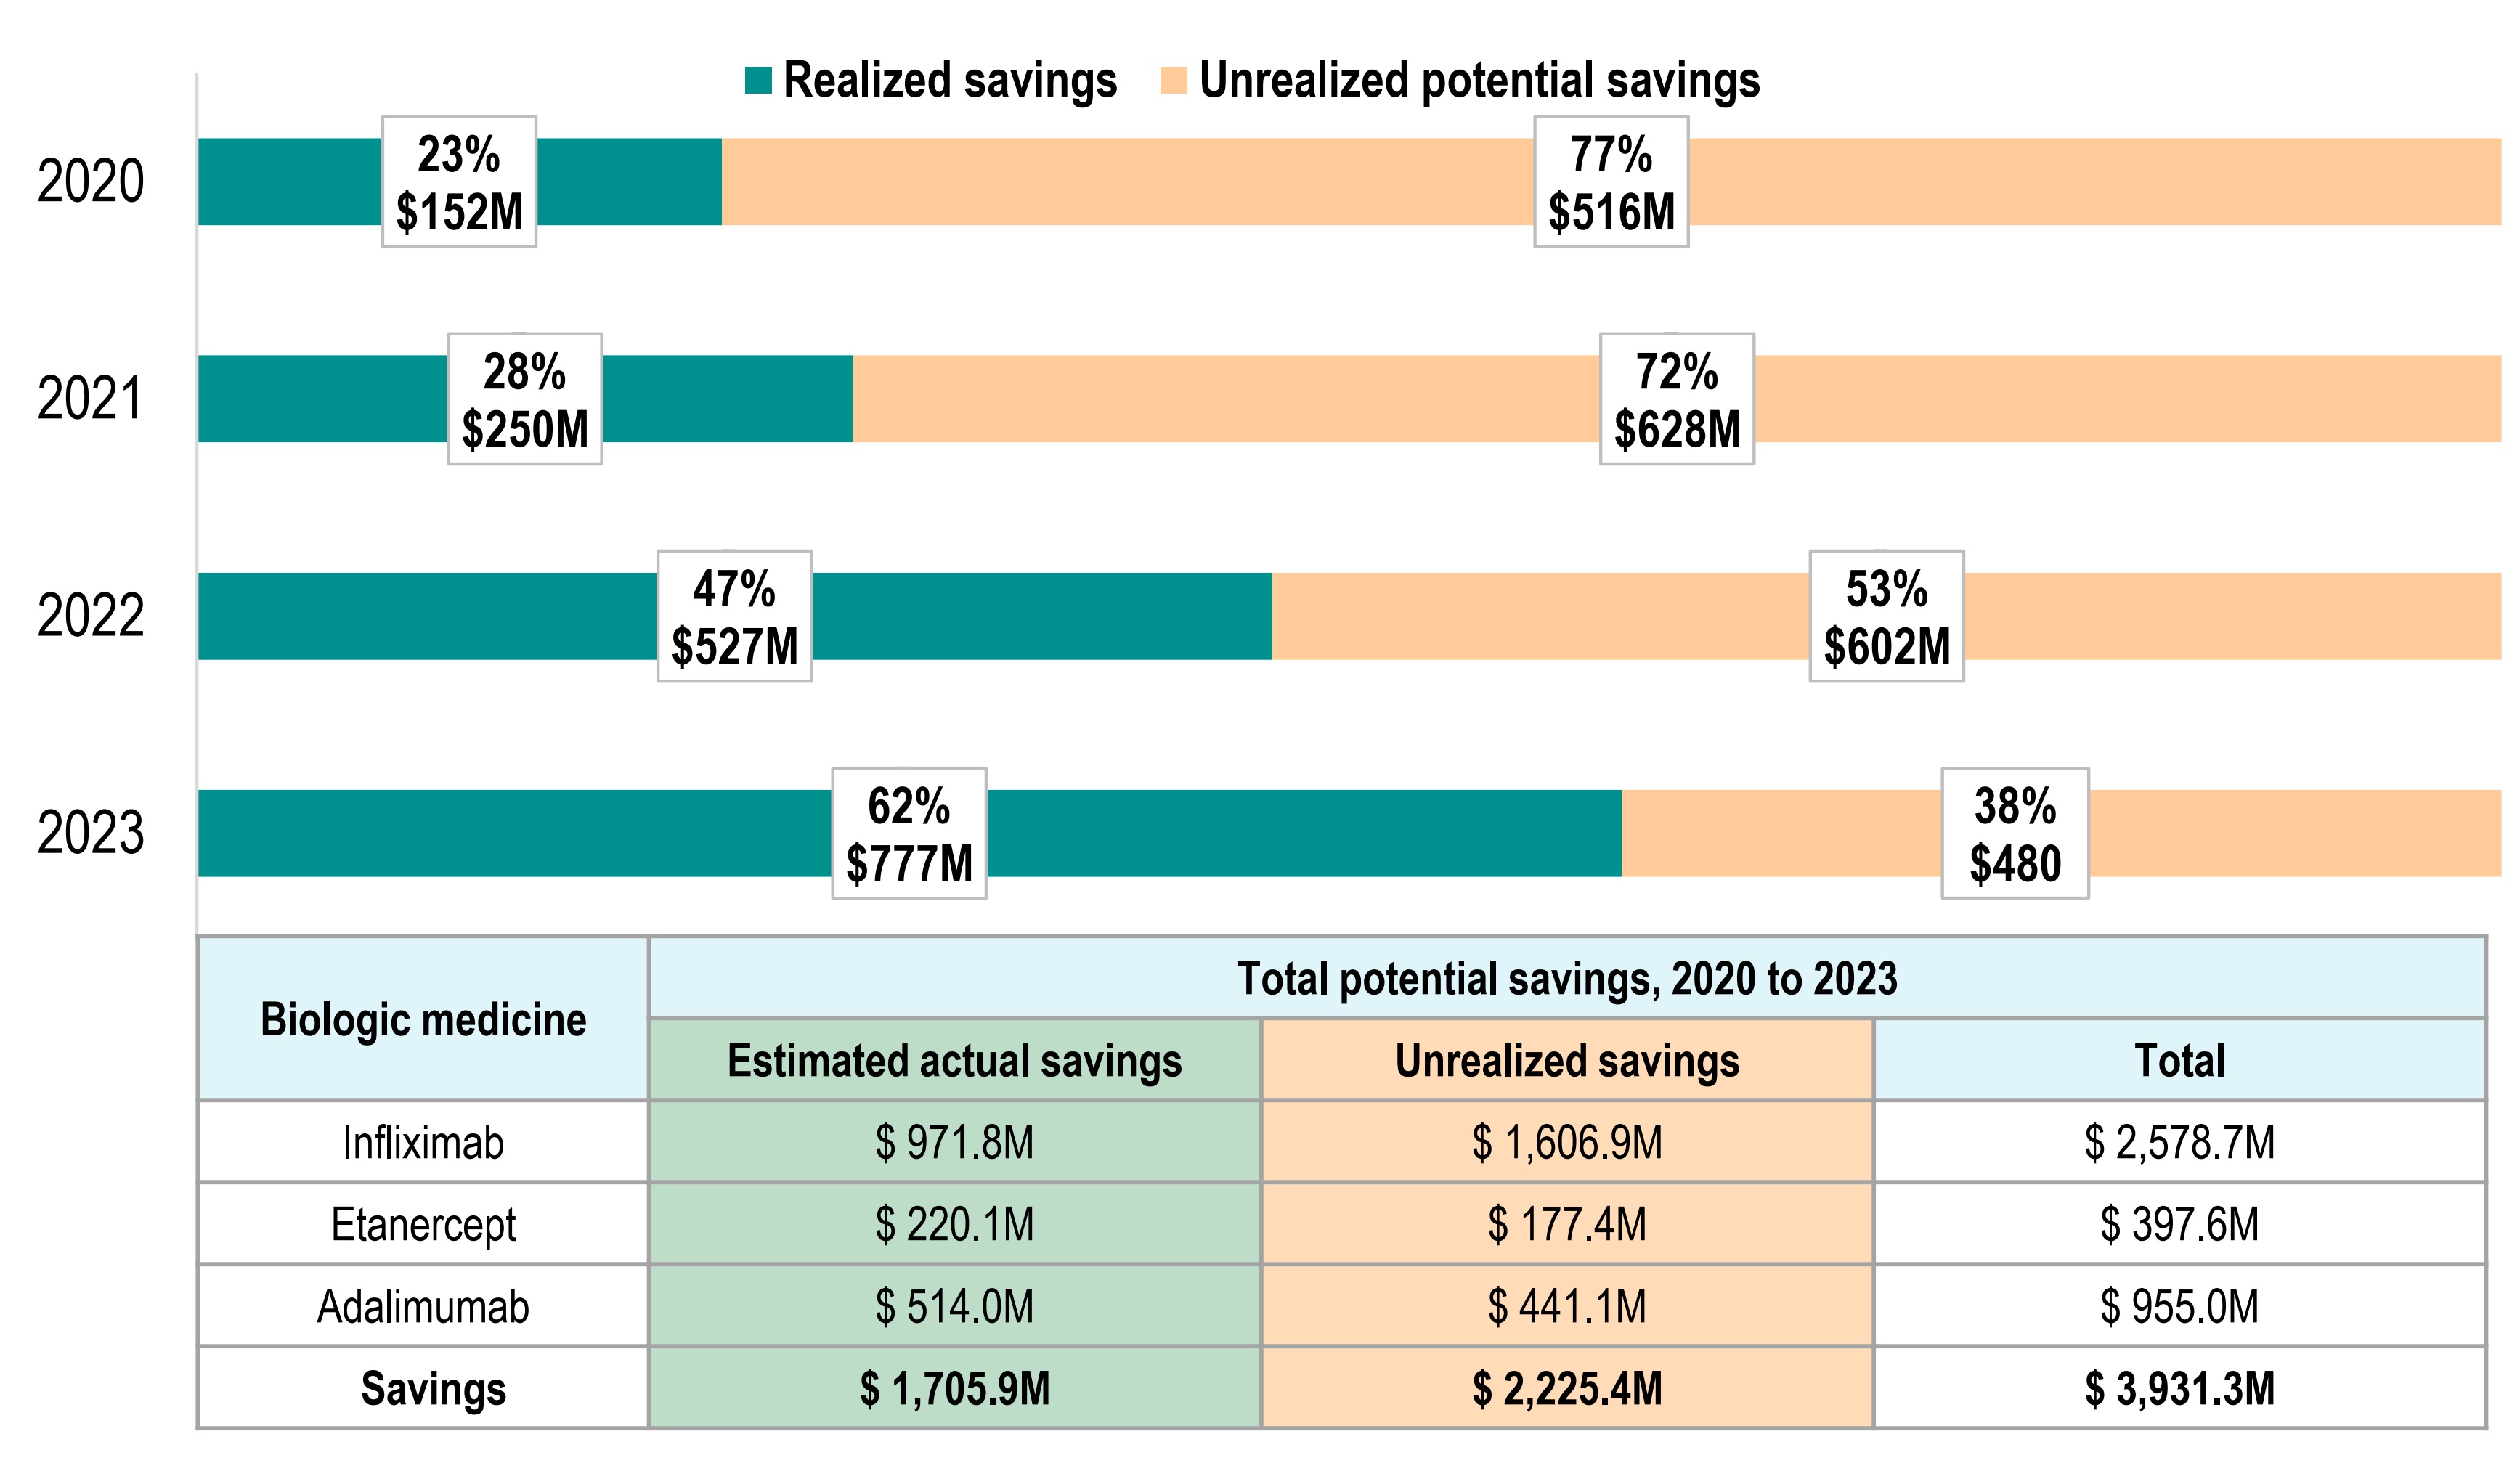
Figure - Text version
| Year | Realized savings from biosimilar use in Canada, in millions of dollars | Unrealized potential savings from biosimilar use in Canada, in millions of dollars | Potential savings from biosimilar use in Canada | Realized share of savings from biosimilar use in Canada | Unrealized potential share savings from biosimilar use in Canada as a share |
|---|---|---|---|---|---|
2020 |
$152 |
$516 |
$669 |
23% |
77% |
2021 |
$250 |
$628 |
$878 |
28% |
72% |
2022 |
$527 |
$602 |
$1,128 |
47% |
53% |
2023 |
$777 |
$480 |
$1,257 |
62% |
38% |
| Biologic medicine | Total potential savings, 2020 to 2023 | ||
|---|---|---|---|
| Estimated actual savings | Unrealized savings | Total | |
Infliximab |
$ 971.8M |
$ 1,606.9M |
$ 2,578.7M |
Etanercept |
$ 220.1M |
$ 177.4M |
$ 397.6M |
Adalimumab |
$ 514.0M |
$ 441.1M |
$ 955.0M |
Savings |
$ 1,705.9M |
$ 2,225.4M |
$ 3,931.3M |
Data source: Canadian Drugstore and Hospital Purchases Audit (CDH) databases, IQVIA. All rights reserved.
- Biosimilar use for three high-selling biologics — infliximab, adalimumab, and etanercept, generated $1.7B in savings between 2020 and 2023.
- If uptake across Canada had matched the higher uptake levels in British Columbia, an additional $2.2B in savings could have been realized.
- Biosimilar uptake has increased over time, with the realized share of potential savings growing from 23% in 2020 to 62% in 2023.
Conclusions
- Biologics are a high-growth market in Canada, with sales tripling over the last decade.
- Biosimilar availability and market share in Canada have kept pace with Europe.
- Biosimilars uptake for high-selling products aligns with the OECD trends.
- Biosimilar switching is led by provinces and payers, resulting in varied uptake across jurisdictions.
- With nearly 40% in savings still unrealized, broader adoption of switching initiatives could further reduce drug spending.