
Budget Impact Analysis Guidelines
Guidelines for Conducting Pharmaceutical Budget Impact Analyses for Submission to Public Drug Plans in Canada
June 2020
ISBN 978-0-660-34569-7
Cat. no.: H82-49/2020E-PDF
Table of Contents
- 1.0 Executive Summary
- 2.0 Purpose
- 3.0 Background
- 4.0 Methodology: Revisions to the 2007 BIA Guidelines
- 5.0 Introduction
- 6.0 Recommendations for the Analytic Framework
- 7.0 Input and Data Source Recommendations
- 8.0 Reporting Format Recommendations
- 9.0 Interactive BIA Model
- 10.0 List of Terms and Abbreviations
- 11.0 Reference List
- Appendix A: Summary of Reviewed BIA Guidelines
- Appendix B: Summary of Changes to the PMPRB BIA Guidelines
- Appendix C: BIA Completion Checklist
Acknowledgements
The update to the 2007 Guidelines for Conducting Pharmaceutical Budget Impact Analyses for Submission to Public Drug Plans in Canada was undertaken by the PMPRB under the oversight and guidance of the National Prescription Drug Utilization Information System (NPDUIS) Advisory Committee with expert advice from EVERSANATM (formerly Cornerstone Research Group Inc.).
The PMPRB gratefully acknowledges the following contributors for their insight and expertise in the development and preparation of this document.
The PMPRB staff responsible for managing this project — providing guidance to external consultants, collaborating with key stakeholders, and updating the analytical content and accompanying text:
Project lead and analysis
Nevzeta Bosnic, Senior Economic Analyst, NPDUIS
Yvonne Zhang, Senior Economic Analyst, NPDUIS
Dr. Naghmeh Foroutan, Research/Data Management, Policy Development
Oversight
Tanya Potashnik, Director, Policy and Economic Analysis Branch
Elena Lungu, Manager, Policy Development
Jeffrey Menzies, Manager, NPDUIS
Matthew Kellison, Director, Regulatory Affairs and Outreach Branch
Publishing and Translation
Carol McKinley, Publications Advisor, NPDUIS
Sarah Parker, Publishing Officer, NPDUIS
Shirin Paynter, Translation, PMPRB
Other changes
EVERSANATM for their contribution to the development of the Guidelines and model template:
EVERSANATM
Dr. Chris Cameron, Senior Vice President
Dr. Heather Cameron, Senior Director
Diana Tran, Director
NPDUIS Advisory Committee participants and colleagues for their insightful feedback, review, and comments on the draft Guidelines:
British Columbia
Christine Voggenreiter (member), Director, Economic Analysis, Pharmaceutical Services Division, British Columbia Ministry of Health
Beverly Wan, Director, Pharmaceutical Analytics, Integrated Analytics, Community & Cross Sector Branch, Health Sector Information, Analysis & Reporting Division, British Columbia Ministry of Health
Alberta
Sandra Rees (member), Pharmaceutical Policy Consultant, Pharmaceuticals and Health Benefits,
Alberta Health
Jocelyn Milburn, Director, Professional and Industry Relations, Pharmaceuticals and Supplementary Health Benefits, Alberta Health
Saskatchewan
Erin Jennings (member), Manager, Strategic Financial Planning and Analysis, Drug Plan and Extended Benefits Branch, Saskatchewan Ministry of Health
Rachel Cheruvallath, Director, Pharmaceutical Policy and Appropriateness, Drug Plan and Extended Benefits Branch, Saskatchewan Ministry of Health
Mehdee Araee, Senior Health Economist, Pharmaceutical Policy and Appropriateness, Drug Plan and Extended Benefits Branch, Saskatchewan Ministry of Health
Manitoba
Patricia Caetano (member), Executive Director, Provincial Drug Programs, Manitoba Health
Ontario
Angie Wong (member), Director, Drug Programs Policy and Strategy Branch, Drugs and Devices Division, Ontario Public Drug Programs
Vivian Leong, Senior Manager, Drug Programs Policy and Strategy Branch, Integration and Policy Unit, Drugs and Devices Division, Ontario Public Drug Programs
Vivian Ng, Team Lead, Drug Programs Policy and Strategy Branch, Integration and Policy Unit, Drugs and Devices Division, Ontario Public Drug Programs
Mofakhar Hussain, Senior Economist, Drug Programs Policy and Strategy Branch, Integration and Policy Unit, Drugs and Devices Division, Ontario Public Drug Programs
New Brunswick
Kevin Pothier (member), Director, Business Management, Pharmaceutical Services, New Brunswick Department of Health
Nova Scotia
Holly Chisholm (member), Senior Economist,
Nova Scotia Department of Health
Lara Grant, Manager, Insured Pharmaceutical Programs
Kathleen Coleman, Director, Formulary and Clinical Practice
Prince Edward Island
Bonnie Corish (member), Pharmacist Consultant, Pharmacare Program, Health Prince Edward Island
Newfoundland and Labrador
Patricia Clark (member), Manager, Program Policy and Professional Services, Newfoundland and Labrador Department of Health and Community Services
Yukon
Jodi Giesbrecht (member), Acting Manager, Extended Benefits and Pharmaceuticals Management Strategies, Yukon Department of Health and Social Services
NIHB
Susan Pierce (member), Manager, Pharmacy Group,
Benefit Management Division, Non-Insured Health Benefits Program
CADTH
Tarry Ahuja (observer), Manager, Policy & Program Development, Canadian Agency for Drugs and Technologies in Health
Alexander Haines, Manager, Health Economics, Canadian Agency for Drugs & Technologies in Health
Bernice Tsoi, Manager, Health Economics, Canadian Agency for Drugs & Technologies in Health
Justin Reimer, Health Economist, Canadian Agency for Drugs & Technologies in Health
Karen Lee, Director, Health Economics, Canadian Agency for Drugs and Technologies in Health
CIHI
Jordan Hunt (observer), Manager, Pharmaceuticals, Canadian Institute for Health Information
Quebec
Dominic Bélanger (observer), Acting Director, Direction des affaires pharmaceutiques et du médicament, Ministère de la Santé et des Services sociaux du Québec
Health Canada
Nelson Millar (observer), Senior Policy Analyst, Office of Pharmaceutical Management Strategies, Health Canada
pCPA
Daniel Sperber (observer), Senior Economist, pan-Canadian Pharmaceutical Alliance Office
In addition, the PMPRB wishes to acknowledge the contribution of the Institut national d’excellence en santé et en services sociaux (INESSS) members Patrick Dufort, Marie-Eve Brouard, and Thomas Mortier, for their discussion and review of the revised Guidelines.
Disclaimer
These guidelines are provided for information only. Any reliance upon, interpretation of, and/or use of these best practices is solely and exclusively at the discretion of the user. Except as may be stated in a written agreement, the Patented Medicine Prices Review Board does not make any representations or warranties, express or implied, with respect to the information provided within, including any representations or warranties as to accuracy, timeliness, completeness or fitness for a particular purpose. The Patented Medicine Prices Review Board will not be responsible for any action or failure to act in reliance upon information in these guidelines.
NPDUIS operates independently of the regulatory activities of the Board of the PMPRB. The research priorities, data, statements, and opinions expressed or reflected in NPDUIS reports do not represent the position of the PMPRB with respect to any regulatory matter. NPDUIS reports do not contain information that is confidential or privileged under sections 87 and 88 of the Patent Act, and the mention of a medicine in a NPDUIS report is not and should not be understood as an admission or denial that the medicine is subject to filings under sections 80, 81, or 82 of the Patent Act or that its price is or is not excessive under section 85 of the Patent Act.
Conflict of Interest
EVERSANATM (formerly Cornerstone Research Group Inc.) provided information and advice to the PMPRB in the development of the Guidelines and the model template. EVERSANATM is a global contract health economics research and consulting organization based in Canada. Part of EVERSANATM’s business involves the development of BIAs on behalf of its clients for eventual submission to Canada’s federal, provincial, and territorial drug plans.
Contact Information
Patented Medicine Prices Review Board
Standard Life Centre
Box L40, 333 Laurier Avenue West
Suite 1400
Ottawa, ON K1P 1C1
Tel.: 1-877-861-2350
TTY 613-288-9654
Email: PMPRB.Information-Renseignements.CEPMB@pmprb-cepmb.gc.ca
Budget Impact Analysis Guidelines: Version Summary
See Appendix B for a detailed description of the updates to the 2007 BIA Guidelines.
| Publication date | Notes / Updates |
|---|---|
May 2007 |
First edition of the Budget Impact Analysis (BIA) Guidelines for submission to drug plans in Canada was developed as a primary resource for the preparation of pharmaceutical BIAs. |
June 2020 |
The second edition of the BIA Guidelines builds on the first, with an enhanced methodology designed to increase the transparency and consistency of BIAs submitted to Canadian public drug plans. |
1.0 Executive Summary
1.1 Introduction
Budget impact analyses (BIAs) are used to predict and understand the potential financial impact of introducing a new pharmaceutical into a drug reimbursement system that has finite financial resources [Reference 1]. While BIAs focus on the financial impact of the new drug, the value to the overall healthcare system is examined through other economic analyses, such as cost-effectiveness analyses (CEAs).
In Canada, BIAs are used to make informed reimbursement decisions. These Guidelines provide a standardized approach and detailed recommendations for developing a BIA for submission to the Canadian Agency for Drugs and Technologies in Health (CADTH) or to one of the participating federal/provincial/territorial (FPT) drug plans.
The current Guidelines supersede those first published by the Patented Medicine Prices Review Board (PMPRB) in May 2007. While the 2007 Guidelines were considered to be a primary resource for the preparation of pharmaceutical BIAs in Canada, they no longer reflect current best practices. This update was necessary to keep current with developments in the BIA methods required by Canadian public drug plans, CADTH, and international BIA guidelines.
1.2 BIA Recommendations
Recommendations for the Analytic Framework
Perspective
The BIA should be performed from a drug plan perspective and focus on drug-related costs that have a direct impact on the plan budget. Non-drug-related costs are normally excluded from the base-case analysis; however, they may be acknowledged in the BIA or presented in a scenario analysis.
Time Horizon
When forecasting the budget impact of a new treatment, four years of data is typically presented: a one-year baseline period and a three-year forecast period. However, there are occasions when a longer forecast period is preferable, and some flexibility in the time horizon is recommended. All forecasted data and results should be for 12-month periods, and the model should allow flexibility for the cycles selected.
Population
When establishing the population of interest, the target population should be determined based on the manufacturer’s drug label/monograph and plan eligibility/membership, as well as any criteria-based restrictions to drug access. The growth of the market over time should be based on the forecasted growth of the target population, with appropriate adjustments if drug availability is expected to affect the size of the market. Off-label usage of the new drug should not be included in the base-case analysis presented in the BIA, but should be assessed in a scenario analysis.
Scenarios to be Compared
When evaluating the budget impact of granting formulary listing to a new drug, two scenarios should be compared: the Reference Scenario, which is projected based on the existing environment; and the New Drug Scenario, which assumes that the new drug has been added to the formulary of a particular drug plan. All assumptions made to develop each scenario should be explicitly stated and supporting references provided.
Drug Costs
When calculating the cost to a drug plan, BIAs should include the expected reimbursement price of the new drug and all of its relevant drug comparators, as well as all relevant concomitant medicines reimbursed by the drug plan. Drug costs should consider all markups, dispensing fees, and patient co-payments as per the drug plan requirements. Premiums and deductibles should be excluded, unless required by a particular drug plan.
Discounting and Inflation
Results should be neither discounted nor inflated. The budget impact model may allow changes to these rates if desired.
Model Design
To be transparent and accessible, the budget impact model and the supporting report should be designed to meet the needs of the end users and to help them understand how the model works. The simplest design that generates accurate, repeatable results should be selected, and the model should be built using readily available software, such as Microsoft Excel. Choices and assumptions made during the development of the model should be fully explained.
Characterizing Uncertainty
Deterministic sensitivity and scenario analyses should be provided with the submitted BIA to inform decision makers of the sensitivity of the model to specific assumptions. Probabilistic sensitivity analyses may be considered but are not required.
Validation
The validity of the model should be assessed and documented.
Input and Data Source Recommendations
Estimation of the Current Size of the Market
When estimating the size of the market, analysts may develop their models based on either population (epidemiological) data or claims data, or in some instances, both. Population data is best used for a novel drug entering a new market, while claims data is usually used for a novel drug entering a more mature market. For transparency and completeness, claims data-based models should provide an estimate of the number of active beneficiaries based on the number of claims for both the Reference and New Drug scenarios.
Selection of Relevant Comparators
The comparators used in the budget impact model should reflect drug-based treatment strategies used to treat the same indication(s) as the new drug. For transparency, the costs for concomitant medicines should be listed separately in the model. Non-drug alternatives are excluded from the base-case analysis but should be mentioned in the report and can be included in the scenario analysis if they are expected to have a significant impact. The relevant treatment strategies identified should align with those used in the economic evaluation submitted with the BIA, if possible.
Forecasting of the Market Under the Reference Scenario
Analysts should use published forecasts to anticipate changes in the market. The forecasts should take expected changes to the market over the time horizon into consideration using available data. These changes include, but are not limited to, anticipated market growth and market distribution of the treatment strategies expected to be available.
Forecasting of the Market Under the New Drug Scenario
To forecast changes under the New Drug Scenario, analysts should use verifiable market intelligence on how the reimbursement of the new drug will affect the market. Markets where the new drug is currently reimbursed should be consulted to inform the forecasting process. Analysts should estimate the anticipated growth of the market, the expected market share of the new drug, the effect of any restrictions to access to the new drug on the market size or market share, and how the new drug will affect the market share of all relevant treatment strategies. These factors should be considered for the entire time horizon and data supporting these estimates should be provided and explained.
Estimating Drug Costs
To estimate the cost of each treatment strategy, analysts should obtain reimbursement prices from the best available source(s), such as the drug plan formulary, public drug plan databases, and wholesaler pricing information. Additionally, analysts should include markups, dispensing fees, and patient co-payments according to the drug plan’s specifications. When comparing the cost per day of different treatment strategies, it is important to consider therapeutic equivalencies (i.e., the frequency of drug administration) and drug wastage (i.e., the number of drug units dispensed per prescription, rather than consumed). The BIA should address the impact of compliance and persistence with therapy on the cost of treatments, as required, based on the best available evidence. Analysts should consider whether any additional assumptions used in the accompanying economic evaluation are applicable for estimating drug costs.
Reporting Format Recommendations
BIAs submitted to the drug plans should contain the following sections: introduction; technology; study design and methods; results; limitations and assumptions; sensitivity and scenario analyses; conclusions; and references and appendices. The information presented should include enough detail to allow a third party to replicate the submitted results. The inclusion of supporting tables and figures is recommended to enhance the clarity of the report.
The BIA Completion Checklist provided in Appendix C should be used to verify that the BIA was completed appropriately.
Interactive Budget Impact Model
The BIA report should be accompanied by the interactive budget impact model that was used to produce the results. The BIA model should be flexible enough to allow reviewers to easily change various parameters in order to address provincial differences in drug price regulations (e.g., drug prices, markups, professional fees, and co-payments) or to test the impact of potential price rebates.
2.0 Purpose
These Guidelines provide a standardized approach and detailed recommendations for developing a budget impact analysis (BIA) for submission to the Canadian Agency for Drugs and Technologies in Health (CADTH) or to one of the participating federal/provincial/territorial (FPT) drug plans.
They are specifically designed to assist those who develop, submit, and evaluate BIAs in determining the financial impact and affordability of listing a new drug for reimbursement by a Canadian public drug plan.
All jurisdictions requiring a BIA submission to CADTH have contributed to the development of this document:
- British Columbia
- Alberta
- Saskatchewan
- Manitoba
- Ontario
- New Brunswick
- Nova Scotia
- Prince Edward Island
- Newfoundland and Labrador
- Non-Insured Health Benefits Program (NIHB)
The BIA Guidelines and model may also be of use to other public plans (i.e., QuebecFootnote i, Yukon, Northwest Territories, Nunavut, Correctional Service Canada, the Royal Canadian Mounted Police, Veterans Affairs Canada, and the Department of National Defence), as well as Canadian private payers and international agencies.
This document constitutes a best practice guide for the development of BIAs in Canada and is not part of the regulatory filing requirements of the PMPRB. The PMPRB and CADTH should be consulted directly for information on mandatory filing and submission requirements.
3.0 Background
Once Health Canada has approved a drug for use in Canada, each province must decide whether it will be eligible for reimbursement under their public drug program(s).
To initiate the reimbursement decision-making process for a new drug, a drug with a new indication, or a new combination product, the manufacturer must first file a submission to CADTH. CADTH conducts a thorough and objective evaluation of the clinical, economic, and patient evidence on the drug, and uses this evaluation to provide reimbursement recommendations and advice to the participating public drug plans. BIAs are included in the submission, but CADTH only conducts a review and appraisal of pan-Canadian BIAs as part of the pan-Canadian Oncology Drug Review (pCODR) process for oncology drugs and Common Drug Review (CDR) process for non-oncology drugs.
CADTH serves as the secretariat for receiving submission information for the participating public drug plans. If a drug has already obtained a formulary listing from a given public drug plan and the manufacturer wants to expand the reimbursement criteria, the BIA is sent directly to the appropriate drug plan.
4.0 Methodology: Revisions to the 2007 BIA Guidelines
The current Guidelines supersede those first published by the Patented Medicine Prices Review Board (PMPRB) in May 2007, which were considered to be a primary resource for the preparation of pharmaceutical BIAs in Canada. This update was necessary to support the ongoing work of the NPDUIS Advisory Committee participants and to keep current with developments in the BIA methods required by Canadian public drug plans, CADTH, and international BIA guidelines.
In January 2018, EVERSANATM (formerly Cornerstone Research Group Inc.) was commissioned by the PMPRB to advise and assist in the development of an enhanced methodology and to review the BIA model template. First, a literature review of BIA guidelines was undertaken [Reference 2], including an examination of international standards of practice for BIAs from several countries, such as Canada [Reference 1], Australia [Reference 3], England and Wales [Reference 4], Belgium [Reference 5], Ireland [Reference 6], France [Reference 7], Poland [Reference 8], and the Netherlands [Reference 9], as well as guidelines from the International Society for Pharmacoeconomics and Outcomes (ISPOR) [Reference 10]. Provincial drug plan templates for Alberta [Reference 11], Ontario [Reference 12], and Manitoba [Reference 13] were also considered, in addition to the relevant guidance for Quebec [Reference 14] and CADTH (pCODR) [Reference 15].
A draft with proposed updates to the Guidelines was then circulated to NPDUIS Advisory Committee members and observers. Their feedback, in conjunction with a more targeted literature search, was used to create a structured questionnaire to gather additional information.
The questionnaire was distributed to the Advisory Committee participants and/or their colleagues between April and September 2019 to gather feedback and recommendations on the changes. The topics of discussion included: the time horizon; drug cost components; comparator selection and multiple indications; and any existing gaps in the Guidelines. All of the feedback received was considered when revising the Guidelines. Additionally, updates to the CADTH documents Procedures for the CADTH Common Drug Review and Interim Plasma Protein Product Review and Procedures for the CADTH pan-Canadian Oncology Drug Review were taken into account when making the revisons.
The resulting enhanced methodology, as well as the increased transparency and consistency afforded by these revised Guidelines, provide a comprehensive reference for conducting BIAs in Canada.
Updates to the 2007 BIA Guidelines were based on a thorough review of national and international standards and best practices (see Appendix A), as well as direct feedback from the participating Canadian public drug plans.
For an itemized list of revisions to the 2007 Guidelines, see Appendix B.
5.0 Introduction
Budget impact analyses (BIAs) are used to predict and understand the potential financial impact of introducing a new healthcare intervention (e.g., a new drug) into a healthcare system with finite financial resources [Reference 10]. One of the key questions that can be answered is whether a new intervention is affordable to the system of interest [Reference 1].
In Canada, BIAs are used to make informed reimbursement decisions. At their essence, these analyses estimate the financial impact of reimbursing a new drug over a specified period of time by comparing two scenarios: a Reference Scenario, which is based on the existing market behavior, and a New Drug Scenario, which accounts for the reimbursement of the new drug. Both scenarios examine various factors including the market size, the number and market share of any comparators, and the price of the drug and its comparators.
While BIAs focus on the financial impact of the new drug, the value to the overall healthcare system is examined through economic analyses, such as cost-effectiveness analyses (CEAs). A CEA measures the value of a new drug in terms of monetary units per additional unit of health benefit (e.g., dollars per symptom-free day, dollars per quality-adjusted life-year (QALY) gained). Together BIAs and economic analyses like CEAs are used to make decisions regarding the reimbursement of a new drug at a given price for a specific population. Table 5.0 compares the characteristics of these two analyses in more detail.
Table 5.0: Comparison of budget impact analyses (BIAs) and cost-effectiveness analyses (CEAs)
| BIA [Reference 1, Reference 5, Reference 16] | CEA [Reference 17] | |
| Perspective | Payer | Consistent with decision problem; Canadian reference case is that of a publicly funded healthcare payer |
| Population | Eligible population for a specific plan | Consistent with decision problem (e.g., entire or subgroup of target population) |
| Time horizon | Short to medium term | Long enough to capture all relevant differences in future costs and outcomes (e.g., may be up to lifetime) |
| Model output | Impact on drug plan costs | Incremental cost QALY gained; incremental cost per LY gained can also be provided |
| Discounting | No | Yes |
| Sensitivity analysis | Deterministic | Probabilistic |
This document will provide a detailed explanation of essential factors to consider when developing a BIA, information on which data sources to use and how to use them, and an outline of the reporting format.
A BIA model template can be obtained directly from the Patented Medicine Prices Review Board at pmprb.npduis-sniump.cepmb@pmprb-cepmb.gc.ca. Note that this is only a basic model structure, and analysts are expected to construct their own detailed models for submission.
6.0 Recommendations for the Analytic Framework
BIAs are commonly conducted using interactive models developed by the manufacturers. These models allow decision makers to forecast the future impact of decisions made in the present day. Their usefulness and reliability depends on the design of the model, the data used for forecasting purposes, and whether the uncertainty inherent in the model design and data input is demonstrated in a meaningful way. Given these limiting factors, it is important for analysts to develop models built upon a robust analytic framework.
This section provides an overview of the essential elements to consider when developing a BIA: perspective, time horizon, population, scenarios to be compared, drug cost, inflation and discount rates, model design, characteristics of uncertainty, and validation.
More detailed information on data requirements is provided in section 7.0: Input and Data Source Recommendations.
6.1 Perspective
A BIA should be prepared from a drug plan perspective and should focus on drug-related costs that have a direct impact on the plan budget. These costs include reimbursed drug prices, as well as wholesaler markups, pharmacy markups, and dispensing fees, depending on the requirements of the individual plan. In some cases, costs may need to be adjusted to reflect any co-payments made by drug plan beneficiaries.
Other related costs associated with a broader healthcare system perspective, such as medical procedures (e.g., surgeries), emergency room visits, physician visits, diagnostic procedures, hospitalizations, and medical devices, are generally excluded from the BIAs submitted to FPT drug plans; however, they may be acknowledged in the text of the BIA, provided as a complementary analysis, or presented in a scenario analysis. Analysts can consult CADTH’s CDR and pCODR procedures and templates to determine which technologies require a scenario analysis that considers a broader Canadian healthcare payer perspective. In some exceptional cases these costs may be included in the base-case analysis, depending on the requirements of the individual public drug plan.
A drug plan perspective that excludes healthcare system costs is considered to be a relevant approach for Canadian BIAs, as these broader costs have an impact on the overall healthcare budget rather than a direct effect on the drug plan budget itself. These healthcare costs, which are often referred to as cost-offsets as they offset the cost of the new drug, can result in downstream effects that generate significant savings for both drug budgets and the overall healthcare system. Medical cost-offsets are captured in economic evaluations (e.g., CEAs), and thus, drug plan decision makers are encouraged to consider economic evaluations together with BIAs when making formulary decisions. Parameters that are included in both the economic evaluations and BIAs should be aligned as closely as possible if they are to be used in a meaningful way.
Non-healthcare-related costs such as productivity loss, transportation, and caregiver-related costs are not considered in the BIA, as they are not generally relevant to the budget holder. Again, they can be acknowledged in the text of the BIA if they are deemed to have a potentially significant impact.
However, changes to the public plan market dynamics resulting from external factors, such as non-drug treatments or other drug plan coverage (public or private), should be reflected in the BIA forecasts. For example, the effect of non-drug treatments would be seen in the projections of population size.
In summary, when specifying the details of the BIA from a drug plan perspective:
- All drug-related costs that are reimbursed by the drug plan should be included in the analysis
- Other healthcare-related costs should generally be excluded from the BIA, but can be included as a complementary analysis or acknowledged in the text of the report if they could have a significant impact on the budget; in rare cases, they may be included in the base-case analysis, depending on the circumstances and the requirements of the drug plan
- Non-healthcare-related costs should be excluded from the BIA, but can be acknowledged in the report if they could have a significant impact
- Non-drug-related changes in clinical practice and other external factors that could potentially change the market dynamics of the public plan should be represented in the BIA
6.2 Time Horizon
When forecasting the budget impact of a new treatment, four years of data is typically presented: a one-year baseline period and a three-year forecast period. However, there are occasions when a longer forecast period is preferable, and some flexibility in the time horizon is recommended. For example, if a new drug is associated with longer-term costs (savings or expenditures) or if it could take several years to reach a steady state, a longer time horizon should be considered, recognizing that it will introduce greater uncertainty in the results.
The market forecast should be based on multiple years of historical data; typically, the number of historical years should equal the forecast period (e.g., 3 years). Time units used to derive the forecast (month, quarter, etc.) should be explicitly stated.
All forecasted data and results should be reported for full 12-month periods beginning with the proposed date of the formulary listing. For example, if the proposed listing date is April 1, 2021, then the first forecasted time period would be from April 1, 2021, to March 31, 2022. Likewise, the baseline year should be reported for the 12 months preceding the proposed listing date.
BIA models should be designed so that the results can be based on either the contract period (tied to the date of the initial funding decision) or fiscal/calendar year. This is essential, as public sector budgeting may require calculations to be performed both on the basis of contract years (i.e., for rebate invoicing) and fiscal years (for budgeting).
In summary, when reporting data used to forecast the budget impact of a new drug:
- A one-year baseline and a three-year time horizon should be forecast, with the flexibility to include additional years if applicable
- The market forecast should be based on multiple years of historical data
- The forecasted data and results should be reported for 12-month periods, and the model should allow for flexibility in terms of the time cycles selected
6.3 Population
The target population included in the BIA should consist of all drug plan beneficiaries who are expected to be diagnosed and treated for the condition(s) of interest and who are eligible to use the new drug. Eligibility should be based on the population specified by the manufacturer’s drug label/monograph, and any specific conditions restricting drug access.
Because the characteristics of the beneficiaries and the extent of coverage vary widely by jurisdiction, it is important to ensure that the data used for the BIA accurately reflects the population of each individual public drug plan. For example, the Manitoba Pharmacare Program is a universal income-based drug benefit program covering eligible Manitobans, regardless of their disease profile or age. Thus, it is reasonable to assume that the age, gender, and disease prevalence of the beneficiary population will closely mirror that of the general population. Whereas in Ontario, beneficiaries of the Ontario Drug Benefit (ODB) program, which covers seniors aged 65 and over, those on social assistance, youth/children aged 24 and under who do not have private insurance, and other specialized groups, would not be expected to reflect the characteristics of the general population. However, some comparisons could be made among subpopulations, such as the senior population in Ontario and seniors covered by the ODB program.
In some cases, the BIA may be designed so that the new drug is restricted to patients who have failed to respond to other therapies or who meet specific criteria. This should be reflected in the target population estimate. For example, if only those patients who have failed to improve following initial treatment (first-line therapy) should be considered for the newly listed drug, the percentage of the population expected to fail the first-line therapy should be factored into the calculation of the population/market. All restricted access criteria should be explicitly stated in the BIA report.
In general, the model should assume an open population, meaning that patients can be added or removed from the analysis over the time horizon. This is an important consideration when the availability of the new drug is expected to affect the size of the total treated population (e.g., when reduced condition-related mortality results in more patients being treated or a curative treatment results in fewer patients receiving treatment). Mortality and disease progression (e.g., for chemotherapy) are also important factors to consider in modelling a BIA, again reflecting the open nature of the target population. In some cases, when the new drug applies to a select group of patients that is not expected to change over time (e.g., a treatment for a rare generic disease), the use of a closed population may be more suitable for the model.
Market growth estimates should be based on the forecasted growth of the target population, as well as growth due to availability of the new drug, if applicable (e.g., if it affects disease incidence/prevalence or treatment switching). In a claims data-based model, market growth should be based on the forecasted growth in claims and claimants.
As mentioned in section 6.1: Perspective, external factors that may influence the market dynamics of public plans, such as non-drug treatments or other drug plans (public or private), must be reflected in the forecasts. For example, if the use of surgery to correct an illness that was typically treated pharmacologically increased in a given market, the number of people receiving the drug treatment would decrease, resulting in a reduction in the size of the market.
Off-label indications should be included in the sensitivity/scenario analysis rather than the base-case analysis. This recommendation is in line with other international guidelines including the ISPOR BIA Guidelines [Reference 10], which propose that off-label use for all indications be considered as complementary to the base-case analysis mainly due to the lack of safety and efficacy data.
For estimating the target population, either a population-based or claims-based approach, or in some instances both, should be used, depending on the drug plan requirements and data availability. For more specific guidance on data requirements and recommendations for estimating the size of the market, see section 7.1: Estimating the Current Market Size.
In summary, when establishing the population of interest within a BIA:
- The market of interest should be based on the manufacturer’s drug label/monograph, drug plan eligibility/membership, and any specific conditions restricting drug access
- The population should be considered to be open, meaning that patients can be added or removed from the analysis based on whether they meet the inclusion criteria over the time horizon
- Market growth estimates should be based on the forecasted growth of the target population, as well as growth due to availability of the new drug, or in the case of a claims data-based approach, forecasted growth of claimants
- Off-label indications should not be included in the base-case analysis
- To estimate the target population, either population-based or claims data-based approaches, or both, should be used
6.4 Scenarios to be Compared
When evaluating the budget impact of granting formulary listing to a new drug, two scenarios should be compared: the Reference Scenario, which is projected based on the existing environment; and the New Drug Scenario, which assumes that the new drug has been added to the formulary of a particular drug plan.
For decision makers to evaluate the reasonableness of the scenarios, all assumptions should be explicitly stated, supporting references should be provided, and data inputs within the model that affect these assumptions should be intuitive. The best available information should be used to inform the BIA. This may include historical data from other markets, published forecasts, or if necessary, expert opinion.
6.4.1 Reference Scenario
In the Reference Scenario, the composition of the forecasted market is based on the existing competitive landscape, as well as data and supportable assumptions regarding the discontinuation and/or adoption of new therapeutic options.
6.4.2 New Drug Scenario
For the New Drug Scenario, the composition of the forecasted market over the time horizon is based on the existing competitive landscape, as well as data and supportable assumptions related to how the introduction of the new drug will change the market. This includes the discontinuation and/or adoption of other therapeutic options.
Evolving indications should be considered in the BIA report. For example, if a drug is commonly used as second-line therapy for a particular disease category and in the new application it becomes the first-line treatment for a new indication, then it may no longer be covered as a second-line therapy.
In summary, when evaluating the impact of granting formulary listing to a given drug:
- Two scenarios should be compared: a Reference Scenario (projected using the existing environment) and a New Drug Scenario (projected assuming that the new drug is listed on the formulary)
- Data should be obtained from the best available sources, and all assumptions made to develop a given scenario should be explicitly stated and supporting references provided
6.5 Drug Costs
To calculate the impact of a new drug on drug plan costs, the BIA should include the expected reimbursement price (i.e., the list price excluding discounts) of the new drug and all of its comparators, as well as all relevant concomitant medicines reimbursed by the drug plan. Drug costs should reflect any markups, dispensing fees, and patient co-payments required by the individual public drug plan. The cost of companion diagnostic tests or medical devices covered by the drug plan should also be reported.
The number of times a drug is taken (dosing frequency) should be considered when calculating the annual cost. For drugs that are taken as needed or that are taken periodically throughout the year, an average number of courses of treatment should be used. Assumptions regarding the number of courses of treatment should be given and should align with the economic evaluation (e.g., CEA) accompanying the BIA.
The BIA should address the impact of compliance and persistence with therapy on the cost of treatments, if it is required by the public drug plan. As the BIA takes a drug plan perspective, it is important to consider whether the plan bears the cost. For example, a patient may not be compliant, but the drug plan may have already paid for the prescription. Any assumptions regarding compliance rates and persistence with treatment should be based on the best available evidence, which may come from database studies, specific data collection, or expert opinion. The relative compliance and persistence with therapy should be reported at various time intervals [Reference 18].
Only the most current reimbursement prices, costs, and cost adjustments should be used for the BIA. Otherwise, the impact of reimbursing the new drug could be underestimated.
Details relating to the calculation of drug costs are discussed in the following sections and in 7.5 Estimating Drug Prices.
6.5.1 Drug Prices
Drug prices specific to the individual public drug plan should be used to estimate the cost of drugs included in the BIA. The amount reimbursed for each drug should be clearly presented and should be specific to the medicinal ingredient and dose(s) of interest.
6.5.2 Concomitant Medicines
Concomitant medicines may provide a strengthened pharmacological effect or reduce the side effects of a given treatment. For example, an antiemetic is commonly taken during intravenous infusions to provide relief from the nausea and vomiting associated with chemotherapy.
If the new drug therapy requires the use of one or more concomitant medicines that are reimbursed by the public drug plan, they should be included in the BIA. As a result, the BIA should calculate the cost of ‘treatment strategies’ rather than the cost of each individual drug, although the cost of each medicine should be listed separately in the model. Only concomitant medicines related to the active pharmacological component(s) of the drug should be included (based on existing treatment guidelines, the indication of the new drug, and any restricted access criteria set by the manufacturer).
If evidence indicates that another new drug that will affect the assumptions related to the use of concomitant medicines will be added to the formulary during the time horizon, then the relevant concomitant medicines should be included in the BIA and the impact should be studied through scenario analyses.
6.5.3 Premiums and Deductibles
Premiums and deductibles should not be factored into the calculation of costs unless required by the individual public drug plan (e.g., income-based plans with universal coverage). This is because premiums and deductibles should be distributed across all drug therapies taken by a given patient in a given calendar year.
6.5.4 Markups, Dispensing Fees, and Patient Co-payments
The need to include plan-specific charges, such as wholesaler markups, pharmacy markups, dispensing fees, and patient co-payments in the BIA varies widely, and the analyst should carefully consider the requirements of each individual public plan.
If the new drug will have a significant impact on the amount reimbursed for markups or dispensing fees (e.g., the introduction of a fixed-dose combination therapy that reduces the number of dispensing fees paid per year), the actual plan-paid amounts can be included in the BIA. The methods used to calculate markups and dispensing fees should meet the requirements of each individual public drug plan. If the drug is covered by several plans within a given province (e.g., social assistance drug plan, seniors’ drug plan), the markups and dispensing fees used should represent a weighted average of the markups and dispensing fees of each relevant plan, unless otherwise specified.
In some cases, drug plans may require that manufacturers consider patient co-payments in their budget impact models and include the net impact to the payer.
In summary, when calculating the cost to the public drug plan, BIAs should:
- Include the price of the new drug along with all relevant concomitant medicines reimbursed by the drug plan, listed as separate elements
- Include the price of all relevant comparators and their concomitant medicines reimbursed by the drug plan
- Address the impact of compliance and persistence with therapy on the cost of treatments as required
- Adjust all drug costs according to the individual public drug plan’s requirements for BIA submissions
- Verify whether any plan-specific charges should be considered, and use the most current values for any required markups, dispensing fees, and patient co-payments
- Exclude premiums and deductibles unless required by the drug plan
6.6 Inflation and Discount Rates
Unlike in economic evaluations, neither discounts nor inflation should be considered in a BIA, unless warranted by special circumstances. Drug plan decision makers are concerned with the cost (or savings) their budgets will realize each year rather than the value, in present-day terms, of any costs (or savings) brought about through the reimbursement of a new therapy. While future costs could, in theory, be inflated by a predicted rate, this is not recommended.
Inflation and discount rates may be included if there is a strong justification (e.g., confirmed information on a pricing policy, the implementation of an approved new policy in the near future, or price changes after patent expiration).
In summary, it is recommended that:
- Inflation and discount rates should not be applied in a BIA cost analysis
6.7 Model Design
The budget impact model and the supporting BIA report should be transparent and accessible. They should be designed to meet the needs of the end users and to help them understand how the model works.
The simplest design that generates accurate, repeatable results should be selected and the model should be built using readily available software, such as Microsoft Excel. Choices and assumptions made during the development of the model should be fully explained.
As BIAs do not consider the clinical impact of treatment, a disease model that employs more complex modelling techniques, such as Markov modelling, should not be needed. However, more complex calculations may be required to account for the disease dynamics of the treated population.
To be transparent and accessible, the BIA model and supporting report should:
- Be designed in a manner that meets the needs of the end users
- Fully explain all choices and assumptions made by the analysts
- Use the simplest possible design structure
- Be built using readily available software (e.g., Excel)
6.8 Characterizing Uncertainty
To ensure transparency, uncertainty analyses should always be included in the BIA. Decision makers need to be informed of the sensitivity of the model to specific assumptions, as this will reveal the range of costs that drug plans can expect to pay if they choose to reimburse the new drug.
Two types of uncertainty are present in a BIA: parameter uncertainty in the input values; and structural uncertainty introduced by the assumptions made in framing the BIA. Deterministic sensitivity analyses (DSAs) are used to evaluate the uncertainties in the parameters, while scenario analyses are used to determine structural uncertainty. In scenario analyses, select input parameter values and structural assumptions are changed to produce plausible alternative scenarios [Reference 10] (e.g., the introduction of generics or biosimilars over the time horizon).
DSAs may include one-way analysis, multi-way analysis, and analysis of extremes.
- One-way sensitivity analysis involves testing various values for one parameter at a time. For example, varying the price of a comparator drug that is expected to be reimbursed by the time the new drug is listed would constitute a one-way analysis.
- Multi-way sensitivity analysis involves changing several parameters within the model simultaneously. An example of this approach would be changing the market share and market growth assumptions simultaneously to illustrate their combined effect on the drug plan budget.
- Analysis of extremes represents a special case of multi-way sensitivity analysis, where all of the parameters in a model are tested at their lowest values and their highest values (i.e., the most pessimistic and optimistic conditions). These analyses can be used to determine the range of possible results that can be obtained using the model and reasonable assumptions.
Probabilistic sensitivity analysis (PSA) is another type of multi-way sensitivity analysis. To perform a PSA, a probability distribution is assigned to each parameter, and a value is randomly drawn from the distribution for each model simulation. This process is then repeated many times to derive mean estimates. Although a PSA may be worthwhile as an exploratory analysis, as per the ISPOR BIA Guidelines [Reference 10] , it is not a required component for a BIA submission. Because the data for many of the parameters are limited, much of the parameter uncertainty of BIAs cannot be meaningfully quantified, and thus, standard approaches such as one-way and probabilistic sensitivity analyses cannot be fully carried out. Moreover, much of the uncertainty is structural and not easily parameterized. Thus, scenario analyses should be undertaken by changing selected input parameter values and structural assumptions to produce plausible alternative scenarios [Reference 10, Reference 16] .
Values used in sensitivity and scenario analyses should be supported by citable data sources. For example, if off-label use of the new drug has been noted in a foreign market, this should be explored within the scenario analysis using data from the foreign market to inform the model. In cases where confidence intervals have not been established for a given value, large changes to the value of the parameter should be tested. The value used should be justified in the body of the final report.
Parameters or assumptions associated with uncertainty in the accompanying economic evaluation should also be tested in sensitivity analyses in the BIA. At a minimum, the following parameters should be tested to demonstrate the impact of assumptions made during the model development, as they reflect the main components used to estimate the Reference and New Drug scenarios:
- Changes in the size of the market over the time horizon
- Market share distribution among the new drug and its comparators
- The price of the new drug assuming different price levels
- The price of any comparators and/or concomitant medicines for which uncertainty exists
The exclusion of any of the above-mentioned sensitivity analyses should be justified within the BIA.
Analysts are encouraged to include scenario analyses if they provide a better understanding of the impact of assumptions made during model development. These scenario analyses may include, but are not limited to, testing the following:
- Assumptions regarding the percentage of the eligible population with the condition of interest who are expected to be diagnosed and treated
- Assumptions related to the listing of new comparator drugs over the time horizon
- The inclusion of direct healthcare costs where relevant and applicable
In summary, the uncertainty analysis in submitted BIAs should:
- Provide deterministic sensitivity analyses (DSAs) (i.e., one-way sensitivity analysis, multi-way sensitivity analysis, analysis of extremes) and scenario analyses to inform decision makers of the sensitivity of the input data and model structure to specific assumptions
- Use scenario analyses to assess alternative situations, such as the introduction of future generics or biosimilars, patient compliance and persistence, access limitations, and off-label indications over the time horizon
- Provide cited information regarding the range of uncertainty associated with each assumption
- Provide a summary of sensitivity analyses performed at minimum on the following parameters: the size of the market, market share, the price of the new drug, and the price of any comparators and/or treatment strategy
6.9 Validation
The validity and transparency of the budget impact model must be assessed and documented within the BIA. All of the equations, parameters, and programming code used for the analysis must be checked and rigorously tested to ensure that the model is technically sound, and the documentation should be available on request.
The ISPOR–SMDM (Society for Medical Decision Making) task force report recommendations [Reference 19] can be used as a reference for the assessment process. Models should be based on the best available information that can be reasonably obtained (i.e., internal and external validation), and the analyst should consider the value of any additional information (cost versus improved model accuracy) when assessing what constitutes the best available data.
To validate a budget impact model for submission:
- The validity of the budget impact model should be assessed and documented
- The model should be rigorously tested to ensure that it is technically sound (e.g., mathematical calculations are accurately implemented and performed correctly) and documentation of this testing should be available on request
- Equations and parameters in the model should be checked against their sources
- Programming code should be documented, annotated, and undergo quality assurance and control methods for software engineering
- The programming used to perform the analysis (source code) should be made available for review (on the condition that property rights are respected)
7.0 Input and Data Source Recommendations
All of the results generated by the budget impact model are directly dependent on the input values and the methodology used for the calculations. As such, it is extremely important to select the most suitable assumptions and the best possible data. Although the final results are not a precise prediction of events that will occur in the future, they should accurately reflect what should be expected given the existing market dynamics.
This section provides analysts with concrete sources and examples of data that can be used to develop, populate, and evaluate their budget impact model.
7.1 Estimation of the Current Size of the Market
To estimate the size of the market, analysts may develop models based on either population (epidemiological) data or claims data, or in some instances, both. These two approaches, which are schematically presented in Figure 7.1, demonstrate:
- Population-based (epidemiologic) models that predict how a given population will respond to the availability of therapeutic options
- Claims data-based models that are based on historical drug purchasing behaviour
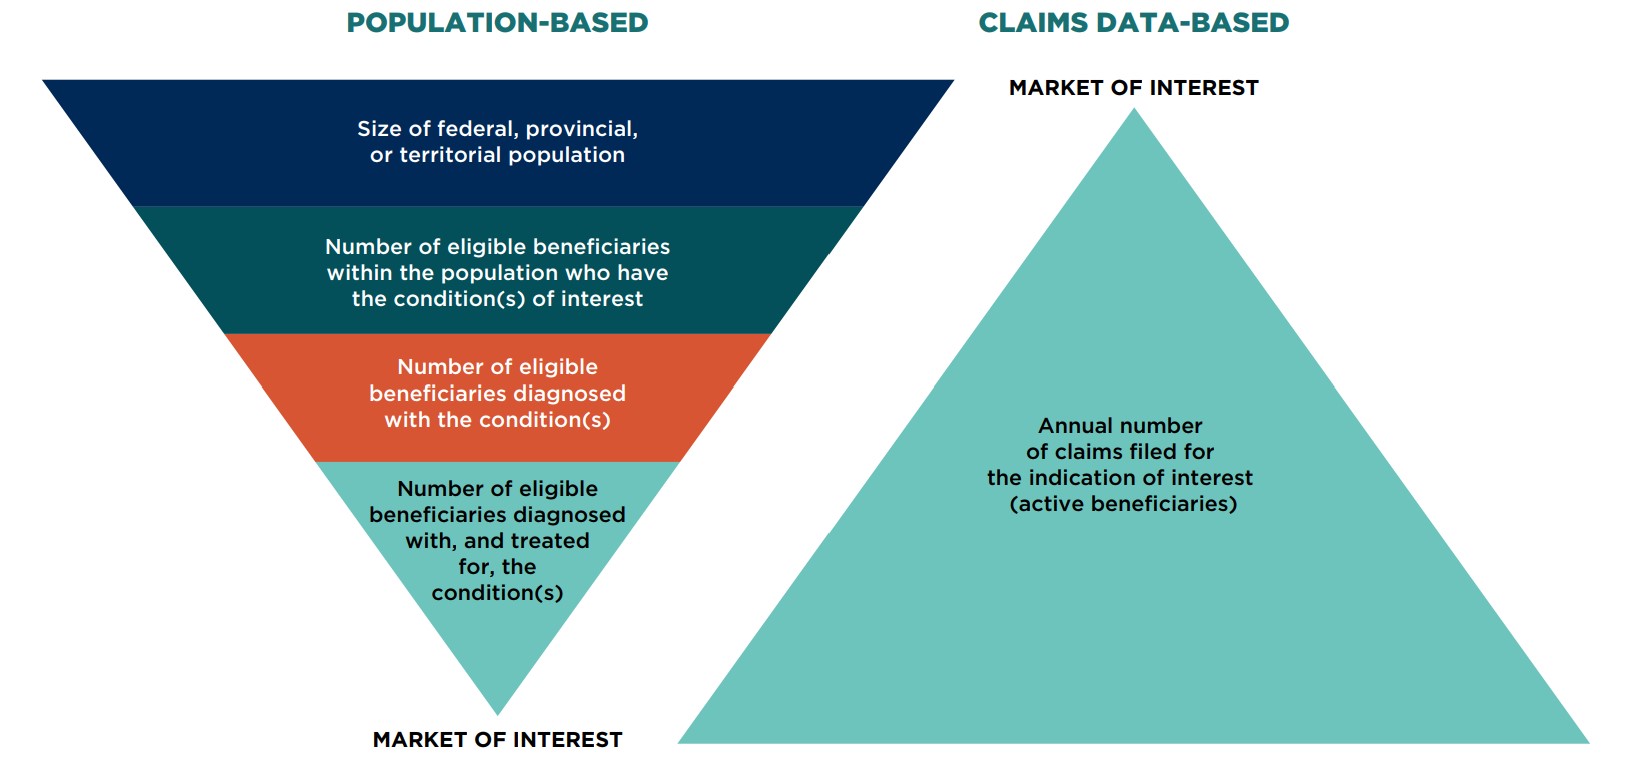
Figure description
Two tiered, pyramid-shaped diagrams demonstrate the process for estimating the market size using a population-based model and a claims data-based model.
Population-based model
The market of interest is determined by first assessing the size of the federal, provincial, or territorial population. Within that population, the scope is narrowed to the number of eligible beneficiaries who have the condition(s) of interest. The number of eligible beneficiaries diagnosed with the condition(s) must then be determined. Finally, from among that group, the market of interest is composed of the number of eligible beneficiaries diagnosed with, and treated for, the condition(s).
Claims data-based model
Using claims data, the market of interest is defined by identifying the annual number of claims filed for the indication of interest (active beneficiaries).
Models based on population data are an effective means of estimating the number of people eligible for coverage by a given drug plan (eligible beneficiaries) over time, while models using claims data provide the number of eligible beneficiaries who file a claim within a given year and receive treatment (active beneficiaries).
In the population-based model, population and epidemiologic data are used to estimate the number of people in a given jurisdiction who are likely to have the condition(s) of interest; the number of people who can become active beneficiaries by filing a drug claim for the treatment of the condition(s); and the number of active beneficiaries within each specialized drug plan (e.g., social assistance, seniors) who are currently receiving treatment for the condition(s). Population-based models are best used for cases in which the new drug may impact the number of individuals treated over time, such as a novel drug entering a new market or a new treatment that is therapeutically superior to existing medicines. While population and epidemiologic data are used to estimate the eligible population, other appropriate data, such as utilization data, may be needed to estimate the uptake or market share of the new drug.
Claims-based data are usually used for a new drug entering a more mature market. Using this approach, analysts can estimate the size of reimbursed patient populations for a given set of assumptions (e.g., the introduction of a new drug is not expected to increase the number of individuals treated for the condition).
For transparency and completeness, claims-based models should provide an estimate of the number of active beneficiaries based on the number of claims for both the Reference and New Drug scenarios. A justification for the choice of methodology used should be clearly stated, and the data should be fully documented. In addition, analysts should compare their estimated values to historical data to verify that the model is accurately predicting the size of the market.
Recommended methods for estimating the size of the market using population and claims data are provided in the following sections.
7.1.1 Determining the Market Size: Population-Based Model
When applying the population-based approach, a variety of data sources and assumptions can be used to establish the target population.
First, the number of eligible beneficiaries should be determined using publicly available drug plan information. If data is not directly available from the drug plan, it can be obtained from other reliable sources or estimated based on active beneficiary data. All sources used should be cited within the submitted report and model. In the rare case where there is no available data for the specific drug plan, data from a neighbouring Canadian jurisdiction with a similar drug plan should be used and adjusted to reflect the relative size of the general population.
Although many jurisdictions provide statistics regarding the number of active beneficiaries using their plans, they do not necessarily reflect the disease prevalence of the general population covered by the plan. In the absence of more accurate data, active beneficiary data may be used; however, the effect of all disease epidemiology, diagnosis, and treatment assumptions should be thoroughly tested to demonstrate their effect on the final result.
Detailed data pertaining to the eligible population can be obtained from the drug plan or other publicly or commercially available sources. If there is no age-related data available or if the level of detail is insufficient, the age distribution should be estimated. Active beneficiary data may be considered when estimating the distribution of the eligible population if there is no other available information.
When estimating the eligible population over a 12-month period, analysts should use the population size halfway through the period of interest. This accounts for the fact that the population at the beginning of the period may not be the same as the population at the end and assumes a linear growth in the population over the given period.
Once the number of eligible beneficiaries is known, the analyst should use disease incidence/prevalence statistics, as well as available data regarding the percentage of people who are diagnosed and treated, to estimate number of the eligible beneficiaries that would receive treatment. These details should be obtained from a published source, a public plan database, or if necessary, using expert opinion.
Many factors, including the nature of the condition of interest and its treatment, should be considered when deciding whether to use incidence or prevalence data to estimate the eligible population. Incidence data may provide a better estimate for conditions with shorter-term treatments, while prevalence data may be more pertinent for longer-term treatments. A combination of both may be required in some cases. It is important to note that the characteristics of the prevalent and incident populations may vary, potentially affecting the uptake of the new drug [Reference 20]. Analysts should consider this distinction when developing their BIA models.
If valid information regarding the percentage of people who are diagnosed and treated is not available, reasonable assumptions should be made. In the absence of any relevant data, the analyst should assume that all eligible beneficiaries with the disease will be diagnosed and treated. Assumptions should be tested using sensitivity analyses to determine their impact on the final results.
Methods for determining the eligible population with the condition(s) of interest are given in Figure 7.1.1 in order of reliability.
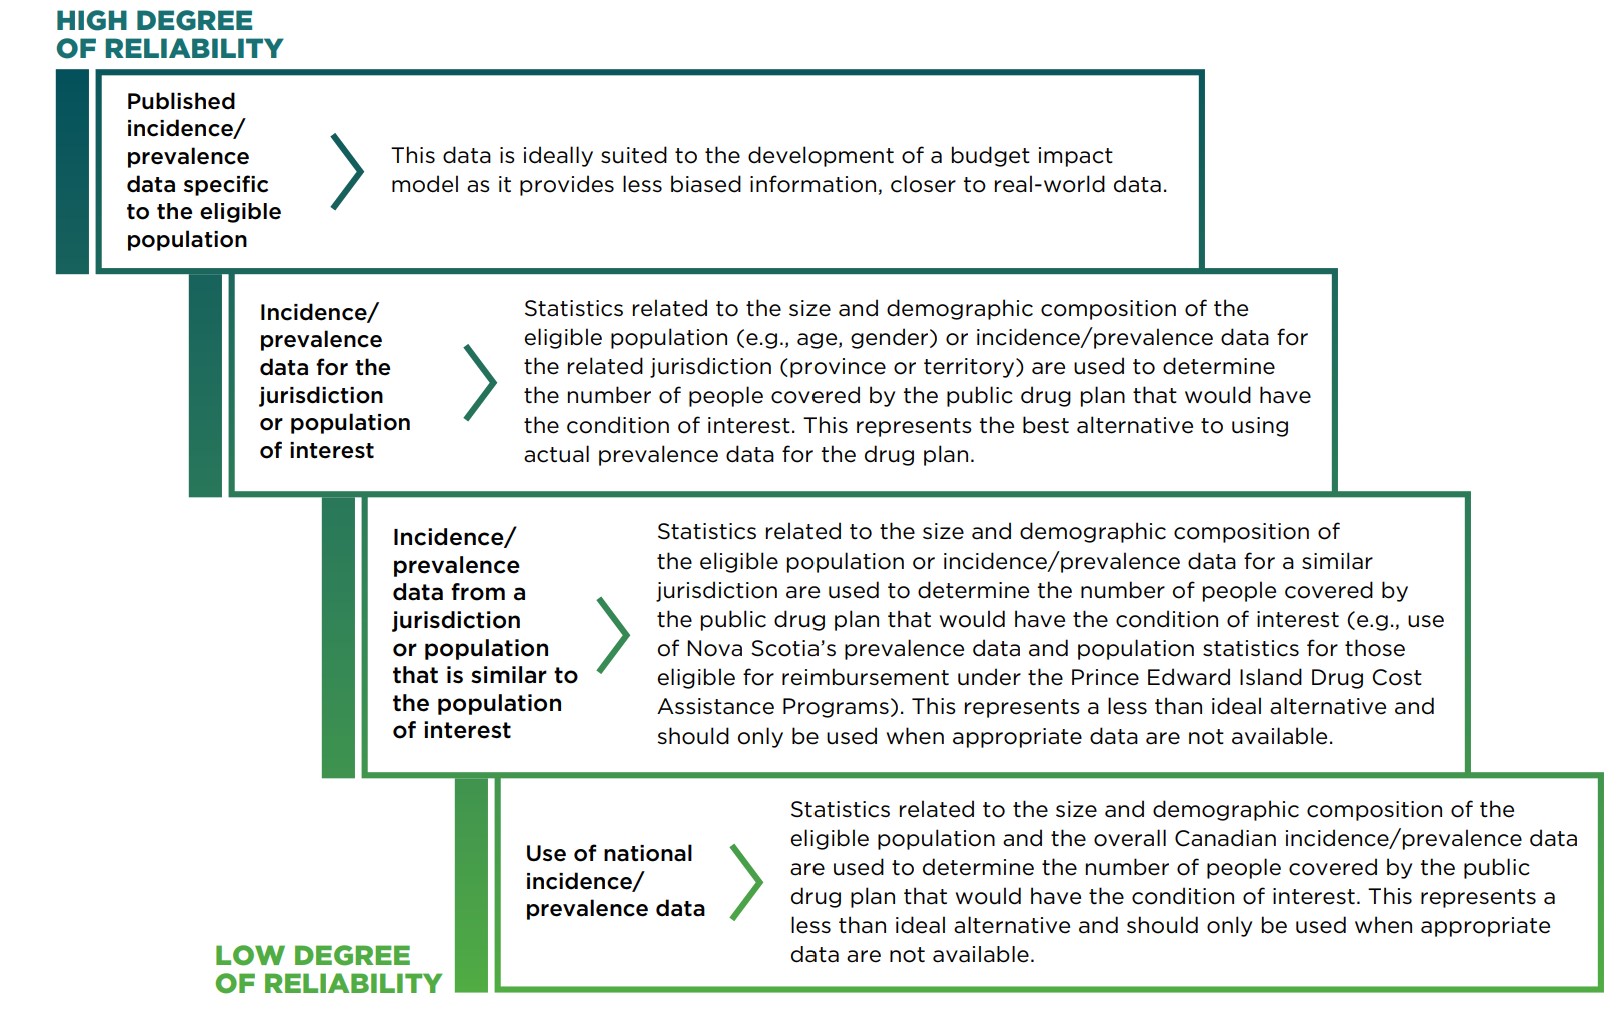
Figure description
This staggered diagram lists the methods for determining the eligible population with the condition(s) of interest from most to least reliable.
| Data source | Description |
|---|---|
Published incidence/prevalence data specific to the eligible population |
This data is ideally suited to the development of a budget impact model as it provides less biased information, closer to real-world data. |
Incidence/prevalence data for the jurisdiction or population of interest |
Statistics related to the size and demographic composition of the eligible population (e.g., age, gender) or incidence/prevalence data for the related jurisdiction (province or territory) are used to determine the number of people covered by the public drug plan that would have the condition of interest. This represents the best alternative to using actual prevalence data for the drug plan. |
Incidence/prevalence data from a jurisdiction or population that is similar to the population of interest |
Statistics related to the size and demographic composition of the eligible population or incidence/prevalence data for a similar jurisdiction are used to determine the number of people covered by the public drug plan that would have the condition of interest (e.g., use of Nova Scotia’s prevalence data and population statistics for those eligible for reimbursement under the Prince Edward Island Drug Cost Assistance Programs). This represents a less than ideal alternative and should only be used when appropriate data are not available. |
Use of national incidence/prevalence data |
Statistics related to the size and demographic composition of the eligible population and the overall Canadian incidence/prevalence data are used to determine the number of people covered by the public drug plan that would have the condition of interest. This represents a less than ideal alternative and should only be used when appropriate data are not available. |
A new drug may be listed with restrictions, and it is important to include budget projections that reflect this scenario. In this case, the size of the market should be reduced based on available data. For example, if only seniors who are female and have experienced a fracture are to be considered in the analysis, only population data for those with the desired demographic profile (i.e., females over 65 years of age) would be considered, and this subgroup would be further restricted to include only those patients who had experienced a fracture. To calculate the impact of a restricted listing status, the analyst can use sources similar to those used to estimate market size and growth, as well as disease-specific studies and any other relevant, verifiable data.
7.1.2 Determining the Market Size: Claims Data-Based Model
The number of claims for a given indication should be estimated using a database that captures detailed claims-based public drug plan information.
The number of claims used for the baseline year should include claims for all relevant comparators for the same indication. If the new drug or the comparator drugs are used for multiple indications, claims-based data should only be used if the distribution of claims by indication is available for each comparator. If this is not possible, the population-based model should be used instead.
Claims-based models should be used to calculate the number of active beneficiaries reported in the BIA to validate the claims estimates and to provide drug plans with the approximate number of beneficiaries that are currently being treated for a given indication. If a direct count of the number of active beneficiaries is not available, it can be estimated by dividing the annual number of claims for each primary treatment by the average annual number of claims filed per person. As each claim filed is specific to a particular patient, there should be no double-counting of active beneficiaries. A justification for the choice of methodology should be clearly stated, and the data should be well described and validated.
In some cases, the estimates calculated using this approach cannot be subdivided by age and/or gender, and, thus, age- and gender-specific prevalence data cannot be used for forecasting purposes.
As in the population-based approach, claims-based models should consider any listing restrictions for the new drug, as well as for its competitors.
In summary, when estimating the size of the market, analysts should:
- Generate estimates using a population-based or claim data-based approach, or both, as appropriate
- Provide population estimates when using claims data-based models
7.2 Selecting Relevant Comparators
When choosing comparators to be included in the BIA, analysts should consider the existing therapeutic options for the same indication(s) as the new drug. Selected comparators should align with those in the accompanying economic evaluation, unless there is a clear justification for not doing so (e.g., in the case of non-pharmacological/surgical alternatives).
Comparators should be categorized and analyzed by indication. This will provide drug plan decision makers with an estimate of the overall impact of reimbursing the new drug, in addition to the impact by indication, as market dynamics may differ between subgroups (e.g., subgroup-specific comparators may exist).
In the case of concomitant therapies, each comparator and its associated concomitant medicine(s) are considered as a single treatment strategy within the BIA (e.g., the use of an antiemetic and a chemotherapy drug), although the costs for each medicine should be listed separately in the model for transparency.
Fixed combination drug therapies should be costed as a single treatment strategy. The use of fractional costs to represent the proportion of the fixed combination drug that is a direct comparator is discouraged.
Non-drug alternatives are normally excluded from the base-case analysis, except in rare cases when required by the drug plan (e.g., when a pill replaces a demand for a surgery). However, they should be mentioned in the report and can be included in the scenario analysis if they are expected to have a significant impact. In all cases, the approach should be justified, and the data should be well described and validated.
To determine which pre-existing drugs are likely to be displaced by the new drug, data from other markets should be used (e.g., real-world data, published studies). In the absence of such data, expert opinion may be used.
If there is a high probability that a new comparator will be added to the formulary before the new drug is listed, it can be included in the base-case or scenario analysis in the BIA, depending on the rationale for inclusion and drug plan requirements. If the data suggests that a new comparator may be listed but the likelihood is uncertain, it should typically be included in scenario analysis, when appropriate.
Medicines that are commonly used off-label for the same indication(s) as the new drug and that are listed on the public drug plan formulary may be included in the base-case or the scenario analysis, depending on the individual public drug plan requirements. Anticipated generic entries can be considered in the scenario analysis if they are classified as under review by Health Canada or if they are expected to become available within the forecasted time period.
If there are no comparators for the new drug, a population-based model should be developed, as the evolution of the new market will need to be determined.
In summary, to select relevant comparators for a budget impact model, analysts should:
- Group drug comparators by indication and align them with the accompanying economic evaluation if possible
- Identify treatment strategies that can be compared to the new drug
- Seek adequate input (e.g., post-market experience in other jurisdictions or published studies, and if necessary, expert opinion) to identify comparators and their use
- Include relevant non-medicinal comparators in the scenario analysis if their impact could be significant
- Include any potential comparators that are expected to be listed on the formulary during the time horizon in the scenario analysis; if appropriate rationale is provided, they can be included in the base-case, when appropriate
- Include future generics in the scenario analysis if appropriate
7.3 Forecasting the Market: Reference Scenario
After establishing the baseline year, the next step is to forecast the data for the model over the time horizon. Analysts should only include tools that are part of the basic software package being used for the model (generally Microsoft Excel). Any user-defined macros should be clearly written and presented, and fully documented. This will ensure that drug plan decision makers can readily use, understand, and evaluate the model.
The forecasts should consider anticipated changes to the market over the time, including the estimated market growth and distribution of comparators. All sources of information (including databases, published studies, and expert opinions) must be identified and referenced within the BIA, and the selection of data for all forecasts and assumptions should be fully explained.
7.3.1 Estimating Market Growth
The estimated market growth is the product of two factors: general population growth and disease-specific changes.
Population growth statistics entered into the model should be obtained from published, publicly available forecasts. Statistics Canada holds the largest collection of relevant population data and forecasts. If reliable forecasts for the target population are not available, estimates can be generated based on a published and/or reliable source (e.g., a database derived from drug plan data).
The number of patients treated for a given condition may vary over the time horizon, due to changes in healthcare standards or drug benefit plans, among other factors. Any expected change in the market should be reflected in the market growth estimates. Information on potential changes can be obtained from various sources including the drug plan and CADTH websites and publications, other published literature, expert opinion, the evaluation of historical data, and verifiable market intelligence. In the absence of any information, the market should be considered to be stable and the growth rate should be assumed to be 0%.
7.3.2 Estimating Market Share Distribution
Once the market projections have been generated, analysts must then estimate the market share distribution of the available treatment strategies over the time horizon. These estimates are needed for both the Reference Scenario, which assumes that the new drug is not listed on the formulary, and the New Drug Scenario, which assumes that the new drug has obtained reimbursement status.
For the current market, public drug plan data should be used to determine how patients (or claims) are distributed among the available treatment strategies. Yearly trends should be calculated for each comparator and used to forecast any market share changes over the time horizon based on the expected market trends. If the market is considered to be stable, the market share distribution of the comparators can be kept constant over the time horizon.
In some cases, one or more of the comparators may be indicated and used for more than one condition. Depending on the source, the data may not be separable by indication or use. In this case, published studies should be used to determine the percentage of patients being treated for the indication(s) of interest. If published material is unavailable, expert opinion may be used. If new treatments are expected to be listed during the time horizon or if existing treatments may become unavailable (e.g., drug discontinuation, anticipated listing of a competitor, availability of generics), these changes should be estimated and included in the BIA in a scenario analysis. Historical data for similar drugs in the same market should be used to determine how market disruptions might shift the distribution of available treatments. Alternatively, historical data from a private or foreign market that is similar to the market being modelled could be used to forecast market changes. In the absence of all other information, the following strategies may be used:
- Listing a new competing treatment:
The market share growth of the new competitor should mirror that of the proposed new drug.
- Treatment discontinuation:
The market share held by the discontinued drug should be split proportionally among the remaining treatments based on the size of the market held by each comparator. For example, a treatment that held 80% of the market would be expected to capture 80% of the market share of the treatment that was discontinued.
If there are no comparators for the new drug, the Reference Scenario should not include any drugs, while the New Drug Scenario should include only the new drug. This is the simplest BIA format, where the budget impact is equal to the total cost of the drug being introduced.
In summary, to forecast changes in the Reference Scenario market, analysts should:
- Use tools that are part of the basic software package being used for the model
- Use published forecasts for population growth statistics
- Access available databases to determine the current distribution of treatment strategies
- Develop forecasts that take anticipated changes to the market over the time horizon into consideration (e.g., listing a new competing treatment, treatment discontinuation, or availability of generics)
7.4 Forecasting the Market: New Drug Scenario
Once a new drug is listed on the formulary, the existing market dynamics may no longer apply. The rate of market growth, the use of the available treatments, and even the amount paid per year by the drug plan may change following the addition of the new drug. Analysts developing BIAs must consider these factors when generating forecasts of expected market changes over the time horizon.
The new treatment strategy mix used within the BIA should reflect any expected changes in the market following the introduction of the new drug. In addition, any change in the market share distribution should be explained. The rate at which the new drug is expected to capture market share from its comparators should be clearly documented and should reflect the market share captured from the preceding year.
Markets where the new drug is currently reimbursed should be used to inform the forecasting process. This information should be included either within the main body of the report or in an appendix, along with a brief evaluation of whether the data and/or data trends are likely to reflect the expected changes in the drug plan markets under consideration.
The forecasted market share of the new drug in the drug plan should be based on its market growth in other public drug plans in Canada, in Canadian private payer markets, or under exceptional circumstances, in foreign markets. Private payer or foreign markets should only be used if they are similar to the public drug plan market under consideration, or if the relationship between the market and the private payer (or foreign) market is well understood. If the new drug has not been listed in other formularies, projections can be based on the market share of a similar product in a private payer or foreign market. This method should only be applied if there is clear evidence that it is going to generate reasonable and relevant results.
If none of the above-mentioned methods can be used to estimate the market share of the new drug, the forecasted market share can be based on published study data, expert opinion, previous experience, and/or other reliable data sources that provide details related to the expected use of the drug.
Several factors can be used to calculate the market share of the new drug, including the percentage of:
- Patients using competing treatments who are eligible to use the new drug
- Physicians who are aware of the new drug
- Physicians who are willing to prescribe the new drug
- Patients using competing treatments who are aware of the new drug
- Patients using competing treatments who are likely to switch to the new drug
- Patients who try and fail to respond to the new drug
Additional criteria may be added to this list based on the needs of the individual public drug plan. The product of all the percentages for each year in the model represents the expected annual market share of the new drug.
7.4.1 Estimating Market Growth
If the reimbursement of the new drug is expected to change the number of beneficiaries treated for a given indication, this should be reflected in the forecasts. The impact of this change can be estimated based on experience in private payer or foreign markets, by using data from similar drugs that have entered the marketplace, or by using expert opinion. Sensitivity analyses should be performed on any data-based estimates of market growth. If data-based high and low estimates cannot be generated, reasonable low and high estimates of the growth rate should be used; the reasoning behind the selection of these estimates should be well described and documented.
If there is no data from which to extrapolate changes in market growth, the market growth due to the introduction of the new drug should be assumed to be 0%. This assumption should be stated explicitly and tested using sensitivity analyses that study the effect of reasonable annual increases or decreases on the size of the market (e.g., a 5% increase). The justification for the use of a specific value for the sensitivity analyses should also be given.
In the case where there is strong evidence (or reliable expert opinion) to suggest that no market growth will be realized through the introduction of the new treatment, sensitivity analyses do not need to be performed; however, supporting evidence should be provided.
In all cases, projections should be made for the entire time horizon and commentary on the data supporting these estimates should be provided.
7.4.2 Estimating the Market Share of the New Drug
The potential utilization of the new drug within the market will have a significant impact on the results of the BIA. Historical data from Canadian private payers or foreign markets should be used to estimate the market share distribution of the comparators for the New Drug Scenario. Although this represents the best available method for estimating the market share, it is limited by the differences between markets, as information from one market may not be directly transferable to another.
An alternative approach is to develop a model that forecasts the market share of the new drug based on inputs such as predicted patient awareness of the new drug, physician awareness of the new drug, probable switching behaviour, and other related factors. In this approach, potential changes in the market are used in the model to estimate the incremental cost or savings realized by the drug plan. Expert opinion should be used to assess the reasonableness of these estimates.
It is important to report all assumptions and calculations related to the market share estimation as thoroughly as possible.
7.4.3 Estimating the Displacement of Existing Therapies
The rate at which the new drug will capture market share should be estimated based on a series of carefully considered assumptions. These assumptions should make use of all available verifiable market intelligence and be fully documented.
When calculating market uptake, each forecasted year for the new market should be based on forecasts made for the previous year. For example, if 100% of the market share of a given comparator was assumed to be captured by the new drug in year 1, then 0% would be captured in year 2.
In cases where there is no data available to improve the quality of the market forecasts for each comparator or where the new drug is expected to increase the size of the market without resulting in patient switching, the rate at which a new drug will capture market share from an existing comparator is assumed to be proportional to the comparator’s market share. For example, if Comparator A holds 75% of the market and Comparator B holds 25% of the market, it would be assumed that 75% of the new drug’s growth would be derived from Comparator A and 25% of the new drug’s growth would be derived from Comparator B.
In summary, to forecast changes in the New Drug Scenario market, analysts should:
- Apply the general rules detailed for forecasting the Reference Scenario
- Consult drug-specific data from markets where the new drug is currently reimbursed
- Consider and appropriately reference current verifiable market intelligence on how the reimbursement of the new drug will affect the market
7.5 Estimating Drug Costs
Drug prices are a key component of BIAs and should be estimated with care. Factors such as the unit price of the drug, therapeutic equivalencies, and price adjustments such as markups, dispensing fees, and patient co-payments all play a role in estimating the incremental cost or savings realized by listing a new drug. The following sections describe how these factors should be estimated and used within budget impact models to align with the unit cost and treatment assumptions used in the accompanying economic evaluation.
7.5.1 Estimating the Unit Cost for Drugs Currently Reimbursed by Drug Plans
To estimate the cost of each drug, or treatment strategy, reimbursement prices should be obtained from the best available source(s), which may include the drug plan formulary, the manufacturer, the wholesaler, or public drug plan data providers.
The most recent formulary price lists should be consulted for pricing information to be included in the BIA. Note that additional charges, such as markups, may already be included in the price shown in the provincial drug lists. The National Prescription Drug Utilization Information System Plan Information Document from CIHI (Canadian Institute for Health Information) provides contextual information regarding the additional charges used by each public drug plan across Canada.
The most appropriate price for each comparator should also be included. This may represent the lowest reimbursed price for a specific medicinal ingredient, the lowest reimbursed price for a type of therapy, the actual price of the drug, or some other price. The formulary will indicate the price that should be used in most cases.
If the price reimbursed for a given drug is based on the drug’s ex-factory price, the drug price may be obtained from the manufacturer. The price of the new drug and the comparator drug should be aligned in terms of applicable markups.
If the unit price cannot be obtained from either the drug plan formulary or the manufacturer, wholesaler drug price information or other sources of public drug plan data may be used. The data source must be as recent as possible, preferably within the same calendar year as the other prices used within the model.
In all cases, the prices used within the BIA should be derived from sources specific to the drug plan being evaluated. For example, a BIA for the province of Ontario should use Ontario costs and not costs for Alberta. All cost sources used should be clearly documented.
7.5.2 Estimating the Unit Cost for Drugs not Currently Reimbursed by Drug Plans
The prices of drugs that are not currently reimbursed, but are expected to be listed within time horizon, should be estimated using available data.
If the new comparator represents a lower dose version of an existing treatment, the price of the existing treatment should be used. If the new drug represents one of a class of drugs, the lowest priced alternative within the class as defined by the drug plan should be used to set the price.
If only limited information regarding the price of the non-benefit comparator is available, the price of the comparator should be set to the price of the new drug under consideration to minimize bias in the analysis.
Any assumptions made about the price of drug comparators should be reported within the BIA report and tested using DSA.
7.5.3 Estimating Therapeutic Equivalencies
When determining the cost per prescription or the patient cost per year within a BIA, it is important to accurately evaluate therapeutic equivalencies. In the BIA, ‘therapeutic equivalence’ refers to equivalence in use, rather than therapeutic efficacy. For example, a drug that is prescribed for once a month use and a drug that is prescribed for once a day use cannot be fairly compared by considering the unit prices alone. Instead, the frequency of drug use must also be factored into the comparison of the two treatments.
To allow for an equitable comparison, the number of units of a given drug used per day and the number of days used per year should be clearly presented within the BIA. In a claims-based model, the claims for each drug should be standardized to represent the same treatment period. These estimates reflect the amount of drug dispensed, rather than the amount consumed, so the amount reimbursed by the drug plan will reflect the number of units dispensed per claim. Therefore, drug wastage and sharing of units should already be accounted for in the drug cost and do not require additional adjustments. If required, these can be addressed in a scenario analysis.
All courses of treatment modelled within the BIA should be derived from the product monograph or a public drug plan database, or other applicable drug plan data. If real-world data is available, patient persistence should be considered when estimating the treatment duration. The data should provide a clear indication of the number of units administered per day or per year for each treatment. For cases in which the treatment strategy includes more than one drug, real-world data can provide information on concomitant drug use. An explanation of why the selected data source is valid should be provided.
7.5.4 Including Applicable Markups, Dispensing Fees, and Patient Co-payments
Each participating drug plan determines its own policies for the reimbursement of markups and dispensing fees, as well as patient co-payments. If required by the plan, these price adjustments should be included in the drug costs used in the model and any calculations should meet the requirements of each individual public drug plan. An up-to-date list of price adjustments should be obtained directly from the drug plan websites. The CIHI and PMPRB websites also provide information on plan-specific charges.
When a BIA is conducted for a fixed combination therapy, dispensing fees should be included in the calculation of the impact of the new treatment on the overall drug plan budget. This is because the use of a fixed combination therapy reduces the number of submitted claims and thereby reduces the amount paid by the drug plan to cover dispensing fees. Wholesaler markup and pharmacy markup should also be included if they have a direct impact on the calculation of the dispensing fees covered by the drug plan. Co-payments should only be included if required by the drug plan. Analysts should consult CIHI’s National Prescription Drug Utilization Information System Plan Information Document for information on co-payments.
In summary, to price each treatment strategy, analysts should:
- Obtain reimbursement prices from the best available source(s), such as drug plan formularies, public drug plan databases, and wholesaler pricing information
- Estimate the number of days of treatment for each treatment strategy (i.e., consider therapeutic equivalencies and drug wastage)
- Include price adjustments based on the requirements of the individual public drug plan
7.6 Calculating the Budget Impact
Estimates from the Reference Scenario and the New Drug Scenario should be used to determine the incremental cost or savings realized by a drug plan. The process for calculating the budget impact is shown in Figure 7.6.
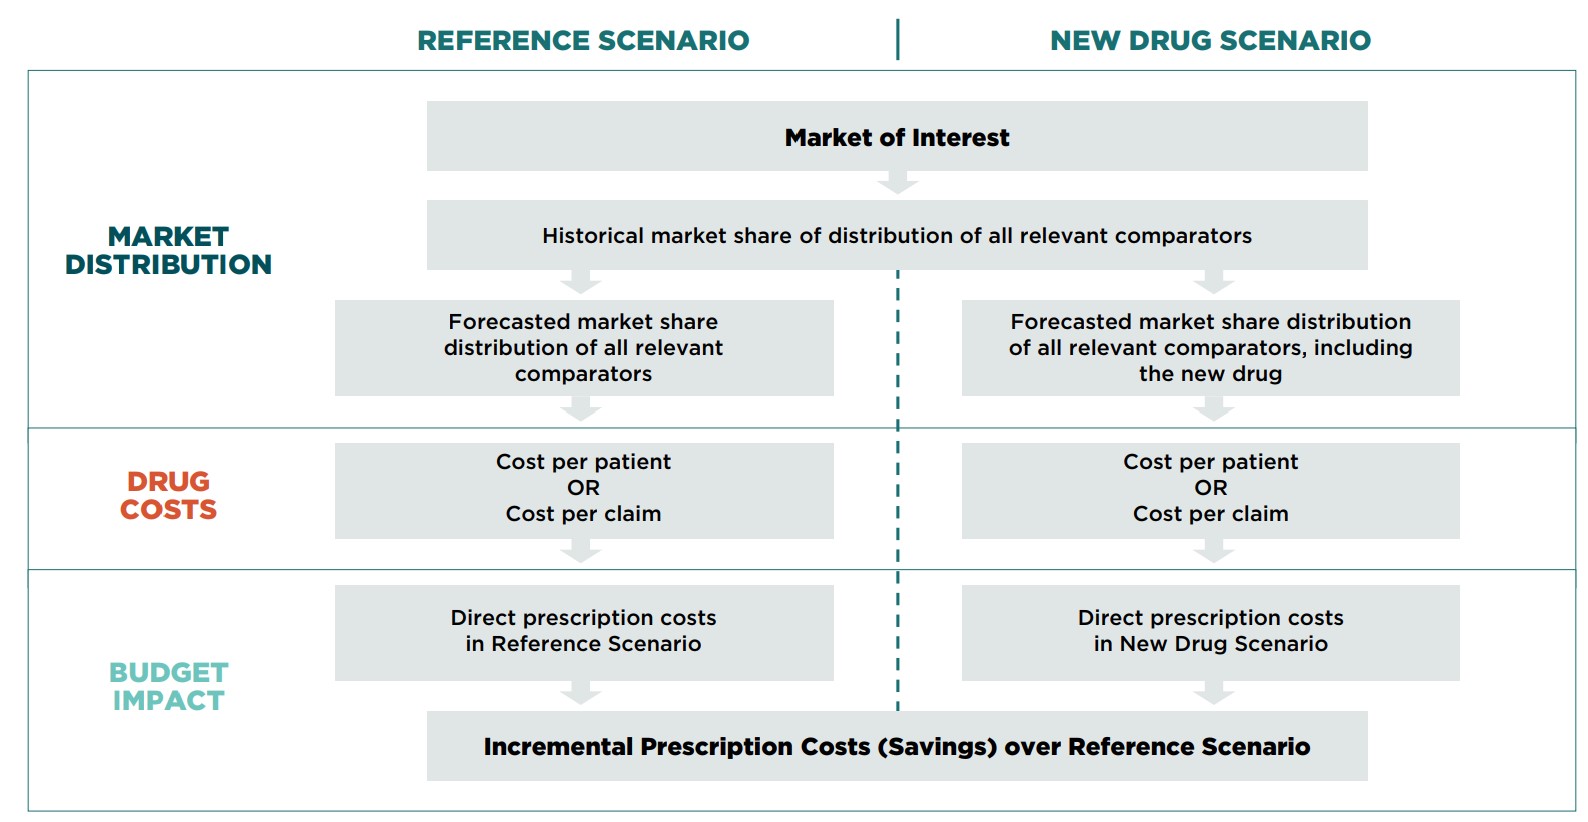
Figure description
A flowchart illustrates the process used to determine the budget impact of the analyzed drug. The chart compares the process for both the Reference Scenario and the New Drug Scenario through three main sections of the analysis: market distribution, drug costs, and budget impact.
The flow for the Reference Scenario is as follows:
Market Distribution
- Market of interest to
- Historical market share of distribution of all relevant comparators to
- Forecasted market share distribution of all relevant comparators
Then
Drug costs
- Cost per patient or Cost per Claim
Then
Budget Impact
- Direct prescription costs in the Reference Scenario
The New Drug Scenario follows the same flow except that the forecasted market share distribution of all relevant comparators in this scenario includes the new drug.
The final budget impact is determined by calculating the incremental prescription costs (savings) of the difference between the scenarios.
The value of each scenario is equal to the total of the annual cost of each treatment strategy. Estimation of the annual cost of a treatment strategy depends on the model. If a population-based model is used, the annual cost of a treatment strategy is equal to:
Annual number of patients x Annual market share of treatment strategy x Annual drug cost per patient
For a claims-based model, the annual cost of a treatment strategy is equal to:
Annual number of claims x Annual market share of treatment strategy x Drug cost per claim
The budget impact is equal to the difference between the value of the New Drug Scenario and the Reference Scenario. A positive budget impact value indicates that the introduction of the new drug will result in increased expenditures for the drug plan, while a negative value indicates that the drug plan will save money by adopting the new drug.
Incremental prescription drug costs should be calculated for each of the forecasted years of the time horizon. In addition, the cumulative incremental prescription drug costs for the time horizon should be evaluated. Summary calculations for the total direct drug costs in each year (Year 1, Year 2, and Year 3) and for all years (Years 1–3), should be presented by scenario to allow reviewers to understand how the budget impact was calculated.
8.0 Reporting Format Recommendations
The recommended reporting format is based on the ISPOR preferred structure for BIA reporting [Reference 10] . The information should be presented to maximize consistency and transparency. Choices made during the development of the BIA should be fully documented and clearly described so that decision makers can easily understand the methodology behind the submitted budget impact model.
The BIA Completion Checklist (Appendix C) should be used to verify that the BIA is complete.
8.1 Report Contents
Introduction
The introduction should include the objective and perspective of the analysis, as well as a summary of all relevant epidemiological, clinical, and economic information related to the eligible population and disease indication of interest. The specific information to be included is as follows:
Objective
The objective of the BIA should be clearly stated and tied to the population for which reimbursement is being sought, the time horizon being reported, and the perspective used in the report.
Epidemiology and management of the health problem
Age- and gender-specific details regarding the prevalence and incidence of the disease in question, disease pathology, disease severity, disease prognosis, disease progression, undiagnosed or undertreated cases, and risk factors pertinent to estimating the budget impact should be reported.
Clinical information
Clinical information related to the eligible population and existing management options (both pharmacological and non-pharmacological treatment options) that are relevant to the design of the BIA and their efficacy and safety should be summarized. If there are additional therapeutic options that are expected to become available by the end of the time horizon, these should be included in this description.
Economic impact
Studies that examine the indication and treatments of interest should be discussed. These studies may include:
- Previous BIA studies in the condition of interest for another drug
- Burden of illness/cost-of-care studies
- Cost-effectiveness or cost-utility studies
Technology
This section should describe the characteristics of the new drug, including details on how the new technology compares to existing treatments. The specific characteristics that should be addressed are:
- Indication (based on the product monograph)
- Formulation
- Onset of action
- Efficacy
- Side effects
- Serious adverse events
- Intermediate outcomes
- Adherence/compliance
A brief summary of the clinical trials should also be provided, including information on the design, study population, follow-up period, and clinical outcomes. This summary may be presented as a table, if desired.
Study Design and Methods
The methods section of the report should provide enough detail to allow a third party to replicate the analysis. Each of the following model characteristics should be included:
Patient population
The patient population of interest (eligible population with the condition) should be clearly and succinctly defined within this section of the report. Details regarding restricted access to the new drug following its formulary listing should be noted.
Treatment strategy mix
Assumptions made regarding the treatment strategy mix included in the model for the Reference Scenario and the New Drug Scenario should be described and justified. The selected treatment strategies should represent the treatment patterns and clinical guidelines of the specific jurisdiction. The relevant characteristics of each treatment strategy should also be provided. These include the approved indication, dose, efficacy, adverse events, and adherence issues.
Perspective
The BIA should focus exclusively on the impact that the listing of a new drug on will have on the public drug plan budget. This perspective should be confirmed in the report, and the specific drug plan targeted by the BIA should be identified.
Time horizon
Generally, the reported time horizon should be three years from the anticipated date of listing for the new treatment. A longer time horizon can be used with justification.
Model description
A schematic illustration of the model should be provided, along with a detailed and complete description of the structure of the BIA model.
Input data and data sources
To allow for the replication and verification of the submitted results, all values used to generate the results for analyses within the BIA, including alternative scenarios, should be presented in the report. Any transformations or computations that are applied to the data should be described in sufficient detail to support replication. Depending on the structure of the budget impact model, these parameters may include cost, epidemiological, or drug utilization data items.
Each parameter value should be described and referenced to allow the reader to assess the validation of the selected data. Selection criteria for studies and databases should be discussed to provide guidance for this assessment process. In addition, the direction and magnitude of any potential bias in the data sources that were used should be indicated.
Data collection
The methods and processes used for data abstraction (e.g., from databases) or any primary data collection (e.g., expert opinion) should be provided. Any data, summary reports, or data collection forms/queries should also be included as appendices.
Analysis
A description of the methods used to calculate the total budget required to introduce the new drug and incremental prescription cost compared to the Reference Scenario should be provided for the main analysis. The description should be of sufficient detail and clarity to allow the reader to perform the same analysis and obtain the same results. The choice of all the scenarios presented in the results should be documented and justified.
Uncertainty
A description and justification for the uncertainty analysis methods should be provided.
Results
When reporting the model results, both the total budget and the incremental budget impact should be presented for each year of the time horizon. Tables showing aggregated and disaggregated drug costs over time before and after applying drug plan-specific costing information (e.g., markup, dispensing fees, patient co-payment) should be provided. An explanation of these results should accompany the tables. The results of the uncertainty analyses and scenarios analyzed should be described and presented in figures or tables.
Sensitivity and Scenario Analyses
The results of the sensitivity analyses should be described, and the choices made with respect to changes to the inputs used in the Reference Scenario should be justified. A table summarizing the results of the sensitivity analyses should be provided in this section. A graphical representation of the results should also be included (e.g., tornado diagram).
Sensitivity analyses and scenario analyses should be presented within the main body of the report. Related sensitivity analyses should be reported together (e.g., sensitivity analyses pertaining to market size should be reported together, and the range of the market size sensitivity analyses should be reported explicitly).
Any limitations or assumptions specific to the sensitivity and scenario analyses should be reported as a sub-section of this section in a manner similar to that used in the Limitations and Assumptions section.
Limitations and Assumptions
The report should contain a clearly identified section that itemizes the known limitations and assumptions made to develop the model and/or report (regarding key design issues such as off-label use and adherence assumptions, and the completeness and quality of data inputs and sources). The reason behind each limitation or assumption should be briefly noted within this section. In addition, a summary table should be included for simplified access to this information. The Limitations and Assumptions section should, at the very least, consist of the following subsections:
- Limitations and Assumptions: Model Structure
- Limitations and Assumptions: Input Data and Data Sources
Conclusions
A conclusion that summarizes the key information presented in the report should be included. The incremental budget impact for each of the forecasted years as well as the incremental budget impact for the time horizon should be reported in this section.
References and Appendices
References should be provided, and appendices are strongly advised to ensure the transparency of submitted BIAs. The inclusion of information related to data inputs used in the model and report will facilitate the assessment of each submission’s validity.
9.0 Interactive BIA Model
BIA models should be presented as a series of clearly defined steps to facilitate their review. Detailed descriptions and clear justifications for all calculations should be included.The analyst should design a BIA model that is functionally interactive to enable a reviewer to easily change various parameters in order to address provincial differences in drug price regulations (e.g., drug prices, markups, professional fees, and co-payments) or to test the impact of price discounts. All user-defined macros should be clearly presented and fully documented.
9.1 Additional Submission Details
Use of Tables and Figures
The use of graphs and/or tables to represent the model structure, inputs, and results will provide drug plan decision makers with a clearer vision of the structure and function of the budget impact model.
All reports should contain the following items:
A Schematic Representation of the Model
A diagram that clearly explains the model’s function should be provided, along with accompanying descriptive text. This diagram may be developed as a drug-specific adaptation of Figure 9.1.
Tables of Inputs and Outputs
Tables listing the model inputs (along with their references) and outputs provide reviewers with an easily accessible summary of the model. These tables should be included in the Input Data and Data Sources section of the report.
Table of Limitations and Assumptions
Listing the limitations and assumptions of the model improves its overall transparency. This table should be included in the Limitations and Assumptions section of the report.
Schematic Representation of Uncertainty
Analysts are encouraged to use graphics (such as tornado diagrams) as a means of presenting the variables with the greatest impact on the model’s results. These diagrams should be included in the Sensitivity and Scenario Analyses section of the report.
When using diagrams to demonstrate the uncertainty inherent in a given model, summary results of the net impact to the budget should be presented for at least three years (i.e., Years 1–3) following formulary listing. The net impact for individual years (i.e., Year 1, Year 2, Year 3) should only be presented if it provides additional insight.
A sample tornado diagram is shown in Figure 9.1. In this example, six categories of sensitivity analyses were performed and the ranges were plotted. The values considered represent the budget impact for the three-year time horizon. In addition to plotting the sensitivity analyses, the three-year budget impact value from the base-case analysis, which was estimated to be $20,000, is represented using a line that intersects the x-axis at this value. The six sensitivity analyses were ordered along the y-axis by the magnitude of the range of values, with the larger range at the top. Using the tornado diagram, decision makers can quickly identify the assumptions that have the greatest impact on the budget impact model, as well as the expected range in costs (or savings) that will be realized by the drug plan if the new drug is added to the formulary.
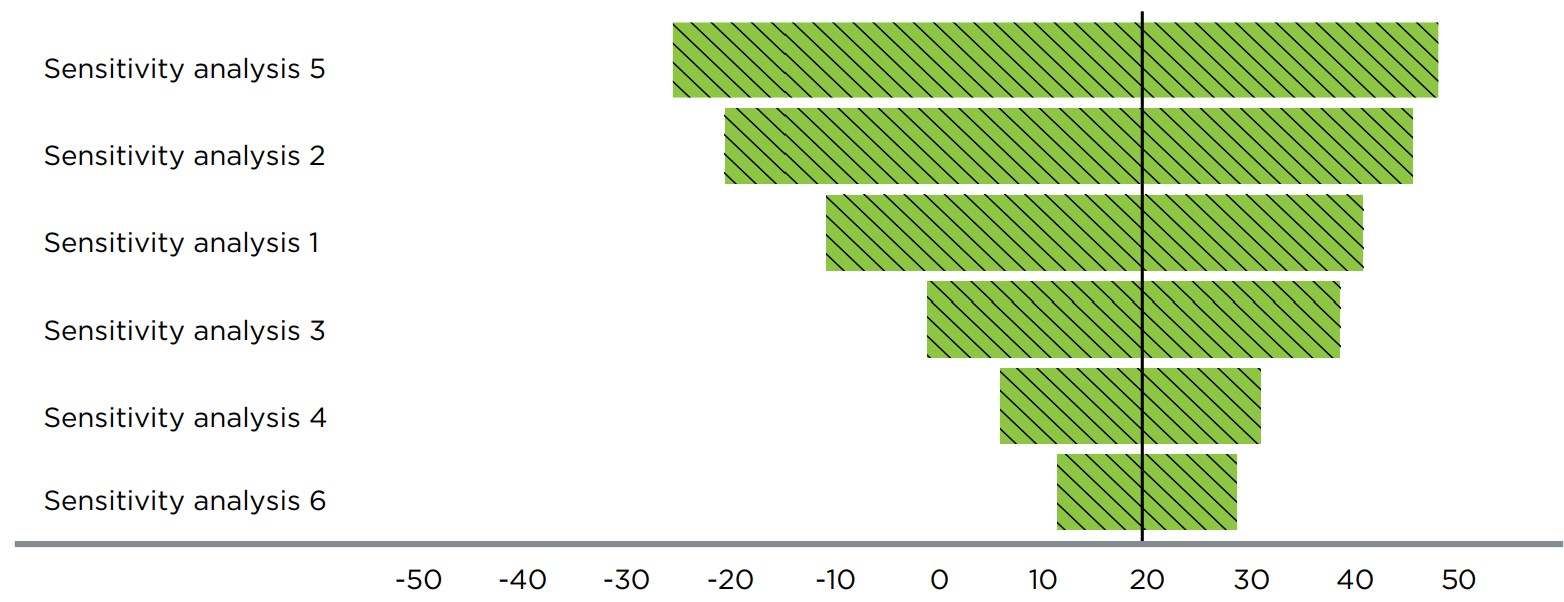
Figure description
A sample tornado diagram is provided to illustrate the ideal presentation of the results of sensitivity analyses within a budget impact analysis.
10.0 List of Terms and Abbreviations
Active beneficiary |
An eligible beneficiary who files a claim |
BIA |
Budget impact analysis |
CADTH |
Canadian Agency for Drugs and Technologies in Health |
CDR |
Common Drug Review |
CEA |
Cost-effectiveness analysis |
Compliance |
The degree or extent to which a patient adheres to a prescribed interval and dose of a dosing regimen |
Discount rate |
The amount by which future costs and benefits are adjusted to enable the comparison of different years with each other and with current costs and benefits |
Drug |
An active substance considered to be a drug under the Canadian Food and Drugs Act and Regulations that is sold for human use |
Drug cost |
Drug costs include reimbursed drug prices, as well as wholesaler markups, pharmacy markups, and dispensing fees; this definition may vary by jurisdiction. |
Eligible beneficiary |
A person who is eligible for coverage by a given drug plan |
Ex-factory price |
The price charged by the manufacturer for a particular drug |
Expected reimbursement price |
The list price of the drug excluding any rebates |
Formulary |
A list of drugs that are covered by each drug plan |
FPT |
Federal, provincial, and/or territorial |
Inflation rate |
The average change in the price of goods and services over a period of time |
ISPOR |
International Society for Pharmacoeconomics and Outcomes Research |
NPDUIS |
National Prescription Drug Utilization Information System |
pCODR |
pan-Canadian Oncology Drug Review |
pCPA |
pan-Canadian Pharmaceutical Alliance |
Persistence |
The duration of time from initiation to discontinuation of therapy |
PMPRB |
Patented Medicine Prices Review Board |
PSA |
Probabilistic sensitivity analysis |
Treatment strategy |
One or more active substances used in combination for the treatment of a medical condition |
Appendix A: Summary of Reviewed BIA Guidelines
| Country | Financing system | Year | Organization | Title |
|---|---|---|---|---|
Ireland |
Publicly-funded Health and Social Care System (HSE) |
2018 |
The Health Information and Quality Authority |
Guidelines for the Budget Impact Analysis of Health Technologies in Ireland 2018 |
France |
French Statutory Social Insurance Scheme |
2017 |
French National Authority for Health (HAS) |
The French National Authority for Health (HAS) guidelines for conducting Budget Impact Analyses (BIA) |
United Kingdom (UK) |
National Health System (NHS) |
2017 |
National Institute for Health and Care Excellence (NICE) |
Proposals for changes to the arrangements for evaluating and funding drugs and other health technologies appraised through NICE’s technology appraisal and highly specialized technologies programs (resource impact assessment) |
Australia |
Pharmaceutical Benefits Scheme (PBS) |
2016 |
Pharmaceutical Benefits Advisory Committee (PBAC) |
Guidelines for preparing a submission to the Pharmaceutical Benefits Advisory Committee (Version 5.0) |
Poland |
National Health Funds (NHF) |
2016 |
The Agency for Health Technology Assessment and Tariff System (AOTMiT) |
HTA guidelines |
Belgium |
Federal government; communities; patients |
2015 |
Belgian Health Care Knowledge Centre (KCE) |
Guidelines for Budget Impact Analyses |
ISPOR |
NA |
2014 |
International Society for Pharmacoeconomics and Outcomes Research |
ISPOR taskforce report: Budget Impact Analysis—Principles of good practice: Report of the ISPOR 2012 Budget Impact Analysis good practice II task force |
Canada |
Federal, provincial, and territorial drug plans; private payers; patients |
2007 |
Patented Medicine Prices Review Board (PMPRB) |
Guidelines for conducting pharmaceutical Budget Impact Analyses for submission to public drug plans in Canada |
| Canadian BIA guidelines | Year | Template or guidelines |
|---|---|---|
Canadian Agency for Drugs and Technologies in Health (CADTH) |
2020 |
pan-Canadian Oncology Drug Review Submission and Common Drug Review guidelines |
Alberta (Prescription Drug Programs) |
2018 |
Budget Impact Assessment for the Alberta Drug Benefit List (Version 9, updated: May 2018) |
Quebec (Prescription Drug Insurance) |
2018 |
Guidance document for submitting a request to INESSS (Updated: 2018) |
Manitoba (Drug Benefits and Interchangeability Formulary) |
2017 |
Budget Impact Analysis for the Manitoba Health, Seniors and Active Living (Updated: April 2017) |
Ontario (Drug Benefit Program) |
2016 |
ODB financial impact estimates (2016) |
Appendix B: Summary of Changes to the PMPRB BIA Guidelines
This table details the changes made to the previous version of the PMPRB BIA Guidelines published in May 2007.
| Section | Change | New/Modified |
|---|---|---|
| Analytical Framework | ||
Perspective |
Explained that costs associated with a broader healthcare system perspective and non-healthcare related costs are generally excluded from BIAs; however, they can be included as a complementary analysis or acknowledged in the text of the BIA if they are deemed to have a significant potential impact on the budget. In some exceptional cases, healthcare system related costs may be included in the base-case analysis. |
Modified |
Time Horizon |
A time horizon consisting of a one-year baseline period and a three-year forecast period is still recommended as a general rule, but with the added flexibility to include additional years if applicable. |
Modified |
Population |
An open population should be used in the target population assessment when applicable (e.g., the rate of mortality and disease progression should be considered in BIA). |
New |
An equal status was given to population-based and claims data-based approaches, with the preferred approach to be determined based on the available data and market specifics. In addition, clearer guidance was provided on how to select the best approach. |
Modified |
|
It was noted that market growth in the claims data-based approach should be based on the forecasted growth of both claims and claimants, when data on the unique number of claimants is available. |
Modified |
|
Scenarios to be compared |
Added text indicating that evolving indications should be considered in the BIA report. |
New |
Drug Costs |
Added text indicating that the cost of companion diagnostic tests or medical devices that are covered by the drug plan should be reported in the BIA. |
New |
Explained that the BIA should address the impact of compliance and persistence with therapy on the cost of treatments if it is required by the drug plan. |
New |
|
Added some flexibility to the guidance on premiums and deductibles: although they are typically not factored into the calculation of costs, they should be considered if required by the drug plan (e.g., for income-based plans with universal coverage). |
Modified |
|
Characterizing Uncertainty |
Additional information on scenario analysis was provided to inform decision makers of the sensitivity of the model structure to specific assumptions. |
Modified |
It was determined that although a PSA may be a worthwhile exploratory analysis, it is not a required component for a BIA submission because much of the parameter uncertainty of BIAs cannot be meaningfully quantified. |
Modified |
|
Emphasized that citable information regarding the range of uncertainty associated with each assumption should be provided. |
Modified |
|
| Input and Data Source Recommendations for BIA | ||
Selecting Relevant Comparators |
The criteria used to select appropriate comparators was expanded to encourage consistency with the health economic evaluation (e.g., cost-effectiveness study) unless there is a clear justification for not doing so. |
Modified |
More clarity was added to the approach for the considering relevant comparators:
|
Modified |
|
|
New |
|
Estimating Therapeutic Equivalencies |
Drug wastage and sharing of units should already be accounted for in the drug cost and do not require additional adjustments. If required, these can be addressed in a scenario analysis. |
Modified |
Restricted access |
Claims-based models should consider any listing restrictions for the new drug, as well as for its competitors. |
Modified |
General |
It was emphasized that internal manufacturer projections without validation and citable documentation cannot be considered as a reliable source of data. |
Modified |
| Reporting | ||
Report content |
Noted that aggregated and disaggregated budget impact results should be reported for each year. |
Modified |
| Other changes | ||
BIA Model |
The Excel model template was streamlined and updated. |
Modified |
Revisions and Reorganization |
General revisions:
|
Modified |
Appendix C: BIA Completion Checklist
Upon completion of the BIA, this Checklist should be completed and signed.
❏ Data specific to each drug plan is used.
❏ Disease prevalence information specific to the drug plan is provided.
❏ Justification is provided when data specific to the drug plan has not been used.
❏ Forecasts are for at least a 3-year time horizon.
❏ All relevant comparators are stated, including non-drug alternatives.
❏ All approved indications are listed, with recommended dosages and durations.
❏ Only relevant pharmacological comparators are used for forecasting purposes in the base-case analysis.
❏ Total treatment strategy cost / patient / year (or total treatment strategy cost / claim(s) / year) is calculated, for each indication, accounting for drug wastage, based on the recommended dose and using current pricing adjustment information for BIAs (i.e., markups, dispensing fees, and patient co-payments).
❏ Projected market share is reported as total number of patients (or claims) and percentage of the total market.
❏ Market share is forecasted for 12 months from proposed listing date.
❏ Sources of market share, and proportion of market share from each source, are reported.
❏ Total drug costs are reported for each drug plan.
❏ Lowest cost alternative is used, where applicable.
❏ Projections are calculated using stated prevalence, market share, and prescription costs.
❏ All assumptions are listed and references cited.
❏ Net budget impact is reported for the drug plans.
❏ All assumptions are listed and references cited.
❏ Deterministic sensitivity and scenario analyses (if applicable) are conducted, including but not limited to:
❏ Changes in the size of the market over the time horizon (e.g., subgroups, expanded indications).
❏ Market share distribution among the new drug and its comparators.
❏ Price of the new drug, and the price of any comparators and/or treatment strategy for which uncertainty exists.
❏ An explanation of the sensitivity/scenario analysis methods is included.
❏ All assumptions are listed and references cited.
❏ The conclusions of the BIA are clearly stated.
❏ Budget impact model is included with submission.
Optional
❏ Additional relevant information may be attached (optional):
❏ Utilization from other jurisdictions.
❏ Treatment or dosage guidelines.
❏ Comments on whether listing will significantly affect healthcare spending.
❏ Additional BIAs appended that do not conform to this format (if applicable).
Signature:
Date: