
Prairies Economic Development Canada’s Quarterly Financial Report for the quarter ended December 31, 2021
View the print-friendly version: PDF
Statement Outlining Results, Risks and Significant Changes in Operations, Personnel and Programs
Introduction
This quarterly financial report should be read in conjunction with the Main Estimates, Supplementary Estimates (A), and Supplementary Estimates (B). It has been prepared by management as required by section 65.1 of the Financial Administration Act (FAA) and in the form and manner prescribed by the Treasury Board. This quarterly report has not been subject to an external audit or review.
Authority, Mandate and Program Activities
On August 6, 2021, the Government of Canada re-branded Western Economic Diversification Canada (WD) as Prairies Economic Development Canada (PrairiesCan), the regional economic development agency for businesses and communities in Alberta, Saskatchewan and Manitoba.
PrairiesCan operates under the provision of the Western Economic Diversification Act, which came into force on June 28, 1988. As a federal department, PrairiesCan is headed by a Minister and a Deputy Head (Deputy Minister).
PrairiesCan is mandated to “promote the development and diversification of the economy of the prairie provinces of Canada and to advance the interests of the region in national economic policy, program and project development and implementation.”
The Departmental Plan and Main Estimates provide further information on PrairiesCan’s authority, mandate and program activities.
Basis of Presentation
This quarterly report has been prepared by management using an expenditure basis of accounting. The accompanying Statement of Authorities includes the department’s spending authorities granted by Parliament and those used by the department, consistent with the Main Estimates, Supplementary Estimates (A), and Supplementary Estimates (B) for the 2021-2022 fiscal year. This quarterly report has been prepared using a special purpose financial reporting framework designed to meet financial information needs with respect to the use of spending authorities.
The authority of Parliament is required before money can be spent by the Government. Approvals are given in the form of annually approved limits through appropriation acts, or through legislation in the form of statutory spending authority for specific purposes.
The Department uses the full accrual method of accounting to prepare and present its annual departmental financial statements that are part of the departmental results reporting process. However, the spending authorities voted by Parliament remain on an expenditure basis.
Financial Structure
PrairiesCan manages its expenditures under two votes:
- Vote 1 – Net operating expenditures include salary, and other operating costs (e.g., transportation and communications; professional and special services).
- Vote 5 – Grants and contributions include all transfer payments.
Budgetary statutory authorities represent payments made under legislation approved by Parliament, and include:
- Authorization received from the Minister of Health and Minister of Finance to issue transfer payments pursuant to the Public Health Events of National Concern Payments Act.
- Government of Canada’s share of employee benefit plans and other minor items.
Highlights of Fiscal Quarter and Fiscal Year-to-Date (YTD) Results
The following section highlights significant changes to fiscal quarter results as of December 31, 2021.
Statement of Authorities: Vote 1 – Net Operating Expenditures
Total authorities available for use for fiscal year 2021-2022 are $50.2 million, a net decrease of $1.9 million, or -4%, compared to the $52.1 million for 2020-2021. The net decrease is explained by:
- $1.2 million increase in funding for the Air Sector Economic Recovery Strategy;
- $0.7 million increase in the operating budget carry forward;
- $3.4 million decrease in funding to provide support to businesses and tourism operators facing hardship due to COVID-19 through the Regional Recovery and Relief Fund;
- $0.4 million decrease from reduction in Budget 2019: Launching a Federal Strategy on Jobs and Tourism.
Total authorities used has increased to $33.5 million for the quarter ended December 31, 2021, compared to $32.1 million at December 31, 2020. The increase of $1.4 million, or 4%, is explained mainly by salary increases to deliver recovery initiatives under the Regional Relief and Recovery Fund, to provide staffing for new transfer payment programming and for restructuring Western Economic Diversification Canada (WD) to the Pacific and Prairies Economic Development Agencies as announced in Budget 2021.
Graph 1 illustrates total authorities available for use for the fiscal year, and authorities used at quarter-end.
(in thousands of dollars)

Text version: Total Available for Use and Used for Vote 1 (in thousands of dollars)
This bar graph breaks down total authorities available for use for fiscal year 2021-22 and the authorities used at quarter end and then compares them to fiscal year 2020-21.
2021-2022
- $50,240 represents total available for use for the year ending March 31
- $33,553 represents total authorities used for the quarter ending December 31
2020-2021
- $52,101 represents total available for use for the year ending March 31
- $32,133 represents total authorities used for the quarter ending December 31
Statement of Authorities: Vote 5 – Grants and Contributions
Total authorities available for use for fiscal year 2021-2022 are $421.6 million, a net increase of $74.4 million, or 21%, compared to the $347.2 million for 2020-21. The net increase is explained by:
- $148.3 million net increase in funding to provide support to businesses and tourism operators facing hardship due to COVID-19 through the Regional Recovery and Relief Fund;
- $53.0 million net increase to support Canada’s air sector through the Air Sector Economic Recovery Strategy;
- $10.4 million net increase in funding for national medical science, research and development initiatives;
- $2.5 million increase in funding to support the black entrepreneurs;
- $0.1 million net increase from other minor various adjustments;
- $113.0 million decrease for the transfer of deemed appropriations from WD to Pacific Economic Development Agency of Canada (PacifiCan);
- $10.0 million decrease in repayable collections;
- $9.0 million net decrease in funding for the conclusion of the Canadian Experiences Fund;
- $5.0 million net decrease in funding for the WES Ecosystem Top Up Funding;
- $1.5 million net decrease for the conclusion of support for Greyhound bus service disruptions; and
- $1.4 million net decrease to fund the Canada Coal Transition Initiative.
Total authorities used for the quarter-ended December 31, 2021 increased to $228.3 million, compared to $106.3 million at December 31, 2020. The $122.0 million increase, or
115%, is explained by:
- $132.5 million increase in Regional Relief and Recovery Fund transfer payments, aiming to help western Canadian businesses cope with the financial hardship resulting from COVID-19;
- $1.3 million increase in payments for the Black Entrepreneurship Program;
- $0.9 million increase in Regional Economic Growth through Innovation payments to deliver the Innovation and Skills Plan;
- $0.3 million increase in payments supporting the Canada Coal Transition Initiative;
- $6.0 million decrease for payments restoring rail service to Churchill, Manitoba;
- $5.7 million decrease for payment timing differences made to network partners; and
- $1.3 million decrease in Western Diversification Program payments, investing in a diverse and growing economy.
Graph 2 illustrates total authorities available for use for the fiscal year, and authorities used at quarter-end.
(in thousands of dollars)
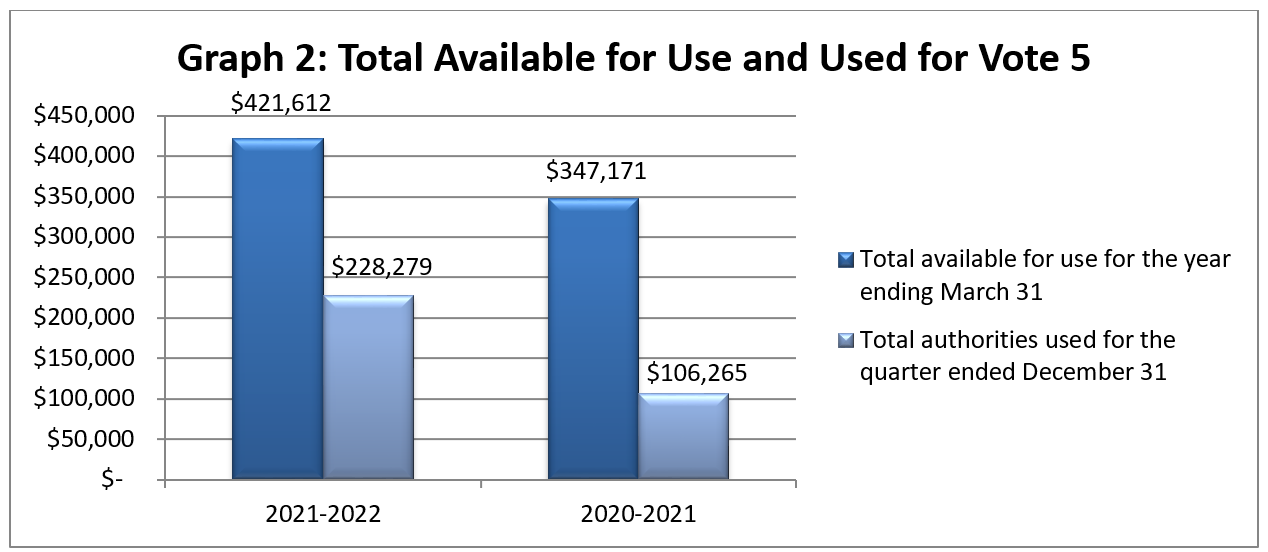
Text version: Total Available for Use and Used for Vote 5 (in thousands of dollars)
This bar graph breaks down total authorities available for use for fiscal year 2021-22 and the authorities used at quarter end and then compares them to fiscal year 2020-21.
2021-2022
- $421,612 represents total available for use for the year ending March 31
- $228,279 represents total authorities used for the quarter ending December 31
2020-2021
- $347,171 represents total available for use for the year ending March 31
- $106,265 represents total authorities used for the quarter ending December 31
Statement of Authorities: Budgetary Statutory Authorities
Budgetary statutory authorities available for use for fiscal year 2021-2022 are $6.8 million, a decrease of $504.8 million when compared to the $511.6 million in 2020-2021. The decrease is a result of statutory authorities pursuant to the Public Health Events of National Concern Payments Act received in early 2020-2021 to support businesses and network partners through the COVID-19 pandemic that the department received as Vote 1 and 5 amounts in 2021-2022.
Total authorities used for the quarter-ended December 31, 2021 decreased to $3.2 million, compared to $475.8 million at December 31, 2020. The $472.6 million decrease is explained by transfer payments delivery for payments made under the Public Health Events of National Concern Payments Act in 2020-2021.
Graph 3 illustrates total authorities available for use for the fiscal year, and authorities used at quarter-end.
(in thousands of dollars)
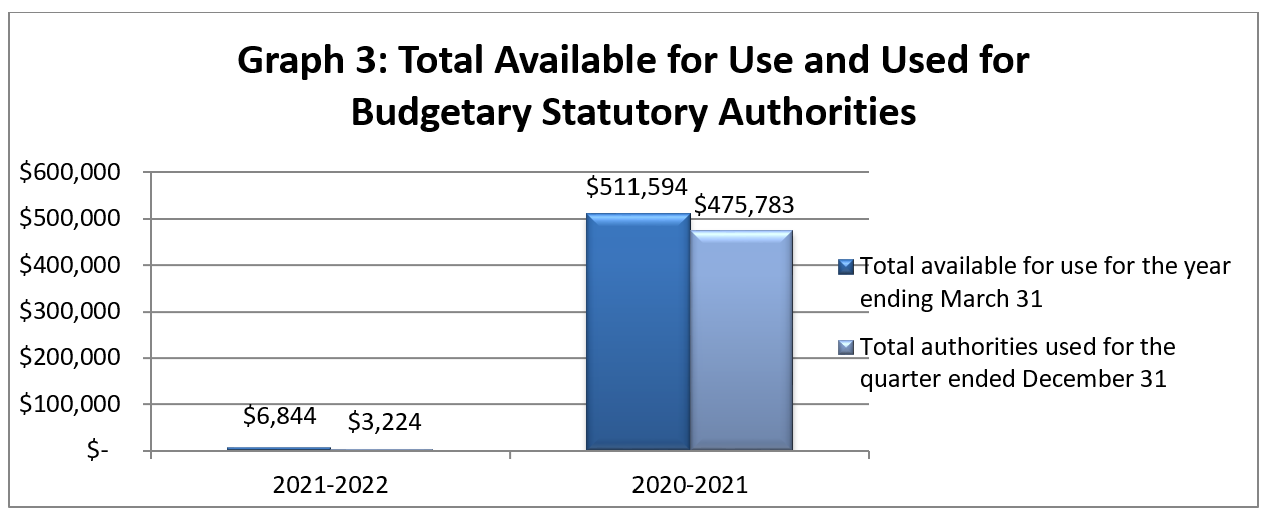
Text version: Total Available for Use and Used for Budgetary Statutory Authorities (in thousands of dollars)
This bar graph breaks down total authorities available for use for fiscal year 2021-22 and the authorities used at quarter end and then compares them to fiscal year 2020-21.
2021-2022- $6,844 represents total available for use for the year ending March 31
- $3,224 represents year-to-date authorities used for the quarter ending December 30
2020-2021
- $511,594 represents total available for use for the year ending March 31
- $475,783 represents year-to-date authorities used for the quarter ending December 30
Statement of the Departmental Budgetary Expenditures by Standard Object
Expenditures by standard object for the quarter ended December 31, 2021, were $53.8 million, which reflects a decrease of $219.1 million, or -80%, from the $272.9 million at December 31, 2020.
The variance is largely due to:
- $2.9 million increase in Regional Economic Growth through Innovation payments to deliver the Innovation and Skills Plan;
- $0.7 million increase in payments for the Black Entrepreneurship Program;
- $206.4 million decrease in Regional Relief and Recovery Fund transfer payments, aiming to help western Canadian businesses cope with the financial hardship resulting from COVID-19;
- $9.7 million net decrease for payment timing differences made to network partners;
- $2.6 million decrease for payments restoring rail service to Churchill, Manitoba;
- $2.5 million decrease in Western Diversification Program payments, investing in a diverse and growing economy;
- $0.8 million decrease in payments supporting the Canada Coal Transition Initiative; and
- $0.7 million decrease in salary and other personnel costs.
Additional information can be found in the Statement of Authorities, Vote 1 and Vote 5 sections above.
Graphs 4 and 5 illustrate actual expenditures for the quarter’s end.
(in thousands of dollars)
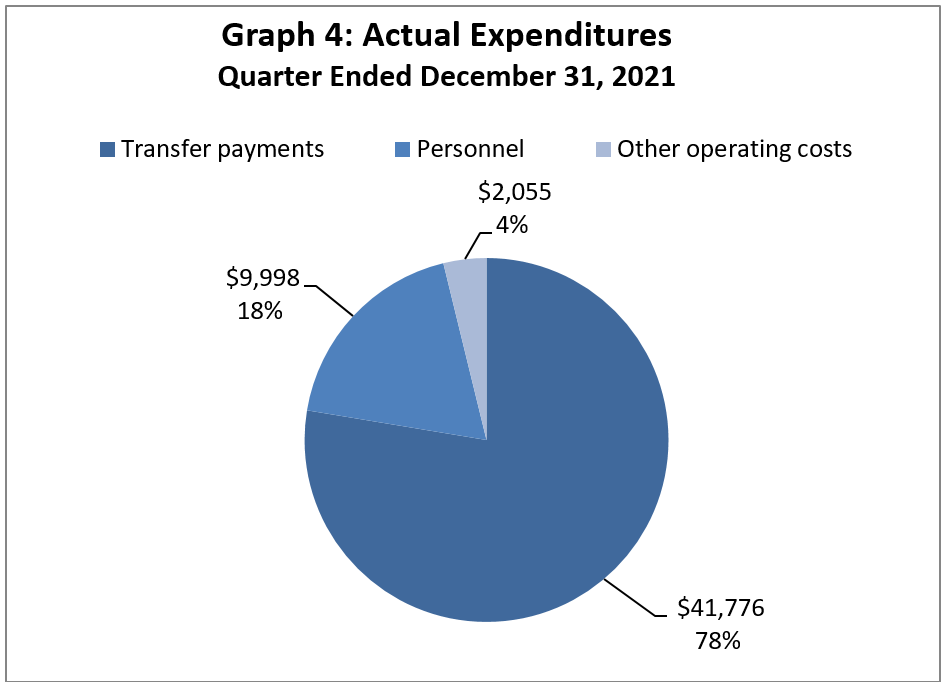
Text version: Actual Expenditures Quarter Ended December 31, 2021 (in thousands of dollars)
This pie chart breaks down actual expenditures for the quarter ended December 31, 2021.
- $41,776 represents actual spending on Transfer Payments, which accounts for 78% of Actual Expenditures quarter ended December 31, 2021
- $9,998 represents actual spending on Personnel, which accounts for 18% of Actual Expenditures quarter ended December 31, 2021
- $2,055 represents actual spending on Other operating costs, which accounts for 4% of Actual Expenditures quarter ended December 31, 2021
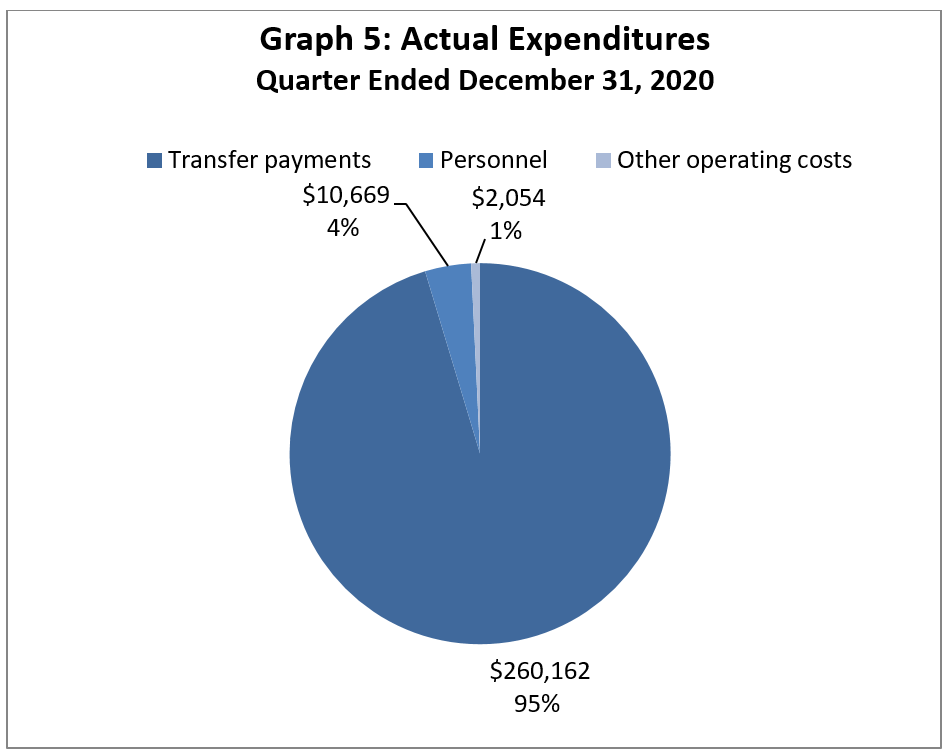
Text version: Actual Expenditures Quarter Ended December 31, 2020 (in thousands of dollars)
This pie chart breaks down actual expenditures for quarter ended December 30, 2020.
- $260,162 represents actual spending on Transfer Payments, which accounts for 95% of Actual Expenditures quarter ended December 30, 2020
- $10,669 represents actual spending on Personnel, which accounts for 4% of Actual Expenditures quarter December 30, 2020
- $2,054 represents actual spending on Other operating costs, which accounts for 1% of Actual Expenditures quarter ended December 30, 2020
Risks and Uncertainties
The department is managing the allocation of resources within a well-defined framework of accountabilities, policies and procedures including a system of budgets, reporting and other internal controls to manage within available resources and Parliamentary authorities.
PrairiesCan conducts an annual risk assessment exercise as part of its overall risk management approach. Prior to the COVID 19 pandemic, WD (now PrairiesCan) did not identify any significant financial risks from their annual risk assessment.
In response to the COVID-19 pandemic, WD (now PrairiesCan) had identified increased enterprise-wide risks including risks to employee physical and mental health, cyber risk, and risks due to the speed of program delivery to get funding to Canadians economically affected by COVID-19 in a timely manner. PrairiesCan employs risk-based mitigation such as business continuity planning, occupational health and safety planning and people management strategies; a robust system of network systems including encrypted signature, electronic security protocols and mobile equipment to employ remote connectivity; and risk assessments, governance processes, process mapping and segregation of duties when implementing programs.
Significant Changes in Relation to Operations, Personnel and Programs
Budget 2021 established a new agency for British Columbia to play an enhanced role as convener, pathfinder, partner, investor, and advisor to support economic development in more communities and help develop businesses to create good jobs that people can rely on. Growing Western Economic Diversification Canada into two new separate agencies focused on British Columbia and the Prairies recognized that economic drivers and conditions are different in each of the two regions, and entrepreneurs, innovators, institutions, and communities have unique needs linked to where they are located.
The new BC-focused agency will receive $553.1 million in funding over five years starting in 2021-22, and $110.6 million ongoing, while existing core program funding from Western Economic Diversification Canada, now styled as Prairies Economic Development Canada will remain to support the Prairies. This increases investments available for businesses, institutions, organizations, and communities in Alberta, Saskatchewan, and Manitoba, and represents an increase of approximately 70 percent in permanent regional development agency funding in the West.
On August 6, 2021, the Government of Canada created Pacific Economic Development Agency of Canada (PacifiCan) as the new federal regional economic development agency for British Columbia. Western Economic Diversification Canada (WD) was also re-branded as Prairies Economic Development Canada (PrairiesCan), the regional economic development agency for businesses and communities in Alberta, Saskatchewan and Manitoba.
On October 26, 2021 Dan Vandal was announced as Minister of Northern Affairs, Minister responsible for Prairies Economic Development Canada and Minister responsible for the Canadian Northern Economic Development Agency.
Dylan Jones was appointed as PrairiesCan interim deputy head effective August 6, 2021.
Approval by Senior Officials
Approved by:
Original signed by:
________________________
Dylan Jones
Interim Deputy Minister
Edmonton, Canada
Date: February 16, 2022
Original signed by:
________________________
Sundeep Cheema
Chief Financial Officer
Statement of Authorities (unaudited)
Fiscal year 2021-2022 (in thousands of dollars)
| Authorities | Total available for use for the year ending March 31, 2022* | Used during the quarter ended December 31, 2021 | Year-to-date used at quarter-end |
|---|---|---|---|
| Vote 1 - Net operating expenditures | $50,240 | $11,064 | $33,553 |
| Vote 5 - Grants and contributions | 421,612 | 41,776 | 228,279 |
| Budgetary statutory authorities: Employee benefit plans |
6,844 | 989 | 3,221 |
| Budgetary statutory authorities: Collection Agency Fees |
0 | 0 | 3 |
| Total authorities | $478,696 | $53,829 | $265,056 |
Fiscal year 2020-2021 (in thousands of dollars)
| Authorities | Total available for use for the year ending March 31, 2021* | Used during the quarter ended December 31, 2020 | Year-to-date used at quarter-end |
|---|---|---|---|
| Vote 1 - Net operating expenditures | $52,101 | $11,594 | $32,133 |
| Vote 5 - Grants and contributions | 347,171 | 45,677 | 106,265 |
| Budgetary statutory authorities: Employee benefit plans |
5,421 | 1,129 | 3,388 |
| Budgetary statutory authorities: Transfer payments |
506,173 | 214,485 | 472,395 |
| Total authorities | $910,866 | $272,885 | $614,181 |
* Includes only Authorities available for use and granted by Parliament at quarter-end.
Departmental Budgetary Expenditures by Standard Object (unaudited)
Fiscal Year 2021-2022 (in thousands of dollars)
| Expenditures | Planned expenditures for the year ending March 31, 2022* | Expended during the quarter ended December 31, 2021 | Year-to-date used at quarter-end |
|---|---|---|---|
| Personnel | $42,181 | $9,998 | $31,428 |
| Transportation and communications | 1,014 | 105 | 130 |
| Information | 960 | 216 | 288 |
| Professional and special services | 8,453 | 1,292 | 3,588 |
| Rentals | 1,305 | 208 | 503 |
| Repair and maintenance | 936 | 0 | 0 |
| Utilities, materials and supplies | 518 | 24 | 64 |
|
Acquisition of machinery and equipment |
1,717 | 246 | 591 |
| Transfer payments | 421,612 | 41,776 | 228,279 |
| Other subsidies and payments | 0 | (36) | 185 |
| Total net budgetary expenditures | $478,696 | $53,829 | $265,056 |
Departmental Budgetary Expenditures by Standard Object (unaudited)
Fiscal Year 2020-2021 (in thousands of dollars)
| Expenditures | Planned expenditures for the year ending March 31, 2021* | Expended during the quarter ended December 31, 2020 | Year-to-date used at quarter-end |
|---|---|---|---|
| Personnel | $39,955 | $10,669 | $30,377 |
| Transportation and communications | 3,504 | 14 | 39 |
| Information | 739 | 50 | 163 |
| Professional and special services | 8,949 | 1,570 | 4,117 |
| Rentals | 1,283 | 36 | 238 |
| Repair and maintenance | 1,107 | 1 | 22 |
| Utilities, materials and supplies | 357 | 23 | 36 |
|
Acquisition of machinery and equipment |
1,628 | 429 | 450 |
| Transfer payments | 853,344 | 260,162 | 578,660 |
| Other subsidies and payments | 0 | (69) | 79 |
| Total net budgetary expenditures | $910,866 | $272,885 | $614,181 |
* Includes only Authorities available for use and granted by Parliament at quarter-end.