ARCHIVED: Chapter 9: Young people in Canada: their health and well-being – Injuries
Injuries are one of the most important health problems that youth face during their school-aged years. They are the leading cause of death among young people (Institute of Medicine Committee on Injury Prevention and Control, 1999), and approximately one hospitalization in six experienced by young people can be attributed to an injury (Lescohier and Scavo-Gallagher, 1996). Non-fatal injuries occur at least 1,000 times more often than fatal injuries (Lescohier and Scavo-Gallagher, 1996), and their impacts in terms of treatment, rehabilitation, and ongoing disability are of huge importance (Rivara, Grossman, and Cummings, 1987).
Various strategies have been developed to prevent injuries to youth, including those aimed at reducing risk-taking and promoting safety-oriented behaviours. Multi-faceted bicycle helmet campaigns that combine regulation with educational efforts provide good examples of such strategies (Henderson, 1995; Irvine, Rowe, and Sahai, 2002). Other ongoing strategies include: enforcement of rules and regulations around motor vehicle use, such as seat belt campaigns and RIDE programs aimed at drinking and driving (Grossman and Garcia, 1999; Evans et al., 2001); and engineering strategies that involve making youth environments as safe as possible, such as playground equipment standards (Canadian Standards Association, 1990). While all of these strategies can be effective in practice, basic information about the nature of youth injury problems assists in the planning and evaluation of the effects of interventions.
Injuries to young people should not be viewed as "accidents." They are both predictable and preventable. By examining circumstances associated with injury events that happen over and over again, their predictability can be demonstrated and potential opportunities to intervene can be identified. This chapter shows that some young people are more at risk for injury than others. It also profiles certain factors that are common to injury events. All of this information can contribute to the development of effective injury prevention programs. However, this chapter does not examine trends in the occurrence of injuries from previous surveys, because the 2002 survey was conducted during a different season than previous HBSC surveys. Injury patterns change with the seasons; hence an analysis of such temporal trends would be misleading.
Magnitude of the Youth Injury Problem
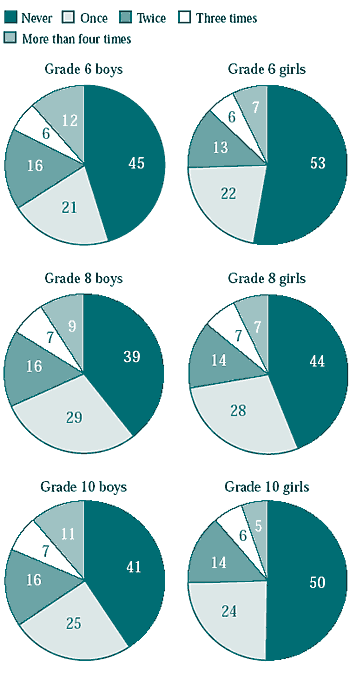
Injuries represent a common health problem among young people in Canada. The 2002 HBSC survey asked about all injuries requiring medical attention during the previous 12 months and collected detailed descriptions about the most serious of these injuries. This allowed the profiling of these most serious injuries by a variety of factors that contributed to their occurrence. They included personal characteristics of the young people involved, as well as recurrent external causes and consequences of injury. In general, 47 to 60 percent of young Canadians surveyed in 2002 experienced at least one injury that required medical treatment. This was higher than the 30 to 44 percent who reported injuries from past Canadian surveys (King, Boyce, and King, 1999). Although variations in incidence were not strong between groups, boys consistently reported more injuries than did girls (59 percent versus 50 percent overall) and the incidence of injuries peaked in Grade 8 (58 percent). In addition, most victims of injury (54 percent) reported more than one injury event.
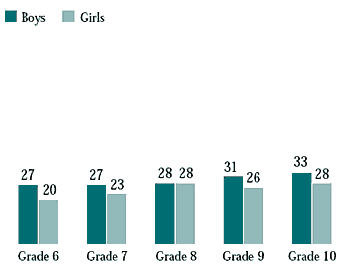
Another way of examining the magnitude of the Canadian youth injury problem is by examining lost time attributable to injuries. Figure 9.2 indicates that up to one-third of the students surveyed experienced one or more injuries that were severe enough to keep them from school or other usual activities for at least a day. Applied to the entire population, these rates of lost time represent an enormous burden to Canadian society. Huge numbers of children are missing opportunities to learn and develop. Injuries are also affecting the lives of parents and other family members who need to seek emergency medical care on behalf of the children, as well as to provide time and care in some circumstances during various stages of rehabilitation.
Figure 9.2
Students who said they missed one or more days of school or other usual activities due to injury in the past year (%)
Activities Associated With the Occurrence of Injuries
Figures 9.3 to 9.5 show the diversity of activities that were associated with injuries for students in Grades 6, 8, and 10. They also demonstrate the clear importance of sports and sport injuries in the lives of young Canadians (58 percent of all serious injuries reported). Sports are a major cause of injury in all grades and in both genders. Figure 9.6 also shows that from Grades 6 to 10, the percentage of injuries that happened during organized activities tended to increase. Although this figure represents activities associated with the full spectrum of injuries, a large percentage of these involved sports activities. This reflects the increase of injuries associated with organized sports as youth make the transition from the elementary to high school years. It perhaps also reflects the increased level of organized activities in young people's lives in general.

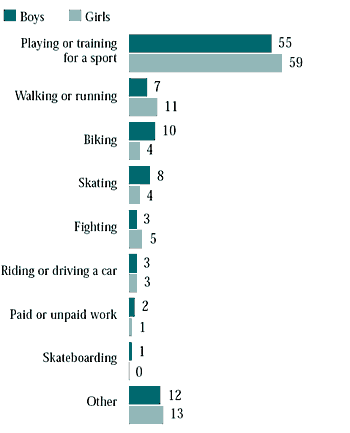
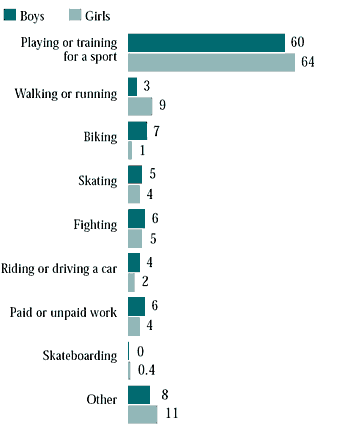
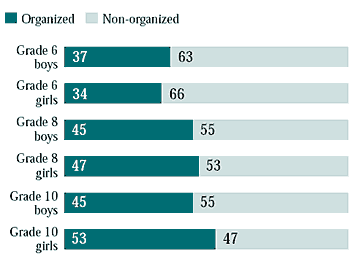
Students were asked to identify the sports that resulted in their injury and whether the injury happened within an organized or non-organized activity. Most injuries (50 percent) occurred in organized team sports, followed by non-organized individual sports activities (18 percent). Canadian sports that most often lead to serious injury include team contact sports such as hockey and football, team non-contact sports such as basketball, soccer, and baseball, and individual sports such as cycling and gymnastics (data not shown).
Other activities are also responsible for important numbers of injuries. While injuries caused by physical fights were relatively uncommon (2 to 5 percent), violence can have a lasting impact on various aspects of health that goes beyond the violent encounter and associated physical injury. Motor vehicle transport injuries, while again relatively uncommon (1 to 4 percent), have great significance for young people in general. Motor vehicle crashes are the leading cause of death and major trauma to school-aged children in Canada (Health Canada, 1999).
Locations of Injury
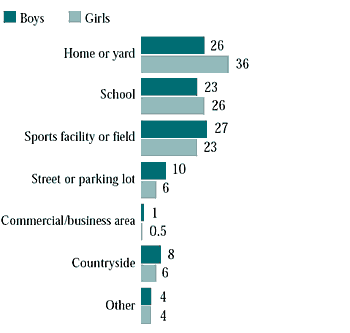
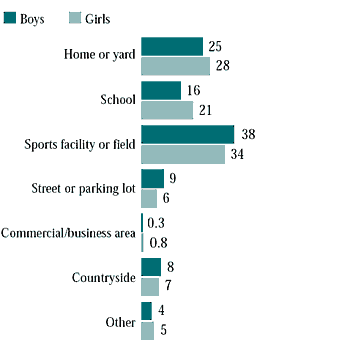
In developing injury prevention programs, it is helpful to understand where injuries most commonly occur. Location can suggest the people and agencies responsible for the environments in which these injuries are happening. Figures 9.7 to 9.9 show that the vast majority of injuries to young people happened at sports facilities (30 percent), home (24 percent), or in school environments (20 percent). The frequency of home injuries fell between Grades 6 and 10, while injuries at sports facilities rose. This reflects the predominance of sports-related injuries in high school youth. The majority of organized sports injuries occur at dedicated sports facilities such as arenas, gymnasiums, and playing fields. Most unorganized sports injuries occur either at homes/yards or in school facilities.

When Do Injuries Happen?
Students were asked to document the month when their most serious injury occurred (Figure 9.10). Past versions of this survey showed that injuries were most likely to occur in spring and fall (King et al., 1999), when organized sporting activities intensify, especially those that involve physical contact. Summer injury peaks were also observed in association with warm-weather activities.
Figure 9.10
Month when most serious injury occurred, all grades (%)

The 2002 survey was conducted mainly in the winter and early spring, unlike previous HBSC surveys, which were done during the fall and early winter of the school year. In the current survey, a pronounced injury peak was observed in the late winter and early spring. In 1998, two injury peaks were observed in summer and fall months. It is clear that the timing of the current survey affected students' reporting of their one most serious injury. Students tended to report "most serious" injuries as those that were nearest in time to when the survey was conducted.
Physical Damage Caused by Injury
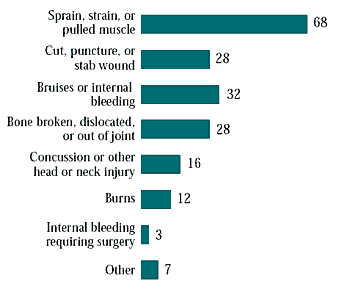
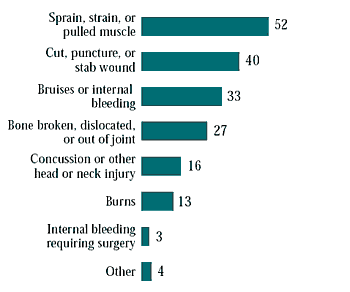
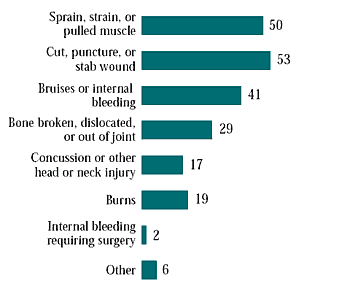
The types of physical injury varied only slightly according to the activities young people were involved in at the time of injury (Figures 9.11 to 9.13). Sprains, strains, and pulled muscles were the leading types of physical injuries (56 percent). The proportion of injuries that resulted in fractures or dislocations to bones was fairly consistent across activities. Other leading types of physical damage included soft-tissue injuries such as lacerations and bruises, minor head injuries, and burns. These patterns are useful in highlighting recurrent types of injury that can inform the content of first aid and other training programs aimed at the initial medical management of injury events.
Patterns of Injury Treatment
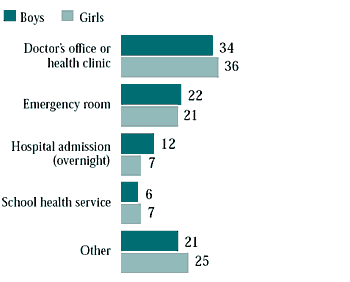
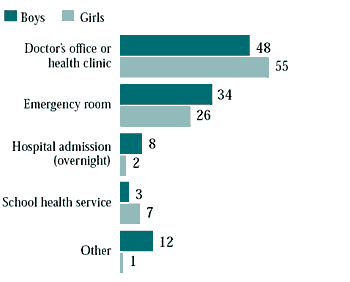
Figures 9.14 to 9.16 show where students receive medical treatment for their injuries, by grade and gender. Treatment patterns were quite consistent by gender but varied somewhat between grades. The frequency of youth seeking injury treatment from doctors' offices or health clinics rose in the higher grades. Similarly, emergency room treatment was highest in Grade 10. The opposite trend was observed for hospital admissions. Overnight hospital stays were highest in Grade 6 for both genders, although young boys tended to be admitted more often than girls. This likely reflects the fact that on average, the injuries experienced by boys are of greater severity.

Health Risk Behaviours That Lead to Injury
During the teenage years, young people often begin to engage in behaviours that may be detrimental to their health. These include smoking, drinking, social drug use, and aggressive behaviours. They also may ignore accepted safety practices such as the use of seat belts in vehicles. Positive impacts of these behaviours include the opportunities for learning and growth associated with them, which in turn help young people make the transition to adulthood (Jessor, 1991). Yet the negative impacts include the effects these behaviours have on health and well-being. Multiple risk behaviour refers to the engagement of more than one of these behaviours on a regular basis. Irrespective of the impacts, multiple risk behaviour has been observed in groups of young people throughout the world.
The impact of multiple risk behaviour on long-term health has been well established. For example, many chronic diseases, such as heart disease, respiratory disease, and some forms of cancer, are caused by long-term exposures to substances like tobacco and alcohol. The short-term impacts of multiple risk behaviour on youth health are not well understood. One way of exploring them is by examining whether multiple risk behaviour has an influence on injury experiences.
Figure 9.17 shows that in Canada, risks for youth injury rose sharply in accordance with the number of risk behaviours reported. These risk behaviours included smoking, excessive drinking, engagement in bullying, and failure to use seat belts. They were selected to illustrate a general trend that has been observed among youth of various ages, both genders, and for a variety of different types of injury (Pickett, Garner, King, and Boyce, 2002; Pickett, Schmid, and colleagues, 2002).
Figure 9.17
Students who had an injury in the past year requiring treatment by a doctor or nurse, by number of health risk behaviours (HRB) (%)

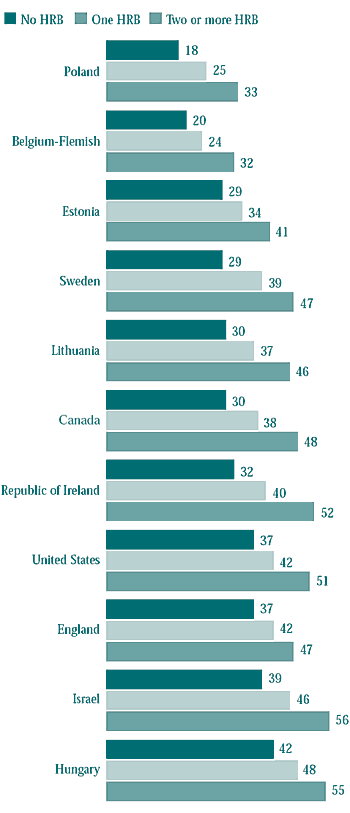
Figure 9.18 uses 1998 HBSC data to show that the association between multiple risk behaviour and injury can be observed in youth in many countries. The interesting differences in rates of injury between the 1998 and 2002 survey years must be interpreted with caution. For a number of practical reasons, questionnaires were not administered in both survey years at the same time of year. Seasonal differences in the occurrence of injury exist, and young people tend to recall the injuries that occurred most recently with more accuracy (Harel and colleagues, 1994). This likely influenced the magnitude of the injury rates observed between survey years but did not alter the trend toward increasing risk for injury with increasing numbers of health risk behaviours reported.
Figure 9.18
Students who had an injury in the past year requiring treatment by a doctor or nurse, by number of health risk behaviours (HRB) across various countries (%, 1998 HBSC)
Major Findings:
- Injuries among students peaked at Grade 8.
- Slightly more boys than girls reported injuries usually said one injury.
- Most injuries were due to sports activities.
- Organized sports accounted for an increasing proportion of injuries as students got older, even though girls decreased their involvement in organized sports.
- Schools, sports facilities, and the home environment are the main locations for injuries.
- Risk takaing was highly related to injuries.