
Asthma and Chronic Obstructive Pulmonary Disease (COPD) in Canada, 2018
Related Topics
Report from the Canadian Chronic Disease Surveillance System
Table of contents
- Executive summary
- Introduction
- Chapter 1: Asthma
- Chapter 2: Chronic Obstructive Pulmonary Disease
- Chapter 3: A Final Word
- Appendix A: Chronic Respiratory Disease Surveillance Development through the Canadian Chronic Disease Surveillance System
- Appendix B: Case Definitions for Comorbid Conditions
- Glossary
- Acknowledgements
- References
Executive summary
Breathing is something many people take for granted. However, in Canada, 3.8 million people over the age of one are living with asthma and 2.0 million are living with chronic obstructive pulmonary disease (COPD), both of which can impact a person's ability to breathe. Individuals living with asthma or COPD may experience impaired participation in daily life, school, work, and social activities. Collectively, there is also an impact in terms of lost productivity and health care costs, especially considering the increasing prevalence of both asthma and COPD.
This report describes the occurrence of asthma and COPD in Canada as identified through the Canadian Chronic Disease Surveillance System (CCDSS) from 2000-2001 to 2011-2012. It is the first national report on asthma and COPD using the CCDSS.
Asthma
Asthma is a complex chronic lung disease characterised by the inflammation and narrowing of the airways. Asthma symptoms are typically episodic and can be effectively controlled by proper medications and avoidance of exposure to triggers. Its causes are not well understood.
In 2011-2012, about 3.8 million Canadians age one and older were living with asthma. Although the number of new cases of asthma per year has declined between 2000-2001 and 2011-2012, the number of Canadians living with the disease has increased for the same time period due to the chronic nature of the disease.
People diagnosed with asthma were more likely to have other chronic diseases and conditions (diabetes, hypertension, mood and/or anxiety disorders) compared to those without asthma. However, deaths due to any cause among those with asthma have declined between 2000-2001 and 2011-2012.
COPD
COPD is a chronic, progressive lung disease which causes shortness of breath, cough and sputum production. COPD primarily affects the population 35 years and older. The primary cause of COPD is tobacco smoking, including second hand or passive exposure.
In 2011-2012 about 2.0 million Canadians aged 35 years and older were living with COPD. The number of new COPD cases per year has also declined between 2000-2001 and 2011-2012 while the number of Canadians living with the disease has increased for the same time period.
COPD occurs more frequently among those who also have other chronic diseases and conditions (diabetes, hypertension, mood and/or anxiety disorders, or asthma) compared to those who do not have these conditions. Deaths due to any cause among those with COPD have declined between 2000-2001 to 2011-2012, shadowing declining smoking rates.
Moving forward
Asthma and COPD are significant public health concerns in Canada. As we strive to improve our understanding of the full burden of these diseases, expanding surveillance and research efforts will provide a strong foundation. A continued focus on optimizing surveillance methodology is important to ensure accurate measurement of the prevalence and incidence of asthma and COPD, and the burden that these diseases have on individuals, the health care system and society as a whole. These data can support the design of new policies and programs to reduce the impact of these diseases on Canadians.
Introduction
Breathing is vital to life. Our lungs are made of delicate tissues that do not react well to assault or injury from tobacco smoke, occupational exposures or indoor or outdoor air pollution. In addition to these external factors, intrinsic factors such as genetics, premature birth, and early childhood infections also play a role in the development of lung disorders such as asthma and chronic obstructive pulmonary disease (COPD). Footnote 1Footnote 2Footnote 3Footnote 4Footnote 5Footnote 6Footnote 7Footnote 8Footnote 9Footnote 10
Asthma and COPD are chronic diseases that have a significant impact on individuals, their family and friends and on the health care system. According to Vital Statistics from Statistics Canada, deaths due to chronic lower respiratory causes (which included asthma and COPD, among others) ranked fifth overall in the proportion of all deaths for both males and females in 2012; accounting for more than 11,000 deaths.Footnote 11
Tobacco smoking, including second hand or passive exposure, is the single largest threat to lung health in Canada. However, it is one of the most modifiable risk factors. Tobacco smoking is being addressed through the Federal Tobacco Control Strategy (FTCS), which has set smoking reduction targets among youth and adult smokers in Canada.Footnote 12 Encouragingly, the original smoking rate reduction targets set in 2001 for the FTCS were met ahead of schedule. According to the Canadian Tobacco Use Monitoring Survey (CTUMS), smoking rates are at their lowest ever. The proportion of Canadians who are current smokers is down from 21.7% in 2001 to 14.6% in 2013.Footnote 13 This is an encouraging trend, but more remains to be done. The Government of Canada recognized this need by renewing its commitment to the FTCS in its Budget 2012. To protect Canadians, especially young people, from the health consequences of tobacco use, the FTCS continues to focus on: preventing children and youth from starting to smoke; helping people to quit smoking; helping Canadians protect themselves from second-hand smoke; and regulating the manufacture, sale, labeling and promotion of tobacco products by administering the Tobacco Act.Footnote 12 Tobacco control strategies are further supported by provincial and territorial action. An important component of the FTCS is cooperation with the provinces and territories, municipalities, non-governmental organizations, community agencies and the private sector.Footnote 12
This report describes the occurrence of asthma and COPD in Canada as identified through the Canadian Chronic Disease Surveillance System (CCDSS) from 2000-2001 to 2011-2012. The purpose of this report is to illustrate the burden of asthma and COPD in the Canadian population by reporting the prevalence, incidence, and mortality of these chronic respiratory diseases. Comorbidity with four other major chronic diseases and conditions is also reported.
Canadian Chronic Disease Surveillance System (CCDSS)
The CCDSS is a collaborative network of provincial and territorial chronic disease surveillance systems, led by the Public Health Agency of Canada (PHAC). The CCDSS identifies chronic disease cases from provincial and territorial administrative health databases, including physician billing claims and hospital discharge abstract records, linked to provincial and territorial health insurance registry records using a unique personal identifier. Data on all residents eligible for provincial or territorial health insurance (about 97% of the Canadian population) are captured in the health insurance registries; thus, the CCDSS coverage is near-universal with the exception of some small populations. Case definitions are applied to these linked databases and data are then aggregated at the provincial and territorial level before being submitted to PHAC for reporting at the provincial, territorial and national levels.
The CCDSS has expanded from its initial mandate of diabetes surveillance to include data on several additional chronic diseases and conditions including: hypertension, mental illness, mood and/or anxiety disorders, heart failure, ischemic heart disease, acute myocardial infarction, stroke, osteoporosis, arthritis and neurological conditions. Asthma and COPD were added to the CCDSS in 2012.
The data presented in this report and subsequent updates can be accessed on the Public Health Agency of Canada's Public Health Infobase.
Chapter 1: Asthma
Introduction
Asthma is a common, chronic lung disease. The Global Initiative for Asthma defines asthma as: "a heterogeneous disease, usually characterized by chronic airway inflammation. It is defined by the history of respiratory symptoms such as wheeze, shortness of breath, chest tightness and cough that vary over time and in intensity, together with variable expiratory airflow limitation."Footnote 1 Asthma symptoms and attacks are often triggered by factors such as exercise, exposure to allergens or irritants, changes in the weather or viral respiratory infections.Footnote 1
Uncontrolled asthma can have a considerable impact not only on quality of life of affected individuals and families but also in terms of costs to the health care system and lost productivity. Fortunately, with recent advances in medications and asthma education and management strategies, such as increasing the awareness of signs and symptoms and limiting exposure to triggers, asthma can be well controlled.
Globally, asthma is a significant health problem affecting people of all ages. The World Health Organization (WHO) estimates that asthma affects about 235 million people worldwide.Footnote 14 According to the Global Initiative for Asthma, global prevalence estimates range from 1% to 18% of the population across different countries.Footnote 1 Worldwide, it is estimated that one in every 250 individuals will die from asthma.Footnote 15 Approximately 26 million disability-adjusted life-years (DALYs) are lost annually due to asthma, representing 1% of all DALYs lost.Footnote 16
Asthma in the Canadian population
CCDSS Case Definitions
Prevalent Asthma Case Definition
The case definition of diagnosed asthma is: an individual aged one year and older having at least two visits to a physician with a diagnosis of asthma in the first diagnostic field in a two-year period, or at least one hospital separation with a diagnosis of asthma ever in any diagnostic field, coded by the International Classification of Diseases (ICD), ninth revision or ICD-9-CM 493 or ICD-10-CA J45-46. This case definition for asthma was validated by two independent studies in Ontario.Footnote 17Footnote 18
Only the first diagnostic field was used in physician billing claims data as not all provinces and territories had more than one diagnostic field. All fields were included from the hospital separation file as this database allows for the recording of up to 25 diagnoses.
Based on this definition, once a case is detected, it is a prevalent case for life regardless of future contact with health services. Consequently, once someone is identified as a case, they are always included in the database as a case. All jurisdictions identified cases occurring as of 1995, with the exception of Quebec which began in 1996 and Nunavut which began in 2005.
Active Asthma Case Definition
An individual aged one year and older who has met the asthma case definition is classified as "active" for a given fiscal year if the individual had at least one physician claim in the first diagnostic field or at least one hospital separation in any diagnostic field coded by ICD9(-CM) 493 or ICD-10-CA J45-46 within that given year. These cases are referred to as "active asthma prevalent cases."
Incident Asthma Case Definition
Incident asthma cases were identified in the year where an individual met the case definition for the first time. A run-in period of five years, where data were collected and not reported, was employed to partially account for the prevalence pool effect; i.e., to ensure that an incident case was not a pre-existing prevalent case. (For further explanation of prevalence pool effect, please see the glossary).
Denominator Definition
The denominator for the rate and proportion calculations in the report was the number of individuals in the provincial and territorial health insurance registries. Data on all residents who are eligible for provincial or territorial health insurance (about 97% of the Canadian population) are captured in these registries. Individual demographic information is obtained from these registries; age is calculated as of the end of the fiscal year, on March 31.
Prevalence
Asthma
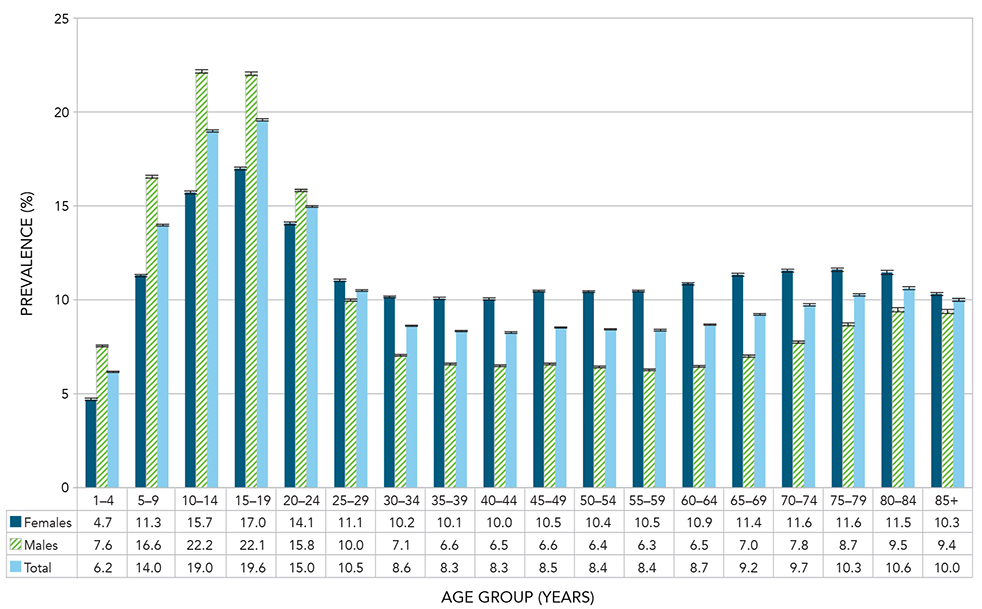
As shown in Figure 1.1, asthma prevalence in 2011-2012 increased steadily in childhood; peaking in the 10-14 age group for males (22.2%) and the 15-19 age group in females (17.0%). Prevalence declined after that until the 30-34 age group and remained steady until the 60-64 age group after which there was an increase in prevalence in both males (more pronounced) and females.
In 2011-2012 there was a notable cross-over by gender in asthma prevalence starting at the 25-29 age group. At this age, the prevalence for males became lower than for females and this difference remained through to the older age groups (Figure 1.1).
Figure 1.1 Prevalence of diagnosed asthma among Canadians aged one year and older, by age group and sex, Canada, 2011-2012
Notes: The 95% confidence interval shows an estimated range of values which is likely to include the true value 19 times out of 20. Crude estimates were based on randomly rounded counts to an adjacent multiple of 10 while age-standardized estimates were based on unrounded counts; therefore the total counts used for crude, age-specific and age-standardized estimates will differ.
Source: Public Health Agency of Canada, using Canadian Chronic Disease Surveillance System data files contributed by provinces and territories.
Figure 1.1 - Text equivalent
| Age Group (Years) | Sex | Prevalence (%) | 95% Lower confidence interval | 95% Upper confidence interval |
|---|---|---|---|---|
| 1-4 | Females | 4.7 | 4.7 | 4.8 |
| 1-4 | Males | 7.6 | 7.5 | 7.6 |
| 1-4 | Total | 6.2 | 6.1 | 6.2 |
| 5-9 | Females | 11.3 | 11.2 | 11.4 |
| 5-9 | Males | 16.6 | 16.5 | 16.6 |
| 5-9 | Total | 14.0 | 13.9 | 14.0 |
| 10-14 | Females | 15.7 | 15.6 | 15.8 |
| 10-14 | Males | 22.2 | 22.1 | 22.3 |
| 10-14 | Total | 19.0 | 19.0 | 19.1 |
| 15-19 | Females | 17.0 | 16.9 | 17.1 |
| 15-19 | Males | 22.1 | 22.0 | 22.1 |
| 15-19 | Total | 19.6 | 19.5 | 19.7 |
| 20-24 | Females | 14.1 | 14.0 | 14.2 |
| 20-24 | Males | 15.8 | 15.8 | 15.9 |
| 20-24 | Total | 15.0 | 14.9 | 15.0 |
| 25-29 | Females | 11.1 | 11.0 | 11.1 |
| 25-29 | Males | 10.0 | 9.9 | 10.0 |
| 25-29 | Total | 10.5 | 10.5 | 10.6 |
| 30-34 | Females | 10.2 | 10.1 | 10.2 |
| 30-34 | Males | 7.1 | 7.0 | 7.1 |
| 30-34 | Total | 8.6 | 8.6 | 8.7 |
| 35-39 | Females | 10.1 | 10.0 | 10.1 |
| 35-39 | Males | 6.6 | 6.5 | 6.6 |
| 35-39 | Total | 8.3 | 8.3 | 8.4 |
| 40-44 | Females | 10.0 | 10.0 | 10.1 |
| 40-44 | Males | 6.5 | 6.5 | 6.5 |
| 40-44 | Total | 8.3 | 8.2 | 8.3 |
| 45-49 | Females | 10.5 | 10.4 | 10.5 |
| 45-49 | Males | 6.6 | 6.5 | 6.6 |
| 45-49 | Total | 8.5 | 8.5 | 8.6 |
| 50-54 | Females | 10.4 | 10.4 | 10.5 |
| 50-54 | Males | 6.4 | 6.4 | 6.5 |
| 50-54 | Total | 8.4 | 8.4 | 8.5 |
| 55-59 | Females | 10.5 | 10.4 | 10.5 |
| 55-59 | Males | 6.3 | 6.2 | 6.3 |
| 55-59 | Total | 8.4 | 8.4 | 8.4 |
| 60-64 | Females | 10.9 | 10.8 | 10.9 |
| 60-64 | Males | 6.5 | 6.4 | 6.5 |
| 60-64 | Total | 8.7 | 8.6 | 8.7 |
| 65-69 | Females | 11.4 | 11.3 | 11.4 |
| 65-69 | Males | 7.0 | 7.0 | 7.1 |
| 65-69 | Total | 9.2 | 9.2 | 9.3 |
| 70-74 | Females | 11.6 | 11.5 | 11.6 |
| 70-74 | Males | 7.8 | 7.7 | 7.8 |
| 70-74 | Total | 9.7 | 9.7 | 9.8 |
| 75-79 | Females | 11.6 | 11.5 | 11.7 |
| 75-79 | Males | 8.7 | 8.6 | 8.8 |
| 75-79 | Total | 10.3 | 10.2 | 10.3 |
| 80-84 | Females | 11.5 | 11.4 | 11.6 |
| 80-84 | Males | 9.5 | 9.4 | 9.6 |
| 80-84 | Total | 10.6 | 10.6 | 10.7 |
| 85+ | Females | 10.3 | 10.2 | 10.4 |
| 85+ | Males | 9.4 | 9.3 | 9.5 |
| 85+ | Total | 10.0 | 9.9 | 10.1 |
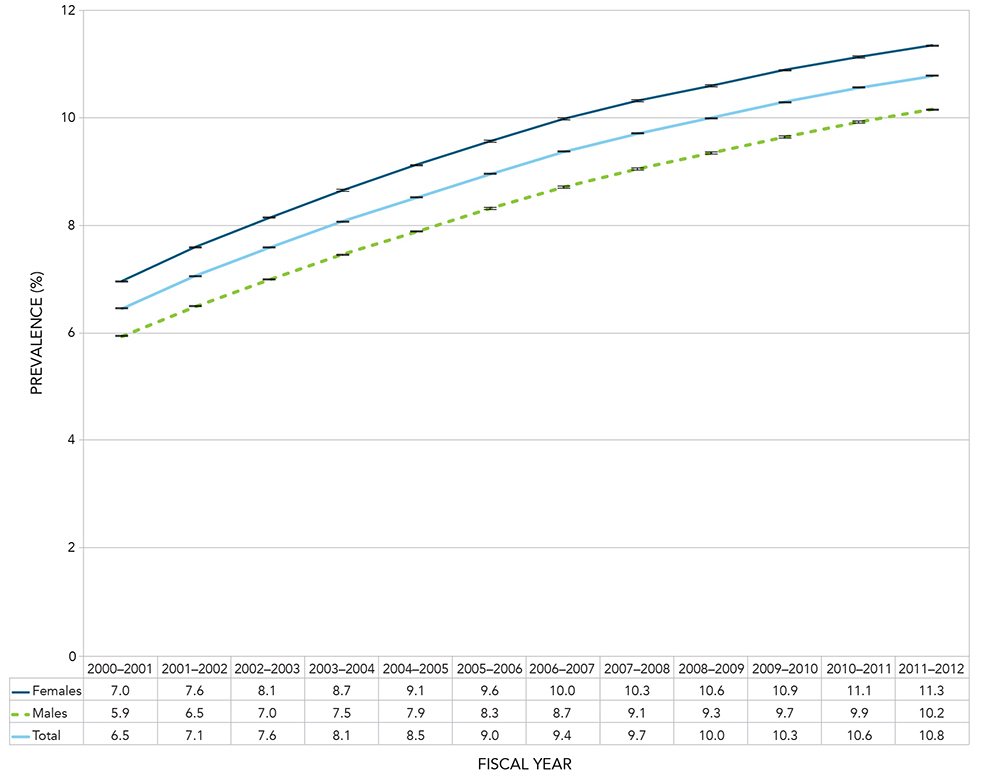
Between 2000-2001 and 2011-2012, the relative increase in the age-standardized prevalence for asthma among Canadians aged one year and older was 67.0%. The prevalence increased from 2.1 million Canadians (6.5%) in 2000-2001 to 3.8 million Canadians (10.8%) in 2011-2012; the increase was seen in both males and females (Figure 1.2).
Figure 1.2 Age-standardized prevalence of diagnosed asthma among Canadians aged one year and older, by sex and year, Canada, 2000-2001 to 2011-2012
Notes: Age-standardized to the 2011 Canadian population. The 95% confidence interval shows an estimated range of values which is likely to include the true value 19 times out of 20.
Source: Public Health Agency of Canada, using Canadian Chronic Disease Surveillance System data files contributed by provinces and territories.
Figure 1.2 - Text equivalent
| Fiscal Year | Sex | Age-standardized prevalence (%) | 95% Lower confidence interval | 95% Upper confidence interval |
|---|---|---|---|---|
| 2000-2001 | Females | 7.0 | 6.9 | 7.0 |
| 2000-2001 | Males | 5.9 | 5.9 | 6.0 |
| 2000-2001 | Total | 6.5 | 6.4 | 6.5 |
| 2001-2002 | Females | 7.6 | 7.6 | 7.6 |
| 2001-2002 | Males | 6.5 | 6.5 | 6.5 |
| 2001-2002 | Total | 7.1 | 7.0 | 7.1 |
| 2002-2003 | Females | 8.1 | 8.1 | 8.2 |
| 2002-2003 | Males | 7.0 | 7.0 | 7.0 |
| 2002-2003 | Total | 7.6 | 7.6 | 7.6 |
| 2003-2004 | Females | 8.7 | 8.6 | 8.7 |
| 2003-2004 | Males | 7.5 | 7.4 | 7.5 |
| 2003-2004 | Total | 8.1 | 8.1 | 8.1 |
| 2004-2005 | Females | 9.1 | 9.1 | 9.1 |
| 2004-2005 | Males | 7.9 | 7.9 | 7.9 |
| 2004-2005 | Total | 8.5 | 8.5 | 8.5 |
| 2005-2006 | Females | 9.6 | 9.6 | 9.6 |
| 2005-2006 | Males | 8.3 | 8.3 | 8.3 |
| 2005-2006 | Total | 9.0 | 9.0 | 9.0 |
| 2006-2007 | Females | 10.0 | 10.0 | 10.0 |
| 2006-2007 | Males | 8.7 | 8.7 | 8.7 |
| 2006-2007 | Total | 9.4 | 9.4 | 9.4 |
| 2007-2008 | Females | 10.3 | 10.3 | 10.3 |
| 2007-2008 | Males | 9.1 | 9.0 | 9.1 |
| 2007-2008 | Total | 9.7 | 9.7 | 9.7 |
| 2008-2009 | Females | 10.6 | 10.6 | 10.6 |
| 2008-2009 | Males | 9.3 | 9.3 | 9.4 |
| 2008-2009 | Total | 10.0 | 10.0 | 10.0 |
| 2009-2010 | Females | 10.9 | 10.9 | 10.9 |
| 2009-2010 | Males | 9.7 | 9.6 | 9.7 |
| 2009-2010 | Total | 10.3 | 10.3 | 10.3 |
| 2010-2011 | Females | 11.1 | 11.1 | 11.2 |
| 2010-2011 | Males | 9.9 | 9.9 | 9.9 |
| 2010-2011 | Total | 10.6 | 10.6 | 10.6 |
| 2011-2012 | Females | 11.3 | 11.3 | 11.4 |
| 2011-2012 | Males | 10.2 | 10.1 | 10.2 |
| 2011-2012 | Total | 10.8 | 10.8 | 10.8 |
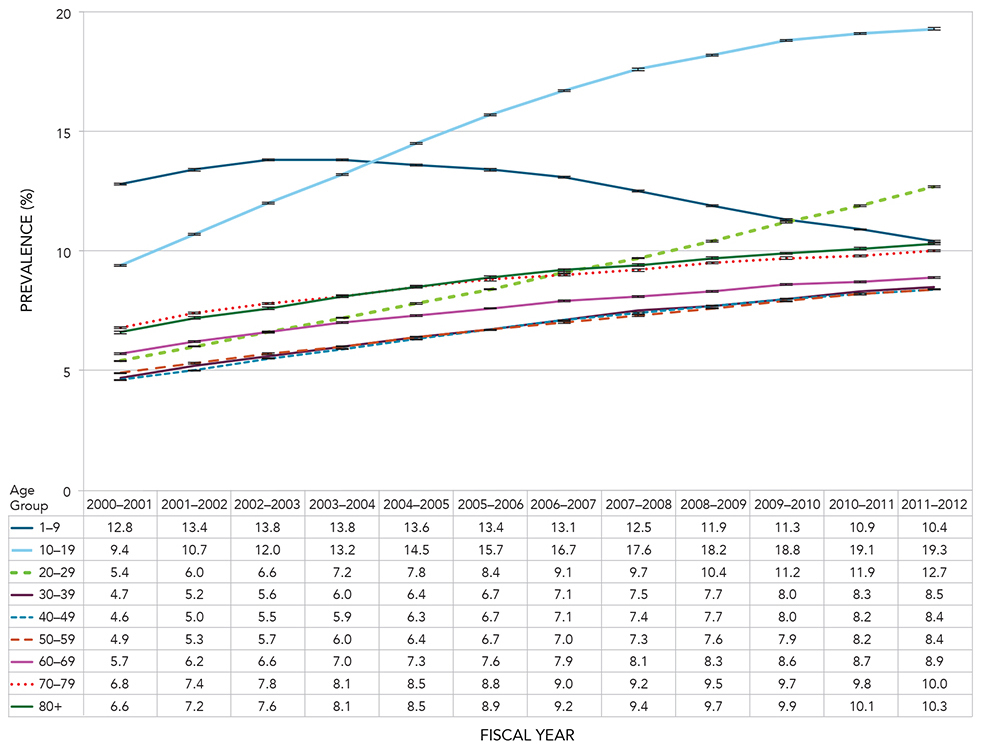
Generally, most age groups saw an increase in the prevalence of asthma over the observation period. However, two trends stand out. First, the proportions for the 1-9 age group were highest in 2002-2003 and 2003-2004 and then declined through to 2011-2012. Second, the 10-19 and 20-29 age groups had the steepest increase in asthma prevalence relative to the other age groups over the observation period (Figure 1.3).
Figure 1.3 Prevalence of diagnosed asthma among Canadians aged one year and older, by 10-year age group and year, Canada, 2000-2001 to 2011-2012
Notes: The 95% confidence interval shows an estimated range of values which is likely to include the true value 19 times out of 20. Crude estimates were based on randomly rounded counts to an adjacent multiple of 10 while age-standardized estimates were based on unrounded counts; therefore the total counts used for crude, age-specific and age-standardized estimates will differ.
Source: Public Health Agency of Canada, using Canadian Chronic Disease Surveillance System data files contributed by provinces and territories.
Figure 1.3 - Text equivalent
| Age Group (Years) | Fiscal Year | Prevalence (%) | 95% Lower confidence interval | 95% Upper confidence interval |
|---|---|---|---|---|
| 1-9 | 2000-2001 | 12.8 | 12.7 | 12.8 |
| 1-9 | 2001-2002 | 13.4 | 13.4 | 13.4 |
| 1-9 | 2002-2003 | 13.8 | 13.7 | 13.8 |
| 1-9 | 2003-2004 | 13.8 | 13.8 | 13.9 |
| 1-9 | 2004-2005 | 13.6 | 13.6 | 13.6 |
| 1-9 | 2005-2006 | 13.4 | 13.4 | 13.5 |
| 1-9 | 2006-2007 | 13.1 | 13.0 | 13.1 |
| 1-9 | 2007-2008 | 12.5 | 12.4 | 12.5 |
| 1-9 | 2008-2009 | 11.9 | 11.8 | 11.9 |
| 1-9 | 2009-2010 | 11.3 | 11.3 | 11.4 |
| 1-9 | 2010-2011 | 10.9 | 10.9 | 11.0 |
| 1-9 | 2011-2012 | 10.4 | 10.4 | 10.5 |
| 10-19 | 2000-2001 | 9.4 | 9.4 | 9.5 |
| 10-19 | 2001-2002 | 10.7 | 10.7 | 10.7 |
| 10-19 | 2002-2003 | 12.0 | 11.9 | 12.0 |
| 10-19 | 2003-2004 | 13.2 | 13.2 | 13.2 |
| 10-19 | 2004-2005 | 14.5 | 14.5 | 14.5 |
| 10-19 | 2005-2006 | 15.7 | 15.6 | 15.7 |
| 10-19 | 2006-2007 | 16.7 | 16.7 | 16.8 |
| 10-19 | 2007-2008 | 17.6 | 17.5 | 17.6 |
| 10-19 | 2008-2009 | 18.2 | 18.2 | 18.3 |
| 10-19 | 2009-2010 | 18.8 | 18.7 | 18.8 |
| 10-19 | 2010-2011 | 19.1 | 19.1 | 19.2 |
| 10-19 | 2011-2012 | 19.3 | 19.3 | 19.4 |
| 20-29 | 2000-2001 | 5.4 | 5.4 | 5.5 |
| 20-29 | 2001-2002 | 6.0 | 6.0 | 6.1 |
| 20-29 | 2002-2003 | 6.6 | 6.6 | 6.7 |
| 20-29 | 2003-2004 | 7.2 | 7.2 | 7.2 |
| 20-29 | 2004-2005 | 7.8 | 7.8 | 7.8 |
| 20-29 | 2005-2006 | 8.4 | 8.4 | 8.4 |
| 20-29 | 2006-2007 | 9.1 | 9.0 | 9.1 |
| 20-29 | 2007-2008 | 9.7 | 9.7 | 9.8 |
| 20-29 | 2008-2009 | 10.4 | 10.4 | 10.4 |
| 20-29 | 2009-2010 | 11.2 | 11.1 | 11.2 |
| 20-29 | 2010-2011 | 11.9 | 11.9 | 12.0 |
| 20-29 | 2011-2012 | 12.7 | 12.7 | 12.8 |
| 30-39 | 2000-2001 | 4.7 | 4.7 | 4.7 |
| 30-39 | 2001-2002 | 5.2 | 5.2 | 5.2 |
| 30-39 | 2002-2003 | 5.6 | 5.6 | 5.6 |
| 30-39 | 2003-2004 | 6.0 | 6.0 | 6.0 |
| 30-39 | 2004-2005 | 6.4 | 6.4 | 6.4 |
| 30-39 | 2005-2006 | 6.7 | 6.7 | 6.8 |
| 30-39 | 2006-2007 | 7.1 | 7.1 | 7.2 |
| 30-39 | 2007-2008 | 7.5 | 7.4 | 7.5 |
| 30-39 | 2008-2009 | 7.7 | 7.7 | 7.7 |
| 30-39 | 2009-2010 | 8.0 | 8.0 | 8.0 |
| 30-39 | 2010-2011 | 8.3 | 8.2 | 8.3 |
| 30-39 | 2011-2012 | 8.5 | 8.5 | 8.5 |
| 40-49 | 2000-2001 | 4.6 | 4.5 | 4.6 |
| 40-49 | 2001-2002 | 5.0 | 5.0 | 5.1 |
| 40-49 | 2002-2003 | 5.5 | 5.5 | 5.5 |
| 40-49 | 2003-2004 | 5.9 | 5.9 | 5.9 |
| 40-49 | 2004-2005 | 6.3 | 6.3 | 6.3 |
| 40-49 | 2005-2006 | 6.7 | 6.6 | 6.7 |
| 40-49 | 2006-2007 | 7.1 | 7.0 | 7.1 |
| 40-49 | 2007-2008 | 7.4 | 7.4 | 7.4 |
| 40-49 | 2008-2009 | 7.7 | 7.7 | 7.7 |
| 40-49 | 2009-2010 | 8.0 | 7.9 | 8.0 |
| 40-49 | 2010-2011 | 8.2 | 8.2 | 8.2 |
| 40-49 | 2011-2012 | 8.4 | 8.4 | 8.4 |
| 50-59 | 2000-2001 | 4.9 | 4.8 | 4.9 |
| 50-59 | 2001-2002 | 5.3 | 5.3 | 5.3 |
| 50-59 | 2002-2003 | 5.7 | 5.7 | 5.7 |
| 50-59 | 2003-2004 | 6.0 | 6.0 | 6.1 |
| 50-59 | 2004-2005 | 6.4 | 6.4 | 6.4 |
| 50-59 | 2005-2006 | 6.7 | 6.7 | 6.7 |
| 50-59 | 2006-2007 | 7.0 | 7.0 | 7.1 |
| 50-59 | 2007-2008 | 7.3 | 7.3 | 7.4 |
| 50-59 | 2008-2009 | 7.6 | 7.6 | 7.6 |
| 50-59 | 2009-2010 | 7.9 | 7.9 | 7.9 |
| 50-59 | 2010-2011 | 8.2 | 8.1 | 8.2 |
| 50-59 | 2011-2012 | 8.4 | 8.4 | 8.4 |
| 60-69 | 2000-2001 | 5.7 | 5.7 | 5.8 |
| 60-69 | 2001-2002 | 6.2 | 6.2 | 6.2 |
| 60-69 | 2002-2003 | 6.6 | 6.6 | 6.6 |
| 60-69 | 2003-2004 | 7.0 | 6.9 | 7.0 |
| 60-69 | 2004-2005 | 7.3 | 7.2 | 7.3 |
| 60-69 | 2005-2006 | 7.6 | 7.5 | 7.6 |
| 60-69 | 2006-2007 | 7.9 | 7.8 | 7.9 |
| 60-69 | 2007-2008 | 8.1 | 8.1 | 8.1 |
| 60-69 | 2008-2009 | 8.3 | 8.3 | 8.4 |
| 60-69 | 2009-2010 | 8.6 | 8.5 | 8.6 |
| 60-69 | 2010-2011 | 8.7 | 8.7 | 8.8 |
| 60-69 | 2011-2012 | 8.9 | 8.9 | 9.0 |
| 70-79 | 2000-2001 | 6.8 | 6.8 | 6.9 |
| 70-79 | 2001-2002 | 7.4 | 7.3 | 7.4 |
| 70-79 | 2002-2003 | 7.8 | 7.7 | 7.8 |
| 70-79 | 2003-2004 | 8.1 | 8.1 | 8.2 |
| 70-79 | 2004-2005 | 8.5 | 8.4 | 8.5 |
| 70-79 | 2005-2006 | 8.8 | 8.7 | 8.8 |
| 70-79 | 2006-2007 | 9.0 | 9.0 | 9.1 |
| 70-79 | 2007-2008 | 9.2 | 9.2 | 9.3 |
| 70-79 | 2008-2009 | 9.5 | 9.5 | 9.5 |
| 70-79 | 2009-2010 | 9.7 | 9.6 | 9.7 |
| 70-79 | 2010-2011 | 9.8 | 9.8 | 9.9 |
| 70-79 | 2011-2012 | 10.0 | 9.9 | 10.0 |
| 80+ | 2000-2001 | 6.6 | 6.5 | 6.6 |
| 80+ | 2001-2002 | 7.2 | 7.1 | 7.2 |
| 80+ | 2002-2003 | 7.6 | 7.6 | 7.7 |
| 80+ | 2003-2004 | 8.1 | 8.1 | 8.2 |
| 80+ | 2004-2005 | 8.5 | 8.5 | 8.6 |
| 80+ | 2005-2006 | 8.9 | 8.9 | 9.0 |
| 80+ | 2006-2007 | 9.2 | 9.1 | 9.2 |
| 80+ | 2007-2008 | 9.4 | 9.4 | 9.5 |
| 80+ | 2008-2009 | 9.7 | 9.6 | 9.8 |
| 80+ | 2009-2010 | 9.9 | 9.8 | 9.9 |
| 80+ | 2010-2011 | 10.1 | 10.1 | 10.2 |
| 80+ | 2011-2012 | 10.3 | 10.3 | 10.4 |
In 2011-2012, the age-standardized prevalence of asthma varied among provinces and territories in Canada (Figure 1.4). The highest proportions were in Ontario and Nova Scotia; both exceeded that of Canada as a whole. The lowest proportions were in the Northwest Territories, Yukon, and Nunavut.
Figure 1.4 Age-standardized prevalence of diagnosed asthma among Canadians aged one year and older, by sex and province/territory, Canada, 2011-2012
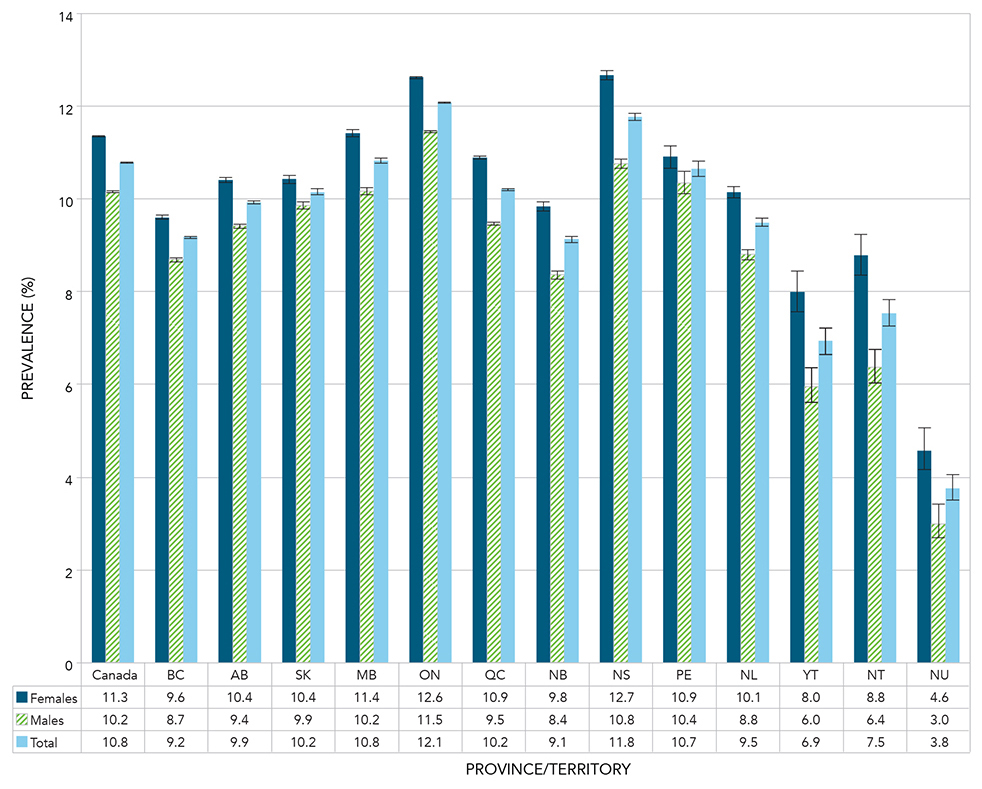
Notes: Age-standardized to the 2011 Canadian population. The 95% confidence interval shows an estimated range of values which is likely to include the true value 19 times out of 20.
Source: Public Health Agency of Canada, using Canadian Chronic Disease Surveillance System data files contributed by provinces and territories.
Figure 1.4 - Text equivalent
| Province or territory | Sex | Age-standardized Prevalence (%) | 95% Lower confidence interval | 95% Upper confidence interval |
|---|---|---|---|---|
| Canada | Females | 11.3 | 11.3 | 11.4 |
| Canada | Males | 10.2 | 10.1 | 10.2 |
| Canada | Total | 10.8 | 10.8 | 10.8 |
| British Columbia | Females | 9.6 | 9.6 | 9.6 |
| British Columbia | Males | 8.7 | 8.7 | 8.7 |
| British Columbia | Total | 9.2 | 9.1 | 9.2 |
| Alberta | Females | 10.4 | 10.4 | 10.5 |
| Alberta | Males | 9.4 | 9.4 | 9.5 |
| Alberta | Total | 9.9 | 9.9 | 9.9 |
| Saskatchewan | Females | 10.4 | 10.3 | 10.5 |
| Saskatchewan | Males | 9.9 | 9.8 | 9.9 |
| Saskatchewan | Total | 10.2 | 10.1 | 10.2 |
| Manitoba | Females | 11.4 | 11.3 | 11.5 |
| Manitoba | Males | 10.2 | 10.1 | 10.2 |
| Manitoba | Total | 10.8 | 10.8 | 10.9 |
| Ontario | Females | 12.6 | 12.6 | 12.6 |
| Ontario | Males | 11.5 | 11.4 | 11.5 |
| Ontario | Total | 12.1 | 12.1 | 12.1 |
| Quebec | Females | 10.9 | 10.9 | 10.9 |
| Quebec | Males | 9.5 | 9.4 | 9.5 |
| Quebec | Total | 10.2 | 10.2 | 10.2 |
| New Brunswick | Females | 9.8 | 9.7 | 9.9 |
| New Brunswick | Males | 8.4 | 8.3 | 8.5 |
| New Brunswick | Total | 9.1 | 9.1 | 9.2 |
| Nova Scotia | Females | 12.7 | 12.6 | 12.8 |
| Nova Scotia | Males | 10.8 | 10.7 | 10.8 |
| Nova Scotia | Total | 11.8 | 11.7 | 11.8 |
| Prince Edward Island | Females | 10.9 | 10.7 | 11.1 |
| Prince Edward Island | Males | 10.4 | 10.1 | 10.6 |
| Prince Edward Island | Total | 10.7 | 10.5 | 10.8 |
| Newfoundland and Labrador | Females | 10.1 | 10.0 | 10.3 |
| Newfoundland and Labrador | Males | 8.8 | 8.7 | 8.9 |
| Newfoundland and Labrador | Total | 9.5 | 9.4 | 9.6 |
| Yukon | Females | 8.0 | 7.6 | 8.4 |
| Yukon | Males | 6.0 | 5.6 | 6.4 |
| Yukon | Total | 6.9 | 6.7 | 7.2 |
| Northwest Territories | Females | 8.8 | 8.3 | 9.2 |
| Northwest Territories | Males | 6.4 | 6.0 | 6.8 |
| Northwest Territories | Total | 7.5 | 7.3 | 7.8 |
| Nunavut | Females | 4.6 | 4.2 | 5.1 |
| Nunavut | Males | 3.0 | 2.7 | 3.4 |
| Nunavut | Total | 3.8 | 3.5 | 4.1 |
Active Asthma
Active asthma showed a similar pattern as asthma prevalence across the age groups. The prevalence of active asthma was higher for males than females in childhood, but became higher in females in the 20-24 age group and remained higher across all the older age groups. In 2011-2012, the prevalence of active asthma peaked in the 5-9 age group for males (5.6%) and for females (3.6%), declined until the 20-24 age group and then remained relatively stable after that (Figure 1.5).
Figure 1.5 Prevalence of diagnosed active asthma among Canadians aged one year and older, by age group and sex, Canada, 2011-2012
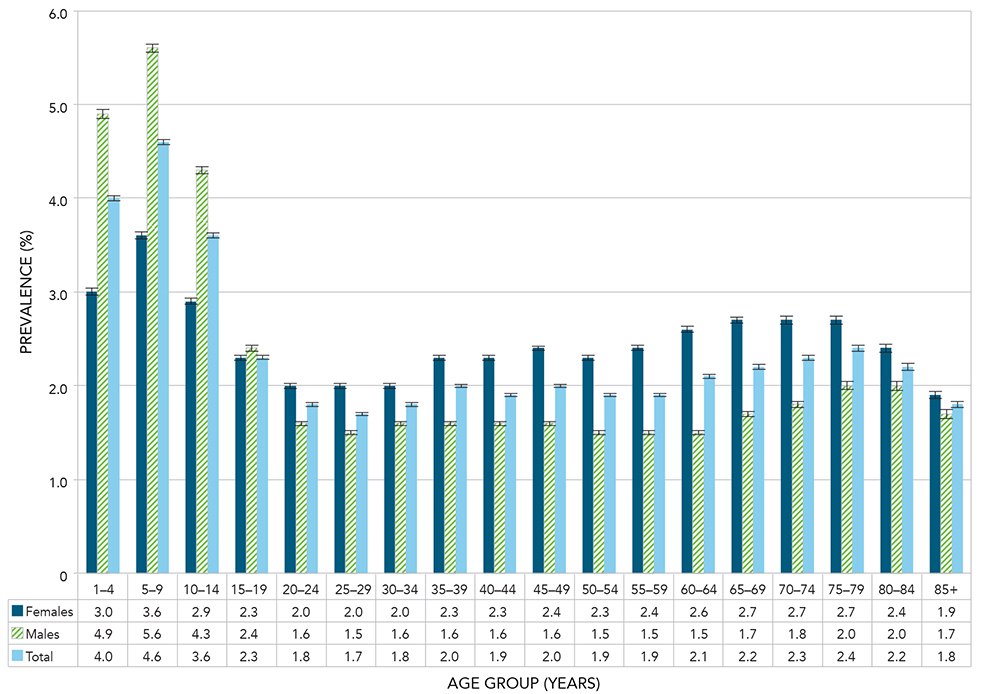
Notes: The 95% confidence interval shows an estimated range of values which is likely to include the true value 19 times out of 20. Crude estimates were based on randomly rounded counts to an adjacent multiple of 10 while age-standardized estimates were based on unrounded counts; therefore the total counts used for crude, age-specific and age-standardized estimates will differ.
Source: Public Health Agency of Canada, using Canadian Chronic Disease Surveillance System data files contributed by provinces and territories.
Figure 1.5 - Text equivalent
| Age Group (Years) | Sex | Prevalence (%) | 95% Lower confidence interval | 95% Upper confidence interval |
|---|---|---|---|---|
| 1-4 | Females | 3.0 | 3.0 | 3.0 |
| 1-4 | Males | 4.9 | 4.8 | 4.9 |
| 1-4 | Total | 4.0 | 3.9 | 4.0 |
| 5-9 | Females | 3.6 | 3.6 | 3.7 |
| 5-9 | Males | 5.6 | 5.6 | 5.6 |
| 5-9 | Total | 4.6 | 4.6 | 4.7 |
| 10-14 | Females | 2.9 | 2.9 | 3.0 |
| 10-14 | Males | 4.3 | 4.3 | 4.4 |
| 10-14 | Total | 3.6 | 3.6 | 3.7 |
| 15-19 | Females | 2.3 | 2.3 | 2.3 |
| 15-19 | Males | 2.4 | 2.3 | 2.4 |
| 15-19 | Total | 2.3 | 2.3 | 2.4 |
| 20-24 | Females | 2.0 | 2.0 | 2.1 |
| 20-24 | Males | 1.6 | 1.6 | 1.7 |
| 20-24 | Total | 1.8 | 1.8 | 1.9 |
| 25-29 | Females | 2.0 | 1.9 | 2.0 |
| 25-29 | Males | 1.5 | 1.5 | 1.5 |
| 25-29 | Total | 1.7 | 1.7 | 1.8 |
| 30-34 | Females | 2.0 | 2.0 | 2.1 |
| 30-34 | Males | 1.6 | 1.5 | 1.6 |
| 30-34 | Total | 1.8 | 1.8 | 1.8 |
| 35-39 | Females | 2.3 | 2.2 | 2.3 |
| 35-39 | Males | 1.6 | 1.6 | 1.6 |
| 35-39 | Total | 2.0 | 1.9 | 2.0 |
| 40-44 | Females | 2.3 | 2.3 | 2.4 |
| 40-44 | Males | 1.6 | 1.5 | 1.6 |
| 40-44 | Total | 1.9 | 1.9 | 2.0 |
| 45-49 | Females | 2.4 | 2.4 | 2.4 |
| 45-49 | Males | 1.6 | 1.5 | 1.6 |
| 45-49 | Total | 2.0 | 2.0 | 2.0 |
| 50-54 | Females | 2.3 | 2.3 | 2.4 |
| 50-54 | Males | 1.5 | 1.5 | 1.5 |
| 50-54 | Total | 1.9 | 1.9 | 1.9 |
| 55-59 | Females | 2.4 | 2.4 | 2.4 |
| 55-59 | Males | 1.5 | 1.4 | 1.5 |
| 55-59 | Total | 1.9 | 1.9 | 2.0 |
| 60-64 | Females | 2.6 | 2.6 | 2.6 |
| 60-64 | Males | 1.5 | 1.5 | 1.6 |
| 60-64 | Total | 2.1 | 2.0 | 2.1 |
| 65-69 | Females | 2.7 | 2.7 | 2.8 |
| 65-69 | Males | 1.7 | 1.7 | 1.7 |
| 65-69 | Total | 2.2 | 2.2 | 2.2 |
| 70-74 | Females | 2.7 | 2.7 | 2.8 |
| 70-74 | Males | 1.8 | 1.8 | 1.8 |
| 70-74 | Total | 2.3 | 2.3 | 2.3 |
| 75-79 | Females | 2.7 | 2.6 | 2.7 |
| 75-79 | Males | 2.0 | 1.9 | 2.0 |
| 75-79 | Total | 2.4 | 2.3 | 2.4 |
| 80-84 | Females | 2.4 | 2.4 | 2.5 |
| 80-84 | Males | 2.0 | 2.0 | 2.1 |
| 80-84 | Total | 2.2 | 2.2 | 2.3 |
| 85+ | Females | 1.9 | 1.8 | 1.9 |
| 85+ | Males | 1.7 | 1.7 | 1.8 |
| 85+ | Total | 1.8 | 1.8 | 1.8 |
Contrary to the steady increase observed in asthma prevalence, there was a slight decline in the active asthma prevalence over time (Figure 1.6).
Figure 1.6 Age-standardized prevalence of diagnosed active asthma among Canadians aged one year and older, by sex and year, Canada, 2000-2001 to 2011-2012
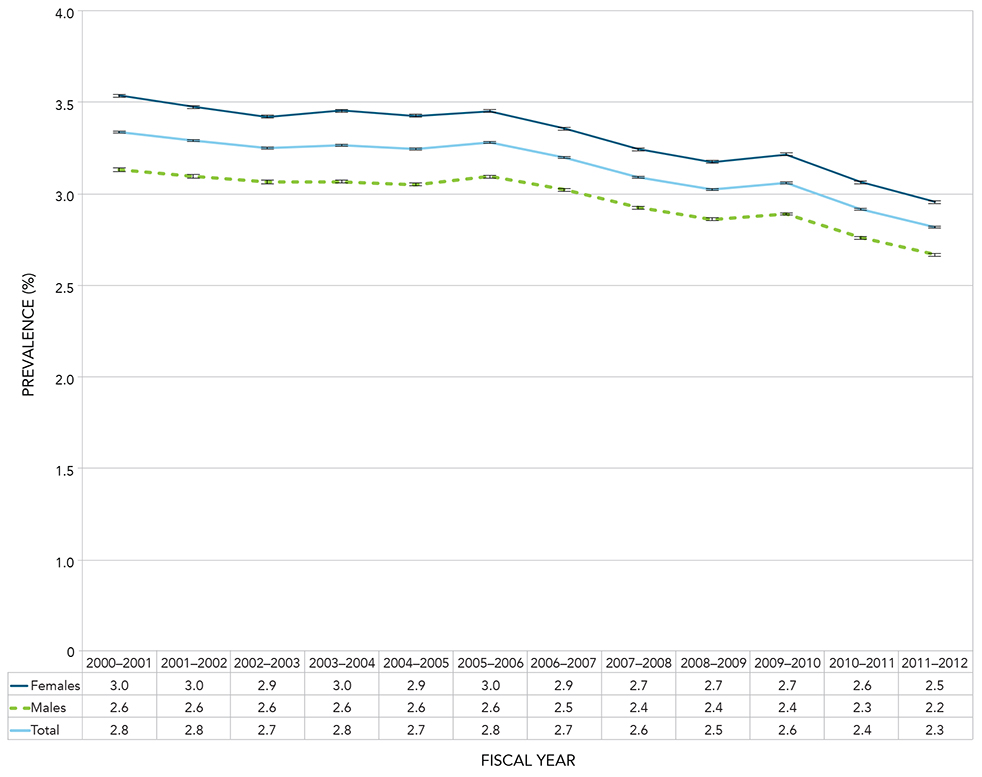
Notes: Age-standardized to the 2011 Canadian population. The 95% confidence interval shows an estimated range of values which is likely to include the true value 19 times out of 20.
Source: Public Health Agency of Canada, using Canadian Chronic Disease Surveillance System data files contributed by provinces and territories.
Figure 1.6 - Text equivalent
| Fiscal Year | Sex | Age-standardized Prevalence (%) | 95% Lower confidence interval | 95% Upper confidence interval |
|---|---|---|---|---|
| 2000-2001 | Females | 3.0 | 3.0 | 3.0 |
| 2000-2001 | Males | 2.6 | 2.6 | 2.6 |
| 2000-2001 | Total | 2.8 | 2.8 | 2.8 |
| 2001-2002 | Females | 3.0 | 3.0 | 3.0 |
| 2001-2002 | Males | 2.6 | 2.6 | 2.6 |
| 2001-2002 | Total | 2.8 | 2.8 | 2.8 |
| 2002-2003 | Females | 2.9 | 2.9 | 2.9 |
| 2002-2003 | Males | 2.6 | 2.6 | 2.6 |
| 2002-2003 | Total | 2.7 | 2.7 | 2.8 |
| 2003-2004 | Females | 3.0 | 2.9 | 3.0 |
| 2003-2004 | Males | 2.6 | 2.6 | 2.6 |
| 2003-2004 | Total | 2.8 | 2.8 | 2.8 |
| 2004-2005 | Females | 2.9 | 2.9 | 2.9 |
| 2004-2005 | Males | 2.6 | 2.5 | 2.6 |
| 2004-2005 | Total | 2.7 | 2.7 | 2.8 |
| 2005-2006 | Females | 3.0 | 2.9 | 3.0 |
| 2005-2006 | Males | 2.6 | 2.6 | 2.6 |
| 2005-2006 | Total | 2.8 | 2.8 | 2.8 |
| 2006-2007 | Females | 2.9 | 2.8 | 2.9 |
| 2006-2007 | Males | 2.5 | 2.5 | 2.5 |
| 2006-2007 | Total | 2.7 | 2.7 | 2.7 |
| 2007-2008 | Females | 2.7 | 2.7 | 2.8 |
| 2007-2008 | Males | 2.4 | 2.4 | 2.4 |
| 2007-2008 | Total | 2.6 | 2.6 | 2.6 |
| 2008-2009 | Females | 2.7 | 2.7 | 2.7 |
| 2008-2009 | Males | 2.4 | 2.4 | 2.4 |
| 2008-2009 | Total | 2.5 | 2.5 | 2.5 |
| 2009-2010 | Females | 2.7 | 2.7 | 2.7 |
| 2009-2010 | Males | 2.4 | 2.4 | 2.4 |
| 2009-2010 | Total | 2.6 | 2.6 | 2.6 |
| 2010-2011 | Females | 2.6 | 2.6 | 2.6 |
| 2010-2011 | Males | 2.3 | 2.3 | 2.3 |
| 2010-2011 | Total | 2.4 | 2.4 | 2.4 |
| 2011-2012 | Females | 2.5 | 2.4 | 2.5 |
| 2011-2012 | Males | 2.2 | 2.2 | 2.2 |
| 2011-2012 | Total | 2.3 | 2.3 | 2.3 |
Incidence
Incidence rates for asthma by age group showed a similar pattern to prevalence, but the peak incidence rates occurred at earlier ages. The peak incidence rate was seen in the 1-4 age group with 2796.4 cases per 100,000 population for males and 1821.6 cases per 100,000 population for females (Figure 1.7). The cross-over in incidence rates where the female rate became higher started at the 15-19 age group.
Figure 1.7 Incidence rates of diagnosed asthma among Canadians aged one year and older, by age group and sex, Canada, 2011-2012
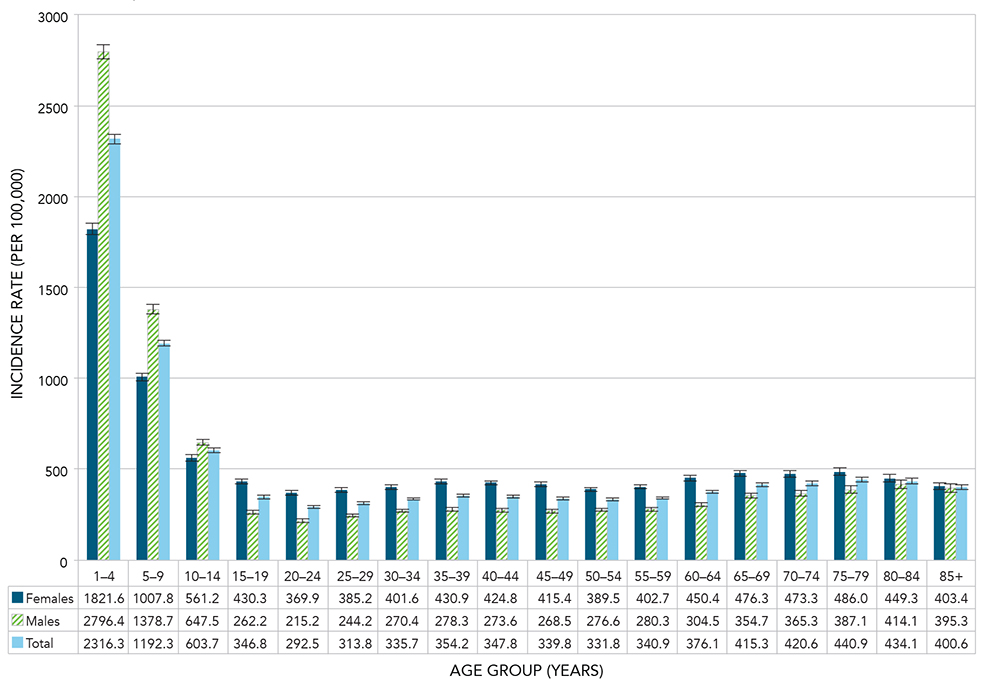
Notes: The 95% confidence interval shows an estimated range of values which is likely to include the true value 19 times out of 20. Crude estimates were based on randomly rounded counts to an adjacent multiple of 10 while age-standardized estimates were based on unrounded counts; therefore the total counts used for crude, age-specific and age-standardized estimates will differ.
Source: Public Health Agency of Canada, using Canadian Chronic Disease Surveillance System data files contributed by provinces and territories.
Figure 1.7 - Text equivalent
| Age Group (Years) | Sex | Incidence rate (per 100,000) | 95% Lower confidence interval | 95% Upper confidence interval |
|---|---|---|---|---|
| 1-4 | Females | 1821.6 | 1791.3 | 1852.4 |
| 1-4 | Males | 2796.4 | 2759.3 | 2833.9 |
| 1-4 | Total | 2316.3 | 2292.2 | 2340.5 |
| 5-9 | Females | 1007.8 | 986.4 | 1029.6 |
| 5-9 | Males | 1378.7 | 1353.5 | 1404.2 |
| 5-9 | Total | 1192.3 | 1175.8 | 1209.0 |
| 10-14 | Females | 561.2 | 545.0 | 577.8 |
| 10-14 | Males | 647.5 | 629.8 | 665.6 |
| 10-14 | Total | 603.7 | 591.7 | 615.9 |
| 15-19 | Females | 430.3 | 416.9 | 444.1 |
| 15-19 | Males | 262.2 | 251.7 | 273.0 |
| 15-19 | Total | 346.8 | 338.2 | 355.5 |
| 20-24 | Females | 369.9 | 358.2 | 381.9 |
| 20-24 | Males | 215.2 | 206.3 | 224.4 |
| 20-24 | Total | 292.5 | 285.2 | 300.0 |
| 25-29 | Females | 385.2 | 373.6 | 397.1 |
| 25-29 | Males | 244.2 | 235.0 | 253.5 |
| 25-29 | Total | 313.8 | 306.4 | 321.3 |
| 30-34 | Females | 401.6 | 389.9 | 413.6 |
| 30-34 | Males | 270.4 | 260.8 | 280.2 |
| 30-34 | Total | 335.7 | 328.1 | 343.4 |
| 35-39 | Females | 430.9 | 418.6 | 443.4 |
| 35-39 | Males | 278.3 | 268.6 | 288.3 |
| 35-39 | Total | 354.2 | 346.4 | 362.2 |
| 40-44 | Females | 424.8 | 412.9 | 437.0 |
| 40-44 | Males | 273.6 | 264.3 | 283.3 |
| 40-44 | Total | 347.8 | 340.2 | 355.5 |
| 45-49 | Females | 415.4 | 404.1 | 426.9 |
| 45-49 | Males | 268.5 | 259.7 | 277.5 |
| 45-49 | Total | 339.8 | 332.6 | 347.0 |
| 50-54 | Females | 389.5 | 378.7 | 400.6 |
| 50-54 | Males | 276.6 | 267.7 | 285.8 |
| 50-54 | Total | 331.8 | 324.8 | 338.9 |
| 55-59 | Females | 402.7 | 391.1 | 414.7 |
| 55-59 | Males | 280.3 | 270.7 | 290.1 |
| 55-59 | Total | 340.9 | 333.4 | 348.6 |
| 60-64 | Females | 450.4 | 437.0 | 464.0 |
| 60-64 | Males | 304.5 | 293.7 | 315.7 |
| 60-64 | Total | 376.1 | 367.5 | 384.8 |
| 65-69 | Females | 476.3 | 460.9 | 492.2 |
| 65-69 | Males | 354.7 | 341.4 | 368.4 |
| 65-69 | Total | 415.3 | 405.1 | 425.7 |
| 70-74 | Females | 473.3 | 455.5 | 491.6 |
| 70-74 | Males | 365.3 | 349.4 | 381.8 |
| 70-74 | Total | 420.6 | 408.6 | 432.9 |
| 75-79 | Females | 486.0 | 466.1 | 506.5 |
| 75-79 | Males | 387.1 | 368.2 | 406.8 |
| 75-79 | Total | 440.9 | 427.0 | 455.1 |
| 80-84 | Females | 449.3 | 428.5 | 471.0 |
| 80-84 | Males | 414.1 | 391.2 | 438.0 |
| 80-84 | Total | 434.1 | 418.6 | 450.0 |
| 85+ | Females | 403.4 | 385.7 | 421.7 |
| 85+ | Males | 395.3 | 371.1 | 420.7 |
| 85+ | Total | 400.6 | 386.3 | 415.4 |
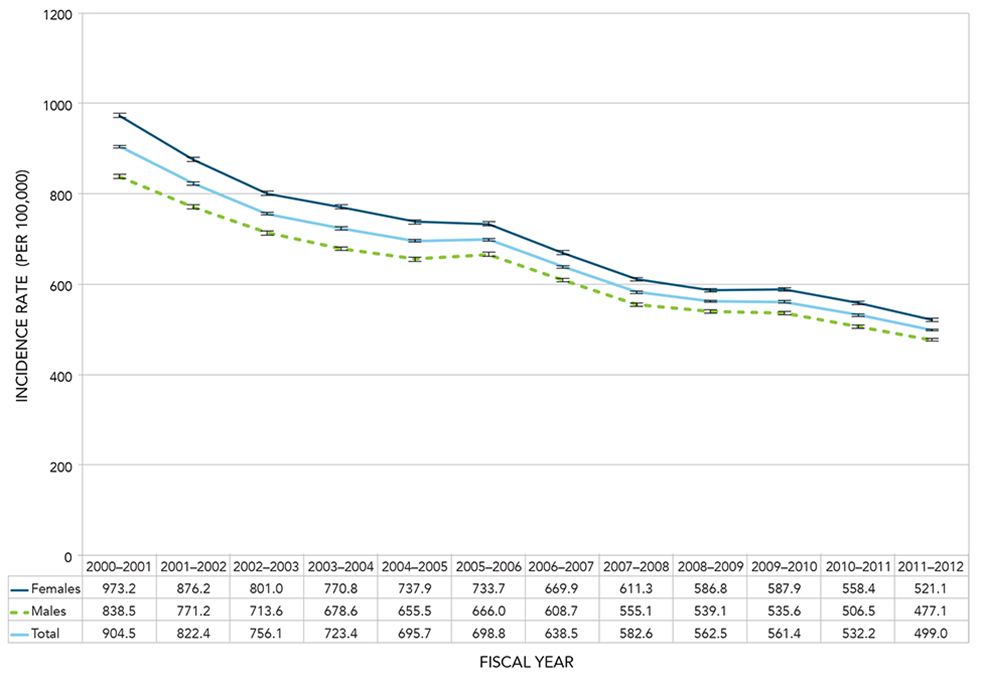
The age-standardized incidence rates for asthma declined from 904.5 per 100,000 population in 2000-2001 to 499.0 per 100,000 population in 2011-2012; a relative decrease of 44.8%. The rates for both males and females decreased over this period (from 838.5 to 477.1 and from 973.2 to 521.1 cases per 100,000 population, respectively); rates for females were consistently higher than for males (Figure 1.8).
Figure 1.8 Age-standardized incidence rates of diagnosed asthma among Canadians aged one year and older, by sex and year, Canada, 2000-2001 to 2011-2012
Notes: Age-standardized to the 2011 Canadian population. The 95% confidence interval shows an estimated range of values which is likely to include the true value 19 times out of 20.
Source: Public Health Agency of Canada, using Canadian Chronic Disease Surveillance System data files contributed by provinces and territories.
Figure 1.8 - Text equivalent
| Fiscal Year | Sex | Age-standardized Incidence rate (per 100,000) | 95% Lower confidence interval | 95% Upper confidence interval |
|---|---|---|---|---|
| 2000-2001 | Females | 973.2 | 968.1 | 978.3 |
| 2000-2001 | Males | 838.5 | 833.7 | 843.2 |
| 2000-2001 | Total | 904.5 | 901.1 | 908.0 |
| 2001-2002 | Females | 876.2 | 871.4 | 881.0 |
| 2001-2002 | Males | 771.2 | 766.7 | 775.7 |
| 2001-2002 | Total | 822.4 | 819.2 | 825.7 |
| 2002-2003 | Females | 801.0 | 796.4 | 805.6 |
| 2002-2003 | Males | 713.6 | 709.2 | 717.9 |
| 2002-2003 | Total | 756.1 | 752.9 | 759.2 |
| 2003-2004 | Females | 770.8 | 766.3 | 775.3 |
| 2003-2004 | Males | 678.6 | 674.4 | 682.9 |
| 2003-2004 | Total | 723.4 | 720.3 | 726.4 |
| 2004-2005 | Females | 737.9 | 733.6 | 742.3 |
| 2004-2005 | Males | 655.5 | 651.4 | 659.7 |
| 2004-2005 | Total | 695.7 | 692.7 | 698.7 |
| 2005-2006 | Females | 733.7 | 729.4 | 738.0 |
| 2005-2006 | Males | 666.0 | 661.9 | 670.2 |
| 2005-2006 | Total | 698.8 | 695.8 | 701.8 |
| 2006-2007 | Females | 669.9 | 665.8 | 674.1 |
| 2006-2007 | Males | 608.7 | 604.7 | 612.6 |
| 2006-2007 | Total | 638.5 | 635.6 | 641.3 |
| 2007-2008 | Females | 611.3 | 607.4 | 615.2 |
| 2007-2008 | Males | 555.1 | 551.3 | 558.8 |
| 2007-2008 | Total | 582.6 | 579.9 | 585.3 |
| 2008-2009 | Females | 586.8 | 583.0 | 590.7 |
| 2008-2009 | Males | 539.1 | 535.4 | 542.8 |
| 2008-2009 | Total | 562.5 | 559.9 | 565.2 |
| 2009-2010 | Females | 587.9 | 584.1 | 591.7 |
| 2009-2010 | Males | 535.6 | 532.0 | 539.3 |
| 2009-2010 | Total | 561.4 | 558.8 | 564.1 |
| 2010-2011 | Females | 558.4 | 554.7 | 562.1 |
| 2010-2011 | Males | 506.5 | 503.0 | 510.0 |
| 2010-2011 | Total | 532.2 | 529.6 | 534.7 |
| 2011-2012 | Females | 521.1 | 517.6 | 524.7 |
| 2011-2012 | Males | 477.1 | 473.7 | 480.5 |
| 2011-2012 | Total | 499.0 | 496.5 | 501.4 |
Between 2000-2001 and 2011-2012, age-specific incidence rates for asthma showed a decline in all age groups (Figure 1.9). The largest relative decreases were observed in the age groups: 20-29 (54.9%), 70-79 (51.8%), and 10-19 (50.5%).
Figure 1.9 Incidence rates of diagnosed asthma among Canadians aged one year and older, by ten year age group and year, Canada, 2000-2001 to 2011-2012
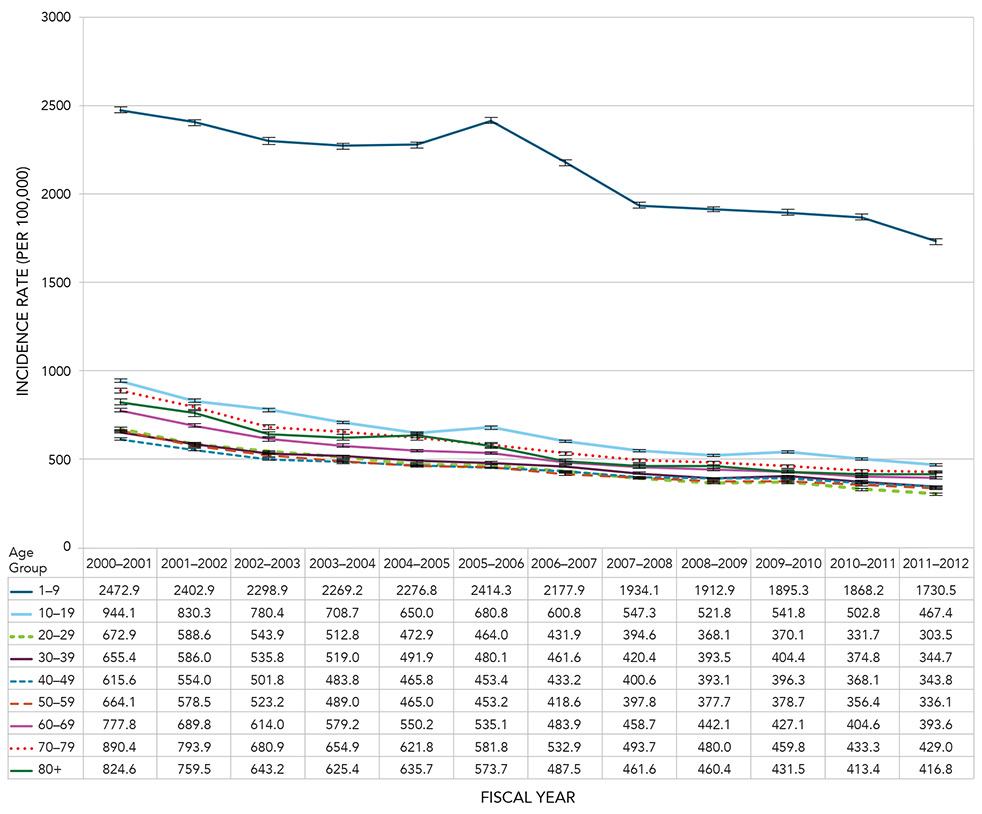
Notes: The 95% confidence interval shows an estimated range of values which is likely to include the true value 19 times out of 20. Crude estimates were based on randomly rounded counts to an adjacent multiple of 10 while age-standardized estimates were based on unrounded counts; therefore the total counts used for crude, age-specific and age-standardized estimates will differ.
Source: Public Health Agency of Canada, using Canadian Chronic Disease Surveillance System data files contributed by provinces and territories.
Figure 1.9 - Text equivalent
| Age Group (Years) | Fiscal Year | Incidence Rate (per 100,000) | 95% Lower confidence interval | 95% Upper confidence interval |
|---|---|---|---|---|
| 1-9 | 2000-2001 | 2472.9 | 2455.6 | 2490.3 |
| 1-9 | 2001-2002 | 2402.9 | 2385.6 | 2420.3 |
| 1-9 | 2002-2003 | 2298.9 | 2281.8 | 2316.1 |
| 1-9 | 2003-2004 | 2269.2 | 2252.1 | 2286.4 |
| 1-9 | 2004-2005 | 2276.8 | 2259.6 | 2294.2 |
| 1-9 | 2005-2006 | 2414.3 | 2396.6 | 2432.2 |
| 1-9 | 2006-2007 | 2177.9 | 2161.0 | 2194.9 |
| 1-9 | 2007-2008 | 1934.1 | 1918.3 | 1950.0 |
| 1-9 | 2008-2009 | 1912.9 | 1897.3 | 1928.6 |
| 1-9 | 2009-2010 | 1895.3 | 1879.9 | 1910.8 |
| 1-9 | 2010-2011 | 1868.2 | 1853.1 | 1883.4 |
| 1-9 | 2011-2012 | 1730.5 | 1716.1 | 1745.0 |
| 10-19 | 2000-2001 | 944.1 | 934.4 | 953.8 |
| 10-19 | 2001-2002 | 830.3 | 821.3 | 839.4 |
| 10-19 | 2002-2003 | 780.4 | 771.6 | 789.3 |
| 10-19 | 2003-2004 | 708.7 | 700.3 | 717.2 |
| 10-19 | 2004-2005 | 650.0 | 641.8 | 658.2 |
| 10-19 | 2005-2006 | 680.8 | 672.4 | 689.2 |
| 10-19 | 2006-2007 | 600.8 | 592.9 | 608.8 |
| 10-19 | 2007-2008 | 547.3 | 539.7 | 555.0 |
| 10-19 | 2008-2009 | 521.8 | 514.3 | 529.4 |
| 10-19 | 2009-2010 | 541.8 | 534.1 | 549.5 |
| 10-19 | 2010-2011 | 502.8 | 495.3 | 510.3 |
| 10-19 | 2011-2012 | 467.4 | 460.2 | 474.8 |
| 20-29 | 2000-2001 | 672.9 | 664.9 | 681.0 |
| 20-29 | 2001-2002 | 588.6 | 581.1 | 596.2 |
| 20-29 | 2002-2003 | 543.9 | 536.7 | 551.2 |
| 20-29 | 2003-2004 | 512.8 | 505.9 | 519.9 |
| 20-29 | 2004-2005 | 472.9 | 466.3 | 479.6 |
| 20-29 | 2005-2006 | 464.0 | 457.4 | 470.6 |
| 20-29 | 2006-2007 | 431.9 | 425.6 | 438.3 |
| 20-29 | 2007-2008 | 394.6 | 388.6 | 400.8 |
| 20-29 | 2008-2009 | 368.1 | 362.3 | 374.0 |
| 20-29 | 2009-2010 | 370.1 | 364.3 | 376.0 |
| 20-29 | 2010-2011 | 331.7 | 326.2 | 337.3 |
| 20-29 | 2011-2012 | 303.5 | 298.3 | 308.8 |
| 30-39 | 2000-2001 | 655.4 | 648.2 | 662.7 |
| 30-39 | 2001-2002 | 586.0 | 579.2 | 593.0 |
| 30-39 | 2002-2003 | 535.8 | 529.1 | 542.5 |
| 30-39 | 2003-2004 | 519.0 | 512.4 | 525.7 |
| 30-39 | 2004-2005 | 491.9 | 485.4 | 498.5 |
| 30-39 | 2005-2006 | 480.1 | 473.6 | 486.6 |
| 30-39 | 2006-2007 | 461.6 | 455.2 | 468.0 |
| 30-39 | 2007-2008 | 420.4 | 414.3 | 426.5 |
| 30-39 | 2008-2009 | 393.5 | 387.6 | 399.5 |
| 30-39 | 2009-2010 | 404.4 | 398.4 | 410.4 |
| 30-39 | 2010-2011 | 374.8 | 369.1 | 380.6 |
| 30-39 | 2011-2012 | 344.7 | 339.2 | 350.2 |
| 40-49 | 2000-2001 | 615.6 | 608.7 | 622.5 |
| 40-49 | 2001-2002 | 554.0 | 547.5 | 560.5 |
| 40-49 | 2002-2003 | 501.8 | 495.7 | 508.0 |
| 40-49 | 2003-2004 | 483.8 | 477.9 | 489.9 |
| 40-49 | 2004-2005 | 465.8 | 460.0 | 471.7 |
| 40-49 | 2005-2006 | 453.4 | 447.7 | 459.2 |
| 40-49 | 2006-2007 | 433.2 | 427.6 | 438.9 |
| 40-49 | 2007-2008 | 400.6 | 395.1 | 406.2 |
| 40-49 | 2008-2009 | 393.1 | 387.7 | 398.7 |
| 40-49 | 2009-2010 | 396.3 | 390.8 | 401.9 |
| 40-49 | 2010-2011 | 368.1 | 362.8 | 373.5 |
| 40-49 | 2011-2012 | 343.8 | 338.6 | 349.0 |
| 50-59 | 2000-2001 | 664.1 | 655.8 | 672.6 |
| 50-59 | 2001-2002 | 578.5 | 570.8 | 586.2 |
| 50-59 | 2002-2003 | 523.2 | 516.0 | 530.4 |
| 50-59 | 2003-2004 | 489.0 | 482.2 | 495.9 |
| 50-59 | 2004-2005 | 465.0 | 458.5 | 471.6 |
| 50-59 | 2005-2006 | 453.2 | 446.8 | 459.6 |
| 50-59 | 2006-2007 | 418.6 | 412.6 | 424.8 |
| 50-59 | 2007-2008 | 397.8 | 391.9 | 403.7 |
| 50-59 | 2008-2009 | 377.7 | 372.0 | 383.4 |
| 50-59 | 2009-2010 | 378.7 | 373.1 | 384.4 |
| 50-59 | 2010-2011 | 356.4 | 351.1 | 361.8 |
| 50-59 | 2011-2012 | 336.1 | 331.0 | 341.3 |
| 60-69 | 2000-2001 | 777.8 | 766.6 | 789.2 |
| 60-69 | 2001-2002 | 689.8 | 679.3 | 700.4 |
| 60-69 | 2002-2003 | 614.0 | 604.2 | 623.9 |
| 60-69 | 2003-2004 | 579.2 | 569.8 | 588.6 |
| 60-69 | 2004-2005 | 550.2 | 541.2 | 559.3 |
| 60-69 | 2005-2006 | 535.1 | 526.3 | 543.9 |
| 60-69 | 2006-2007 | 483.9 | 475.8 | 492.1 |
| 60-69 | 2007-2008 | 458.7 | 451.0 | 466.5 |
| 60-69 | 2008-2009 | 442.1 | 434.7 | 449.6 |
| 60-69 | 2009-2010 | 427.1 | 420.0 | 434.3 |
| 60-69 | 2010-2011 | 404.6 | 397.8 | 411.5 |
| 60-69 | 2011-2012 | 393.6 | 387.0 | 400.2 |
| 70-79 | 2000-2001 | 890.4 | 876.6 | 904.3 |
| 70-79 | 2001-2002 | 793.9 | 780.9 | 807.0 |
| 70-79 | 2002-2003 | 680.9 | 669.0 | 693.1 |
| 70-79 | 2003-2004 | 654.9 | 643.2 | 666.8 |
| 70-79 | 2004-2005 | 621.8 | 610.4 | 633.4 |
| 70-79 | 2005-2006 | 581.8 | 570.8 | 592.9 |
| 70-79 | 2006-2007 | 532.9 | 522.4 | 543.5 |
| 70-79 | 2007-2008 | 493.7 | 483.7 | 503.9 |
| 70-79 | 2008-2009 | 480.0 | 470.1 | 490.0 |
| 70-79 | 2009-2010 | 459.8 | 450.2 | 469.6 |
| 70-79 | 2010-2011 | 433.3 | 424.1 | 442.7 |
| 70-79 | 2011-2012 | 429.0 | 419.9 | 438.3 |
| 80+ | 2000-2001 | 824.6 | 806.8 | 842.7 |
| 80+ | 2001-2002 | 759.5 | 742.8 | 776.6 |
| 80+ | 2002-2003 | 643.2 | 628.1 | 658.6 |
| 80+ | 2003-2004 | 625.4 | 610.8 | 640.3 |
| 80+ | 2004-2005 | 635.7 | 621.2 | 650.5 |
| 80+ | 2005-2006 | 573.7 | 560.1 | 587.5 |
| 80+ | 2006-2007 | 487.5 | 475.2 | 500.0 |
| 80+ | 2007-2008 | 461.6 | 449.8 | 473.6 |
| 80+ | 2008-2009 | 460.4 | 448.8 | 472.2 |
| 80+ | 2009-2010 | 431.5 | 420.4 | 442.8 |
| 80+ | 2010-2011 | 413.4 | 402.7 | 424.3 |
| 80+ | 2011-2012 | 416.8 | 406.2 | 427.5 |
In 2011-2012, the incidence of asthma varied across provinces and territories. The highest rates were in Yukon, Manitoba and Ontario; all exceeded the rate for Canada as a whole. The lowest rates were in New Brunswick, the Northwest Territories and Nunavut (Figure 1.10).
Figure 1.10 Age-standardized incidence rates of diagnosed asthma among Canadians aged one year and older, by sex and province/territory, Canada, 2011-2012
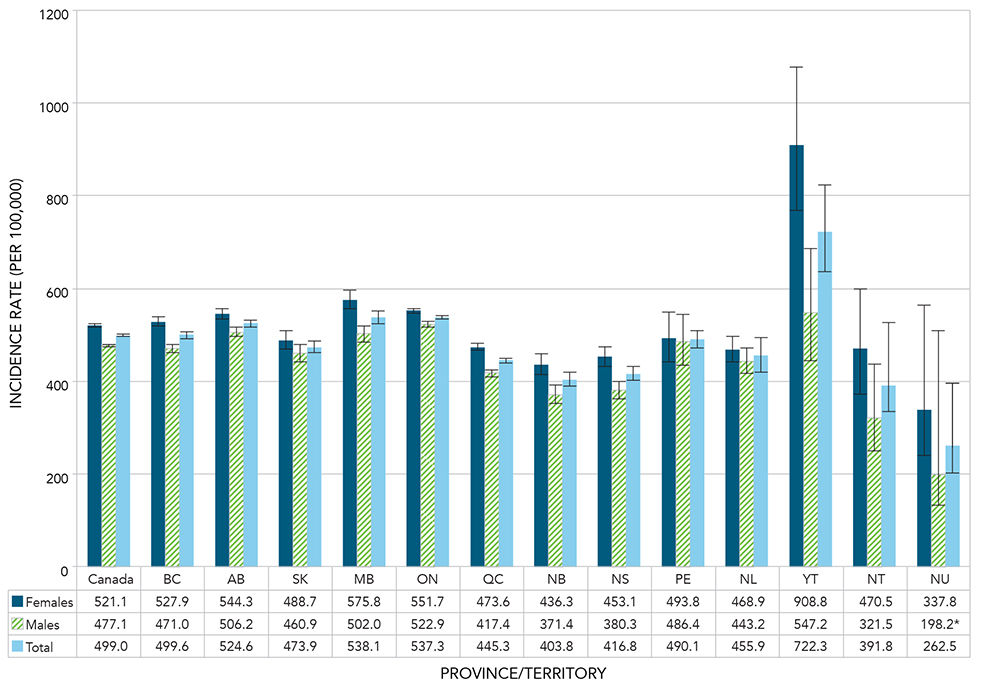
Notes: Age-standardized to the 2011 Canadian population. *Interpret with caution; coefficient of variation between 16.6% and 33.3%. The 95% confidence interval shows an estimated range of values which is likely to include the true value 19 times out of 20.
Source: Public Health Agency of Canada, using Canadian Chronic Disease Surveillance System data files contributed by provinces and territories.
Figure 1.10 - Text equivalent
| Province or territory | Sex | Age-standardized Incidence rate (per 100,000) | 95% Lower confidence interval | 95% Upper confidence interval |
|---|---|---|---|---|
| Canada | Females | 521.1 | 517.6 | 524.7 |
| Canada | Males | 477.1 | 473.7 | 480.5 |
| Canada | Total | 499.0 | 496.5 | 501.4 |
| British Columbia | Females | 527.9 | 518.1 | 537.9 |
| British Columbia | Males | 471.0 | 461.7 | 480.5 |
| British Columbia | Total | 499.6 | 492.8 | 506.4 |
| Alberta | Females | 544.3 | 533.4 | 555.4 |
| Alberta | Males | 506.2 | 495.9 | 516.7 |
| Alberta | Total | 524.6 | 517.1 | 532.1 |
| Saskatchewan | Females | 488.7 | 469.6 | 508.5 |
| Saskatchewan | Males | 460.9 | 442.9 | 479.6 |
| Saskatchewan | Total | 473.9 | 460.7 | 487.3 |
| Manitoba | Females | 575.8 | 556.5 | 595.7 |
| Manitoba | Males | 502.0 | 484.2 | 520.3 |
| Manitoba | Total | 538.1 | 525.0 | 551.5 |
| Ontario | Females | 551.7 | 545.9 | 557.6 |
| Ontario | Males | 522.9 | 517.2 | 528.7 |
| Ontario | Total | 537.3 | 533.2 | 541.4 |
| Quebec | Females | 473.6 | 466.5 | 480.8 |
| Quebec | Males | 417.4 | 410.8 | 424.2 |
| Quebec | Total | 445.3 | 440.4 | 450.2 |
| New Brunswick | Females | 436.3 | 414.3 | 459.2 |
| New Brunswick | Males | 371.4 | 351.0 | 392.7 |
| New Brunswick | Total | 403.8 | 388.8 | 419.3 |
| Nova Scotia | Females | 453.1 | 433.1 | 473.9 |
| Nova Scotia | Males | 380.3 | 361.8 | 399.6 |
| Nova Scotia | Total | 416.8 | 403.1 | 430.9 |
| Prince Edward Island | Females | 493.8 | 442.2 | 549.9 |
| Prince Edward Island | Males | 486.4 | 434.2 | 543.4 |
| Prince Edward Island | Total | 490.1 | 453.2 | 529.4 |
| Newfoundland and Labrador | Females | 468.9 | 441.4 | 497.7 |
| Newfoundland and Labrador | Males | 443.2 | 416.4 | 471.4 |
| Newfoundland and Labrador | Total | 455.9 | 436.6 | 475.8 |
| Yukon | Females | 908.8 | 768.3 | 1077.3 |
| Yukon | Males | 547.2 | 444.2 | 684.9 |
| Yukon | Total | 722.3 | 635.1 | 824.2 |
| Northwest Territories | Females | 470.5 | 373.1 | 600.0 |
| Northwest Territories | Males | 321.5 | 250.5 | 435.8 |
| Northwest Territories | Total | 391.8 | 331.4 | 468.8 |
| Nunavut | Females | 337.8 | 241.3 | 562.9 |
| Nunavut | Males | 198.2Figure 1.10 Footnote * | 132.1 | 508.7 |
| Nunavut | Total | 262.5 | 204.3 | 396.9 |
|
||||
All-cause Mortality
Throughout the observation period (2000-2001 to 2011-2012), all-cause mortality was consistently higher among Canadians aged one year and older with asthma compared to those without, with rate ratios ranging from 1.4 to 1.5 (Figure 1.11). During the same period, mortality rates among those living with asthma declined from 11.2 per 1,000 in 2000-2001 to 8.4 per 1,000 in 2011-2012.
Figure 1.11 Age-standardized all-cause mortality rates and rate ratios among Canadians aged one year and older with diagnosed asthma compared to those without diagnosed asthma, by year, Canada, 2000-2001 to 2011-2012
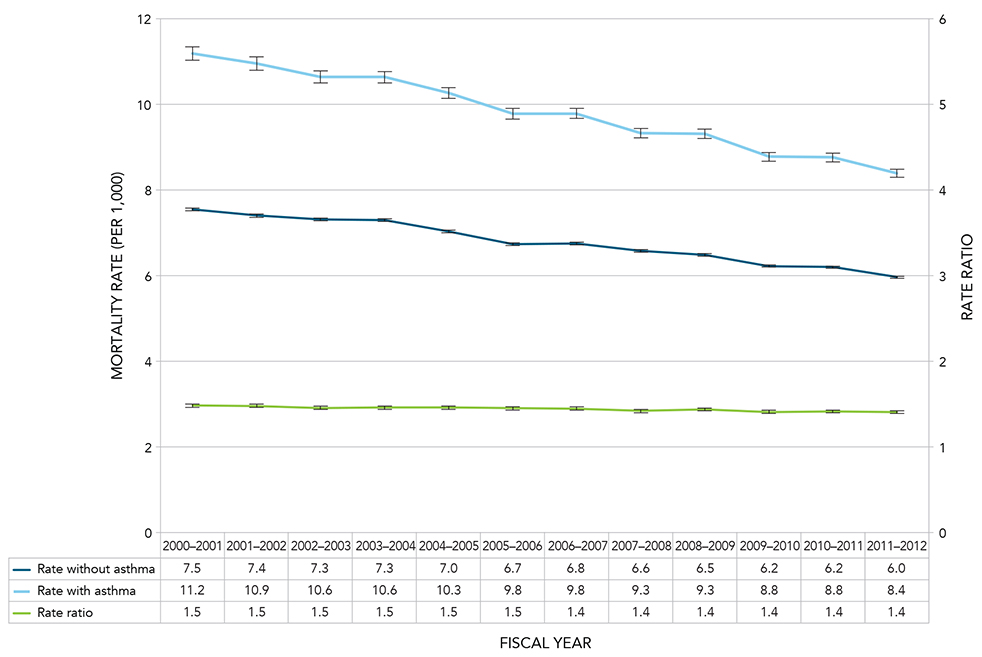
Notes: Age-standardized to the 2011 Canadian population. The 95% confidence interval shows an estimated range of values which is likely to include the true value 19 times out of 20.
Source: Public Health Agency of Canada, using Canadian Chronic Disease Surveillance System data files contributed by provinces and territories.
Figure 1.11 - Text equivalent
| Fiscal Year | Age-standardized all-cause Mortality Rate (without Asthma) | 95% Lower confidence interval | 95% Upper confidence interval | Age-standardized all-cause Mortality Rate (with Asthma) | 95% Lower confidence interval | 95% Upper confidence interval | Rate Ratio | 95% Lower confidence interval | 95% Upper confidence interval |
|---|---|---|---|---|---|---|---|---|---|
| 2000-2001 | 7.5 | 7.5 | 7.6 | 11.2 | 11.0 | 11.3 | 1.5 | 1.5 | 1.5 |
| 2001-2002 | 7.4 | 7.4 | 7.4 | 10.9 | 10.8 | 11.1 | 1.5 | 1.5 | 1.5 |
| 2002-2003 | 7.3 | 7.3 | 7.3 | 10.6 | 10.5 | 10.8 | 1.5 | 1.4 | 1.5 |
| 2003-2004 | 7.3 | 7.3 | 7.3 | 10.6 | 10.5 | 10.8 | 1.5 | 1.4 | 1.5 |
| 2004-2005 | 7.0 | 7.0 | 7.1 | 10.3 | 10.1 | 10.4 | 1.5 | 1.4 | 1.5 |
| 2005-2006 | 6.7 | 6.7 | 6.8 | 9.8 | 9.7 | 9.9 | 1.5 | 1.4 | 1.5 |
| 2006-2007 | 6.8 | 6.7 | 6.8 | 9.8 | 9.7 | 9.9 | 1.4 | 1.4 | 1.5 |
| 2007-2008 | 6.6 | 6.5 | 6.6 | 9.3 | 9.2 | 9.4 | 1.4 | 1.4 | 1.4 |
| 2008-2009 | 6.5 | 6.5 | 6.5 | 9.3 | 9.2 | 9.4 | 1.4 | 1.4 | 1.5 |
| 2009-2010 | 6.2 | 6.2 | 6.3 | 8.8 | 8.7 | 8.9 | 1.4 | 1.4 | 1.4 |
| 2010-2011 | 6.2 | 6.2 | 6.2 | 8.8 | 8.7 | 8.9 | 1.4 | 1.4 | 1.4 |
| 2011-2012 | 6.0 | 5.9 | 6.0 | 8.4 | 8.3 | 8.5 | 1.4 | 1.4 | 1.4 |
In 2011-2012, Canadians living with asthma had a slightly higher all-cause mortality rate compared to those without asthma, the exception to this is those aged 1-4, however the number of deaths in this category is very small. The rate ratios ranged from 0.8 in the 1-4 age group to 2.1 in the 10-14 age group (Figure 1.12).
Figure 1.12 All-cause mortality rates and rate ratios among Canadians aged one year and older with diagnosed asthma compared to those without diagnosed asthma, by age group, Canada, 2011-2012
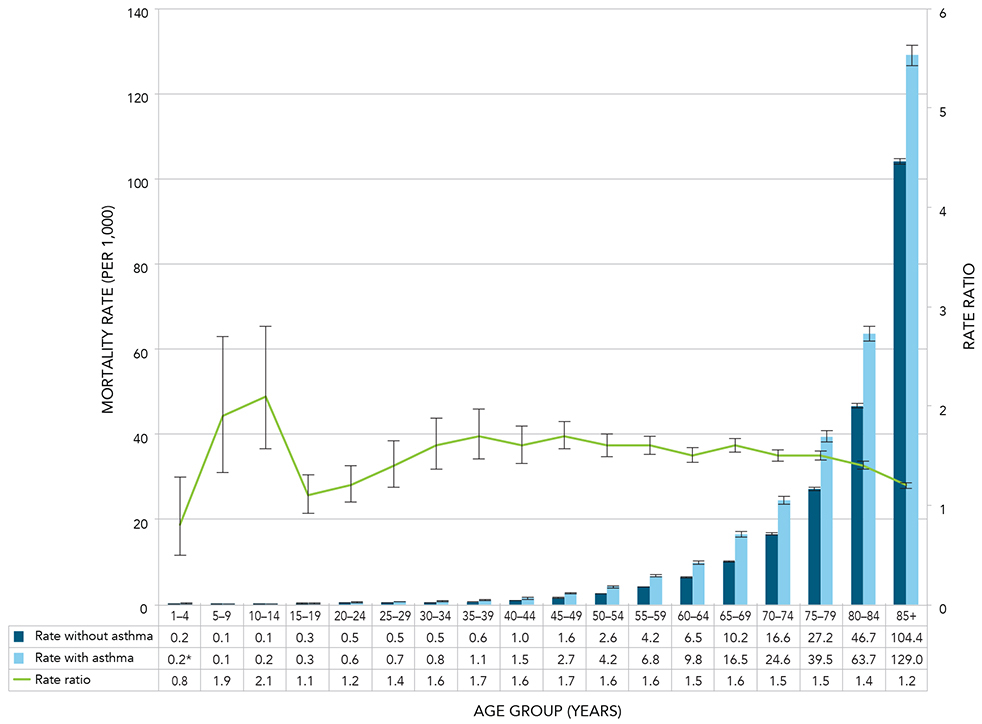
Notes: *Interpret with caution; coefficient of variation between 16.6% and 33.3%. The rate ratios for the age groups 14 years of age and under are reflective of the low number of deaths in these age groups both from all causes and from asthma specifically. The 95% confidence interval shows an estimated range of values which is likely to include the true value 19 times out of 20. Crude estimates were based on randomly rounded counts to an adjacent multiple of 10 while age-standardized estimates were based on unrounded counts; therefore the total counts used for crude, age-specific and age-standardized estimates will differ.
Source: Public Health Agency of Canada, using Canadian Chronic Disease Surveillance System data files contributed by provinces and territories.
Figure 1.12 - Text equivalent
| Age Group (Years) | All-cause Mortality Rate (without Asthma) | 95% Lower confidence interval | 95% Upper confidence interval | All-cause Mortality Rate (with Asthma) | 95% Lower confidence interval Rate | 95% Upper confidence interval Rate | Rate Ratio | 95% Lower confidence interval | 95% Upper confidence interval |
|---|---|---|---|---|---|---|---|---|---|
| 1-4 | 0.2 | 0.2 | 0.3 | 0.2Figure 1.12 Footnote * | 0.1 | 0.3 | 0.8 | 0.5 | 1.3 |
| 5-9 | 0.1 | 0.1 | 0.1 | 0.1 | 0.1 | 0.2 | 1.9 | 1.3 | 2.7 |
| 10-14 | 0.1 | 0.1 | 0.1 | 0.2 | 0.1 | 0.2 | 2.1 | 1.6 | 2.8 |
| 15-19 | 0.3 | 0.3 | 0.3 | 0.3 | 0.3 | 0.4 | 1.1 | 0.9 | 1.3 |
| 20-24 | 0.5 | 0.4 | 0.5 | 0.6 | 0.5 | 0.6 | 1.2 | 1.0 | 1.4 |
| 25-29 | 0.5 | 0.4 | 0.5 | 0.7 | 0.6 | 0.8 | 1.4 | 1.2 | 1.7 |
| 30-34 | 0.5 | 0.5 | 0.5 | 0.8 | 0.7 | 0.9 | 1.6 | 1.4 | 1.9 |
| 35-39 | 0.6 | 0.6 | 0.7 | 1.1 | 1.0 | 1.3 | 1.7 | 1.5 | 2.0 |
| 40-44 | 1.0 | 0.9 | 1.0 | 1.5 | 1.4 | 1.7 | 1.6 | 1.4 | 1.8 |
| 45-49 | 1.6 | 1.5 | 1.6 | 2.7 | 2.5 | 2.9 | 1.7 | 1.5 | 1.8 |
| 50-54 | 2.6 | 2.5 | 2.6 | 4.2 | 4.0 | 4.5 | 1.6 | 1.5 | 1.8 |
| 55-59 | 4.2 | 4.1 | 4.2 | 6.8 | 6.4 | 7.1 | 1.6 | 1.5 | 1.7 |
| 60-64 | 6.5 | 6.4 | 6.6 | 9.8 | 9.3 | 10.2 | 1.5 | 1.4 | 1.6 |
| 65-69 | 10.2 | 10.0 | 10.3 | 16.5 | 15.8 | 17.1 | 1.6 | 1.6 | 1.7 |
| 70-74 | 16.6 | 16.3 | 16.8 | 24.6 | 23.7 | 25.5 | 1.5 | 1.4 | 1.5 |
| 75-79 | 27.2 | 26.8 | 27.5 | 39.5 | 38.2 | 40.7 | 1.5 | 1.4 | 1.5 |
| 80-84 | 46.7 | 46.2 | 47.2 | 63.7 | 61.9 | 65.4 | 1.4 | 1.3 | 1.4 |
| 85+ | 104.4 | 103.6 | 105.1 | 129.0 | 126.6 | 131.5 | 1.2 | 1.2 | 1.3 |
|
|||||||||
Comorbidity
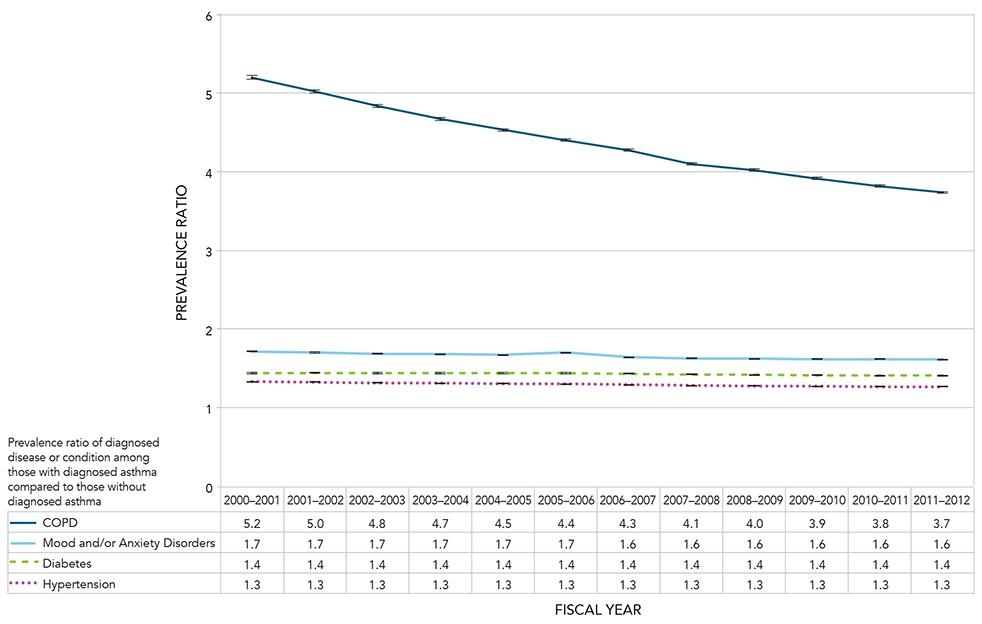
Four major chronic diseases and conditions - COPD, mood and/or anxiety disorders,Footnote a diabetes and hypertension - were examined for their prevalence among those with diagnosed asthma compared to those without diagnosed asthma for the years 2000-2001 to 2011-2012 (Figure 1.13).Footnote b
Age group comparisons varied with the comorbid disease or condition: age one year and older for diabetes and mood and/or anxiety disorders comparisons, age 20 years and older for hypertension and age 35 years and older for COPD.
The prevalence of each of the comorbid diseases or conditions examined was higher among those with diagnosed asthma than those without. The prevalence ratios for diabetes and hypertension remained constant at 1.4 and 1.3 respectively throughout the observation period. During this time, the prevalence ratios for mood and/or anxiety disorders ranged from 1.6 to 1.7 and COPD prevalence ratios ranged from 5.3 to 3.7 (Figure 1.13).
The higher prevalence ratio for COPD compared to the other comorbid diseases or conditions presented indicates that there are much larger differences in the proportions of COPD among those living with asthma compared to the proportions of COPD among those without asthma. The declining prevalence ratio for COPD during the observation period suggests that the difference between these proportions is getting smaller.
Figure 1.13 Age-standardized prevalence ratios of diagnosed COPD, mood and/or anxiety disorders, diabetes and hypertension among those with or without diagnosed asthma, by year, Canada, 2000-2001 to 2011-2012
Notes: Age-standardized to the 2011 Canadian population. The 95% confidence interval shows an estimated range of values which is likely to include the true value 19 times out of 20.
Source: Public Health Agency of Canada, using Canadian Chronic Disease Surveillance System data files contributed by provinces and territories.
Figure 1.13 - Text equivalent
| Fiscal Year | Age-standardized Prevalence Ratio of COPD among those with diagnosed asthma compared to those without diagnosed asthma | 95% Lower confidence interval | 95% Upper confidence interval | Age-standardized Prevalence Ratio of mood and/or anxiety disorders among those with diagnosed asthma compared to those without diagnosed asthma | 95% Lower confidence interval | 95% Upper confidence interval | Age-standardized Prevalence Ratio of diabetes among those with diagnosed asthma compared to those without diagnosed asthma | 95% Lower confidence interval | 95% Upper confidence interval | Age-standardized Prevalence Ratio of hypertension among those with diagnosed asthma compared to those without diagnosed asthma | 95% Lower confidence interval | 95% Upper confidence interval |
|---|---|---|---|---|---|---|---|---|---|---|---|---|
| 2000-2001 | 5.2 | 5.2 | 5.3 | 1.7 | 1.7 | 1.7 | 1.4 | 1.4 | 1.5 | 1.3 | 1.3 | 1.3 |
| 2001-2002 | 5.0 | 5.0 | 5.0 | 1.7 | 1.7 | 1.7 | 1.4 | 1.4 | 1.5 | 1.3 | 1.3 | 1.3 |
| 2002-2003 | 4.8 | 4.8 | 4.9 | 1.7 | 1.7 | 1.7 | 1.4 | 1.4 | 1.4 | 1.3 | 1.3 | 1.3 |
| 2003-2004 | 4.7 | 4.7 | 4.7 | 1.7 | 1.7 | 1.7 | 1.4 | 1.4 | 1.4 | 1.3 | 1.3 | 1.3 |
| 2004-2005 | 4.5 | 4.5 | 4.5 | 1.7 | 1.7 | 1.7 | 1.4 | 1.4 | 1.4 | 1.3 | 1.3 | 1.3 |
| 2005-2006 | 4.4 | 4.4 | 4.4 | 1.7 | 1.7 | 1.7 | 1.4 | 1.4 | 1.4 | 1.3 | 1.3 | 1.3 |
| 2006-2007 | 4.3 | 4.3 | 4.3 | 1.6 | 1.6 | 1.6 | 1.4 | 1.4 | 1.4 | 1.3 | 1.3 | 1.3 |
| 2007-2008 | 4.1 | 4.1 | 4.2 | 1.6 | 1.6 | 1.6 | 1.4 | 1.4 | 1.4 | 1.3 | 1.3 | 1.3 |
| 2008-2009 | 4.0 | 4.0 | 4.0 | 1.6 | 1.6 | 1.6 | 1.4 | 1.4 | 1.4 | 1.3 | 1.3 | 1.3 |
| 2009-2010 | 3.9 | 3.9 | 3.9 | 1.6 | 1.6 | 1.6 | 1.4 | 1.4 | 1.4 | 1.3 | 1.3 | 1.3 |
| 2010-2011 | 3.8 | 3.8 | 3.8 | 1.6 | 1.6 | 1.6 | 1.4 | 1.4 | 1.4 | 1.3 | 1.3 | 1.3 |
| 2011-2012 | 3.7 | 3.7 | 3.7 | 1.6 | 1.6 | 1.6 | 1.4 | 1.4 | 1.4 | 1.3 | 1.3 | 1.3 |
Discussion
The incidence rates of asthma declined over the observation period from 904.5 per 100,000 in 2000-2001 to 499.0 per 100,000 in 2011-2012. In 2011-2012, the peak incidence rate was seen in the 1-4 age group with 2796.4 cases per 100,000 population for males and 1821.6 per 100,000 population for females. The higher rates seen in the 1-4 age group may reflect the difficulty in distinguishing asthma from wheezing conditions which will resolve in childhood.Footnote 19 The incidence rates of asthma varied across provinces and territories in 2011-2012, from a high of 722.3 per 100,000 in Yukon to a low of 262.5 per 100,000 in Nunavut.
All-cause mortality rates among Canadians living with asthma have declined from 11.2 per 1,000 in 2000-2001 to 8.4 per 1,000 in 2011-2012. All-cause mortality was consistently higher among those living with asthma compared to those without; rate ratios ranged from 1.4 to 1.5. The decline in all-cause mortality may be due to better treatment and management of disease. However, as the mortality rates also decreased among those without asthma, the rate ratios remained about the same; suggesting potential improvements in care and health status for both groups irrespective of disease status.
Asthma prevalence continued to rise in Canada. The age-standardized prevalence increased over the observation period from 6.5% in 2000-2001 to 10.8% in 2011-2012. Over this time, the prevalence increased in most age groups; the steepest increases were in the 10-19 and 20-29 age groups. The exception was the 1-9 age group where prevalence started declining in 2003-2004. The basis for the declining prevalence in the younger ages is not known and further monitoring and research is required to understand this trend.
Consistent with findings reported in the literature,Footnote 20 2011-2012 CCDSS data demonstrated an increasing prevalence from one year of age to the late teens; with peaks in the 10-14 age group for males and the 15-19 age group for females. It is unclear whether the actual prevalence is lower in young children or if it is a result of children being better diagnosed in the 10 and up age groups as lung function tests perform better with these ages.Footnote 21
In 2011-2012 there was a notable cross-over by gender in asthma prevalence starting at the 25-29 age group. At this age, the prevalence for males became lower than for females and this difference remained through to the older age groups. What accounts for this cross-over is unclear. It may be due in part to males having smaller airways than females at younger ages, followed by maturation leading to anatomical changes (larger airways developing in men) or physiological changes (hormonal differences between men and women), resulting in the prevalence becoming higher for women.Footnote 1Footnote 22Footnote 23 Or, it may be due to the greater likelihood that women, in general, seek care, and encounter the health care system more often than men.Footnote 24
The prevalence of asthma also varied geographically within Canada from a high of 12.1% in Ontario to a low of 3.8% in Nunavut.
Contrary to the steady increase observed in asthma prevalence, there was a slight decline in the active asthma prevalence over time; from 2.8% in 2000-2001 to 2.3% in 2011-2012. This decline could be attributable to an overall improvement in asthma management and control, and thus fewer encounters with the health care system.
Despite the decreases in incidence, the prevalence of asthma continues to rise. This reflects the chronic nature of asthma, as there is a continued accumulation of new incident cases contributing to the prevalence. Even with the dropping incidence rates seen over the observation period, this did not result in a drop in prevalence as the rates of mortality among those living with asthma were also decreasing.
Another possible contributor to the increase in prevalence could be that it reflects an artifact in the data. False positive asthma diagnoses are not detected and therefore not removed, hence accumulating over time. Although the case definition is designed to minimize the false positives as much as possible, they can result from individuals who meet the case definition due to a temporary or episodic problem, such as an infection, but may not be a true asthma case.
It is also important to note that the cases of asthma included in the prevalence have various levels of severity. Cases range from those with episodic problems who are well most of the time to those who have severe problems resulting in many physician encounters. However, the overall severity of asthma in the cohort is likely declining as more, better managed cases enter the cohort and mortality rates of those living with asthma decline.
Four major chronic diseases and conditions (diabetes, hypertension, mood and/or anxiety disorders, and COPD) were examined to estimate their prevalence among those with diagnosed asthma. All four diseases or conditions showed a greater prevalence among those living with asthma than those without. The highest prevalence ratio was for COPD. The high comorbidity of COPD among those living with asthma compared to those without suggests that it is important to consider overlap syndrome.Footnote 25 Asthma and COPD can co-exist or one disease can evolve into the other. One study identified asthma occurring in just over half of those diagnosed with COPD.Footnote 26 Common risk factors between asthma and COPD, such as smoking, likely play a role in the high comorbidity. Finally, misdiagnosis between those conditions is not uncommon.Footnote 27Footnote 28
It is interesting to note that the prevalence ratio for COPD was the only one that decreased over the observation period; from 5.3 in 2000-2001 to 3.7 in 2011-2012. This decrease was the result of a decreasing prevalence of COPD among those with asthma and an increasing prevalence of COPD among those without.
Further examination of asthma trends in Canada is needed. One important question bearing further study is whether declines in asthma incidence are true declines or whether there have been changes in physician practices resulting in fewer individuals being diagnosed with asthma. Related to this question is the variation seen in prevalence and incidence of asthma by province and territory. Such variation could be an indication of geographic differences in environmental or non-environmental risk factors, or diagnostic practices.
Although the causes of asthma are not well understood and there is no cure, asthma can be well controlled by ensuring appropriate medication use as well as eliminating or minimizing risk factors and triggers.Footnote 1 The decrease seen in all-cause mortality rates among Canadians living with asthma could be related to improved disease management.
Continued support of all efforts in the early detection and management of asthma, as well as reduction and elimination of asthma risk factors is necessary for this downward trend in asthma incidence and all-cause mortality to continue. The high co-morbidity of asthma with diabetes, hypertension, mood and/or anxiety disorders, and COPD suggests the treatment and management of asthma requires the consideration of all comorbid diseases and conditions, and vice versa. An integrated care approach can provide optimal primary care and improved quality of life for those with comorbid diseases and conditions.
It should be emphasized that prevention, early diagnosis, management, and education are important at all ages; especially in childhood as a large proportion of asthma onset occurs during these early years. According to the Canadian Asthma Management Consensus Summary 2010:
"Asthma education is an essential component of asthma management for all patients. Guided self-management, combining asthma education, regular medical review, self-assessment and a written action plan have been shown to reduce hospitalizations, emergency visits, urgent physician visits, missed days at work or school, days of restricted activity, and improved pulmonary function in children and in adults."Footnote 29
Chapter 2: Chronic Obstructive Pulmonary Disease
Introduction
Chronic obstructive pulmonary disease (COPD) is a chronic, progressive lung disease which causes limitations in airflow. The Global Initiative for Chronic Obstructive Pulmonary Disease defines COPD as: "a common, preventable, and treatable disease characterized by persistent airflow limitation that is usually progressive and is associated with an enhanced chronic inflammatory response in the airways to noxious particles or gases. Chronic inflammation causes structural changes and narrowing of the small airways in the lungs."Footnote 30 These changes decrease the ability of the lungs to exchange gases and to supply oxygen to the body. Spirometry is the most widely available, reproducible test of lung function measuring airflow limitation.Footnote 4Footnote 30Footnote 31Footnote 32Footnote 33
COPD is a major cause of death and disability worldwide.Footnote 34Footnote 35Footnote 36 The World Health Organization (WHO) estimates COPD to be the third leading cause of death in 2012.Footnote 37 Although, according to the 2013 Global Burden of Disease Study, the age-standardized death rate of COPD has decreased since 1990 from 74.8 per 100,000 to 50.7 per 100,000.Footnote 38 It was the 12th leading cause of global years of life lostFootnote 38 and the eighth cause of years of living with disability.Footnote 39 Although globally, mortality due to COPD remains higher in males, mortality among females is increasing, reflecting the trends in smoking rates among men and women over the last several decades.Footnote 40Footnote 41Footnote 42 In Canada, one study in the province of Ontario reported the lifetime risk of developing COPD as greater than 1 in 4 (27.6%) and higher in men (29.7%) than women (25.6%).Footnote 43
COPD in the Canadian Population
CCDSS Case Definitions
Prevalent COPD Case Definition
The case definition of diagnosed COPD is: an individual aged 35 years and older having at least one visit to a physician with a diagnosis of COPD in the first diagnostic field, or one hospital separation with a diagnosis of COPD in any diagnostic field ever, coded by ICD-9(-CM) 491-492, 496 or ICD-10-CA J41-44. This case definition for COPD was validated by Gershon and colleagues.Footnote 44
Only the first diagnostic field was used in physician billing claims data as not all provinces and territories had more than one diagnostic field. All fields were included from the hospital separation file as this database allows for the recording of up to 25 diagnoses.
Based on this definition, once a case is detected, it is a prevalent case for life regardless of future contact with health services. Consequently, once someone is identified as a case, they are always included in the database as a case. All jurisdictions identified cases occurring as of 1995, with the exception of Quebec which began in 1996 and Nunavut which began in 2005.
Incident COPD Case Definition
Incident COPD cases were identified in the year where an individual met the case definition for the first time. A run-in period of five years, where data were collected and not reported, was employed to partially account for the prevalence pool effect; i.e., to ensure that an incident case was not a pre-existing prevalent case. (For further explanation of prevalence pool effect, please see the glossary).
Denominator Definition
The denominator for the rate and proportion calculations in the report was the number of individuals in the provincial or territorial health insurance registries. Data on all residents who are eligible for provincial or territorial health insurance (about 97% of the Canadian population) are captured in these registries. Individual demographic information is obtained from these registries; age is calculated as of the end of the fiscal year, on March 31.
Prevalence
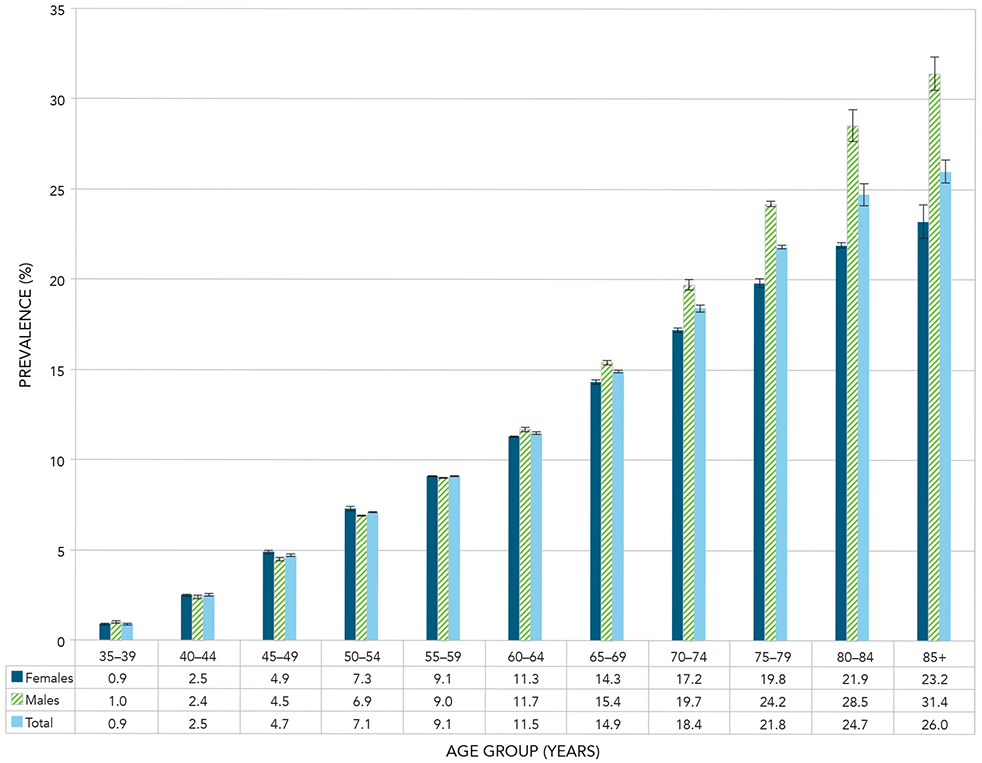
The prevalence of COPD among Canadians aged 35 years and older increased steadily across the life span (Figure 2.1). The prevalence of COPD was similar among males and females until the 60-64 age group, beyond this it was consistently higher among males than females.
Figure 2.1 Prevalence of diagnosed COPD among Canadians aged 35 years and older, by age group and sex, Canada, 2011-2012
Notes: The 95% confidence interval shows an estimated range of values which is likely to include the true value 19 times out of 20. Crude estimates were based on randomly rounded counts to an adjacent multiple of 10 while age-standardized estimates were based on unrounded counts; therefore the total counts used for crude, age-specific and age-standardized estimates will differ.
Source: Public Health Agency of Canada, using Canadian Chronic Disease Surveillance System data files contributed by provinces and territories.
Figure 2.1 - Text equivalent
| Age Group (Years) | Sex | Prevalence (%) | 95% Lower confidence interval | 95% Upper confidence interval |
|---|---|---|---|---|
| 35-39 | Females | 0.9 | 0.9 | 0.9 |
| 35-39 | Males | 1.0 | 0.9 | 1.0 |
| 35-39 | Total | 0.9 | 0.9 | 1.0 |
| 40-44 | Females | 2.5 | 2.5 | 2.6 |
| 40-44 | Males | 2.4 | 2.4 | 2.4 |
| 40-44 | Total | 2.5 | 2.5 | 2.5 |
| 45-49 | Females | 4.9 | 4.8 | 4.9 |
| 45-49 | Males | 4.5 | 4.4 | 4.5 |
| 45-49 | Total | 4.7 | 4.6 | 4.7 |
| 50-54 | Females | 7.3 | 7.3 | 7.3 |
| 50-54 | Males | 6.9 | 6.8 | 6.9 |
| 50-54 | Total | 7.1 | 7.0 | 7.1 |
| 55-59 | Females | 9.1 | 9.1 | 9.2 |
| 55-59 | Males | 9.0 | 9.0 | 9.1 |
| 55-59 | Total | 9.1 | 9.0 | 9.1 |
| 60-64 | Females | 11.3 | 11.2 | 11.4 |
| 60-64 | Males | 11.7 | 11.7 | 11.8 |
| 60-64 | Total | 11.5 | 11.5 | 11.6 |
| 65-69 | Females | 14.3 | 14.3 | 14.4 |
| 65-69 | Males | 15.4 | 15.3 | 15.5 |
| 65-69 | Total | 14.9 | 14.8 | 14.9 |
| 70-74 | Females | 17.2 | 17.1 | 17.3 |
| 70-74 | Males | 19.7 | 19.6 | 19.8 |
| 70-74 | Total | 18.4 | 18.3 | 18.5 |
| 75-79 | Females | 19.8 | 19.7 | 19.9 |
| 75-79 | Males | 24.2 | 24.1 | 24.3 |
| 75-79 | Total | 21.8 | 21.7 | 21.9 |
| 80-84 | Females | 21.9 | 21.8 | 22.1 |
| 80-84 | Males | 28.5 | 28.3 | 28.7 |
| 80-84 | Total | 24.7 | 24.6 | 24.8 |
| 85+ | Females | 23.2 | 23.1 | 23.3 |
| 85+ | Males | 31.4 | 31.2 | 31.6 |
| 85+ | Total | 26.0 | 25.9 | 26.1 |
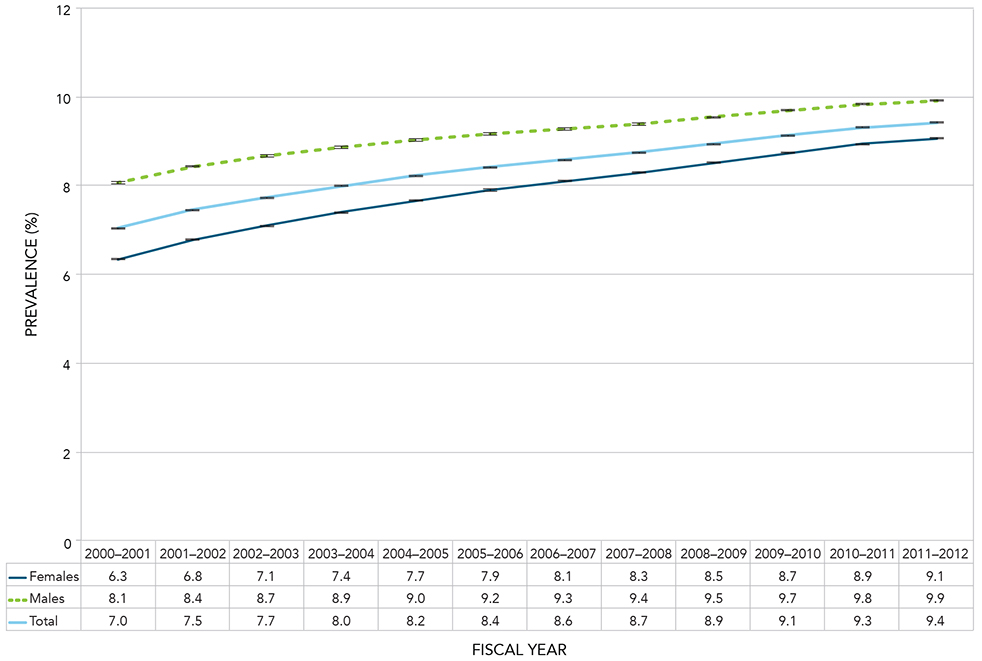
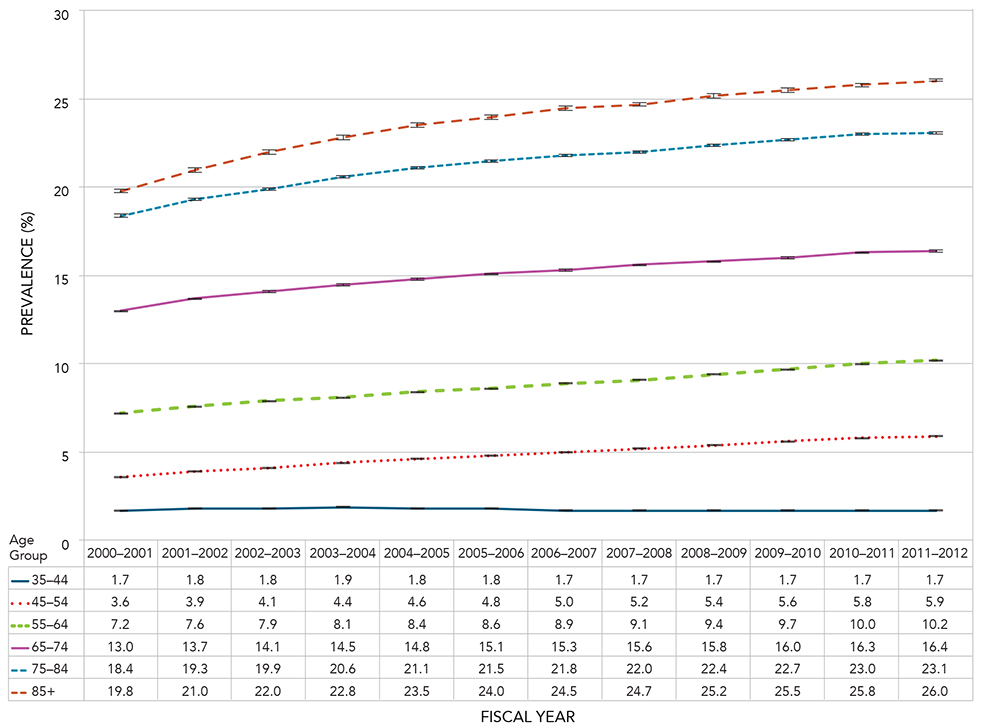
During the observation period, the relative increase in the age-standardized prevalence of COPD was 33.6% among all Canadians aged 35 years and over; from 7.0% (1.1 million Canadians) in 2000-2001 to 9.4% (2.0 million Canadians) in 2011-2012 (Figure 2.2). The relative increase in prevalence among females (42.8%) was much more than that for males (22.9%).
Figure 2.2 Age-standardized prevalence of diagnosed COPD among Canadians aged 35 years and older, by sex and year, Canada, 2000-2001 to 2011-2012
Notes: Age-standardized to the 2011 Canadian population. The 95% confidence interval shows an estimated range of values which is likely to include the true value 19 times out of 20.
Source: Public Health Agency of Canada, using Canadian Chronic Disease Surveillance System data files contributed by provinces and territories.
Figure 2.2 - Text equivalent
| Fiscal Year | Sex | Age-standardized Prevalence (%) | 95% Lower confidence interval | 95% Upper confidence interval |
|---|---|---|---|---|
| 2000-2001 | Females | 6.3 | 6.3 | 6.4 |
| 2000-2001 | Males | 8.1 | 8.0 | 8.1 |
| 2000-2001 | Total | 7.0 | 7.0 | 7.1 |
| 2001-2002 | Females | 6.8 | 6.8 | 6.8 |
| 2001-2002 | Males | 8.4 | 8.4 | 8.5 |
| 2001-2002 | Total | 7.5 | 7.4 | 7.5 |
| 2002-2003 | Females | 7.1 | 7.1 | 7.1 |
| 2002-2003 | Males | 8.7 | 8.6 | 8.7 |
| 2002-2003 | Total | 7.7 | 7.7 | 7.7 |
| 2003-2004 | Females | 7.4 | 7.4 | 7.4 |
| 2003-2004 | Males | 8.9 | 8.8 | 8.9 |
| 2003-2004 | Total | 8.0 | 8.0 | 8.0 |
| 2004-2005 | Females | 7.7 | 7.6 | 7.7 |
| 2004-2005 | Males | 9.0 | 9.0 | 9.1 |
| 2004-2005 | Total | 8.2 | 8.2 | 8.2 |
| 2005-2006 | Females | 7.9 | 7.9 | 7.9 |
| 2005-2006 | Males | 9.2 | 9.1 | 9.2 |
| 2005-2006 | Total | 8.4 | 8.4 | 8.4 |
| 2006-2007 | Females | 8.1 | 8.1 | 8.1 |
| 2006-2007 | Males | 9.3 | 9.3 | 9.3 |
| 2006-2007 | Total | 8.6 | 8.6 | 8.6 |
| 2007-2008 | Females | 8.3 | 8.3 | 8.3 |
| 2007-2008 | Males | 9.4 | 9.4 | 9.4 |
| 2007-2008 | Total | 8.7 | 8.7 | 8.8 |
| 2008-2009 | Females | 8.5 | 8.5 | 8.5 |
| 2008-2009 | Males | 9.5 | 9.5 | 9.6 |
| 2008-2009 | Total | 8.9 | 8.9 | 8.9 |
| 2009-2010 | Females | 8.7 | 8.7 | 8.8 |
| 2009-2010 | Males | 9.7 | 9.7 | 9.7 |
| 2009-2010 | Total | 9.1 | 9.1 | 9.1 |
| 2010-2011 | Females | 8.9 | 8.9 | 9.0 |
| 2010-2011 | Males | 9.8 | 9.8 | 9.9 |
| 2010-2011 | Total | 9.3 | 9.3 | 9.3 |
| 2011-2012 | Females | 9.1 | 9.0 | 9.1 |
| 2011-2012 | Males | 9.9 | 9.9 | 9.9 |
| 2011-2012 | Total | 9.4 | 9.4 | 9.4 |
When examining COPD by 10-year age groups, the highest age-specific prevalence was seen in the oldest age group (85 and older) and the lowest prevalence was seen in the youngest age group (35-44 years) [Figure 2.3].
Between 2000-2001 and 2011-2012, an increase in age-specific prevalence of COPD was seen in nearly all age groups with the exception of those aged 35-44 where the proportion remained stable (Figure 2.3).
Figure 2.3 Prevalence of diagnosed COPD among Canadians aged 35 years and older, by 10-year age group and year, Canada, 2000-2001 to 2011-2012
Notes: The 95% confidence interval shows an estimated range of values which is likely to include the true value 19 times out of 20. Crude estimates were based on randomly rounded counts to an adjacent multiple of 10 while age-standardized estimates were based on unrounded counts; therefore the total counts used for crude, age-specific and age-standardized estimates will differ.
Source: Public Health Agency of Canada, using Canadian Chronic Disease Surveillance System data files contributed by provinces and territories.
Figure 2.3 - Text equivalent
| Age Group (Years) | Fiscal Year | Prevalence (%) | 95% Lower confidence interval | 95% Upper confidence interval |
|---|---|---|---|---|
| 35-44 | 2000-2001 | 1.7 | 1.7 | 1.7 |
| 35-44 | 2001-2002 | 1.8 | 1.8 | 1.8 |
| 35-44 | 2002-2003 | 1.8 | 1.8 | 1.8 |
| 35-44 | 2003-2004 | 1.9 | 1.8 | 1.9 |
| 35-44 | 2004-2005 | 1.8 | 1.8 | 1.9 |
| 35-44 | 2005-2006 | 1.8 | 1.8 | 1.8 |
| 35-44 | 2006-2007 | 1.7 | 1.7 | 1.7 |
| 35-44 | 2007-2008 | 1.7 | 1.7 | 1.7 |
| 35-44 | 2008-2009 | 1.7 | 1.7 | 1.7 |
| 35-44 | 2009-2010 | 1.7 | 1.7 | 1.7 |
| 35-44 | 2010-2011 | 1.7 | 1.7 | 1.7 |
| 35-44 | 2011-2012 | 1.7 | 1.7 | 1.7 |
| 45-54 | 2000-2001 | 3.6 | 3.6 | 3.6 |
| 45-54 | 2001-2002 | 3.9 | 3.9 | 3.9 |
| 45-54 | 2002-2003 | 4.1 | 4.1 | 4.2 |
| 45-54 | 2003-2004 | 4.4 | 4.4 | 4.4 |
| 45-54 | 2004-2005 | 4.6 | 4.6 | 4.6 |
| 45-54 | 2005-2006 | 4.8 | 4.8 | 4.8 |
| 45-54 | 2006-2007 | 5.0 | 5.0 | 5.0 |
| 45-54 | 2007-2008 | 5.2 | 5.2 | 5.2 |
| 45-54 | 2008-2009 | 5.4 | 5.4 | 5.4 |
| 45-54 | 2009-2010 | 5.6 | 5.6 | 5.6 |
| 45-54 | 2010-2011 | 5.8 | 5.8 | 5.8 |
| 45-54 | 2011-2012 | 5.9 | 5.9 | 5.9 |
| 55-64 | 2000-2001 | 7.2 | 7.2 | 7.2 |
| 55-64 | 2001-2002 | 7.6 | 7.6 | 7.6 |
| 55-64 | 2002-2003 | 7.9 | 7.8 | 7.9 |
| 55-64 | 2003-2004 | 8.1 | 8.1 | 8.2 |
| 55-64 | 2004-2005 | 8.4 | 8.4 | 8.4 |
| 55-64 | 2005-2006 | 8.6 | 8.6 | 8.7 |
| 55-64 | 2006-2007 | 8.9 | 8.9 | 8.9 |
| 55-64 | 2007-2008 | 9.1 | 9.1 | 9.1 |
| 55-64 | 2008-2009 | 9.4 | 9.3 | 9.4 |
| 55-64 | 2009-2010 | 9.7 | 9.6 | 9.7 |
| 55-64 | 2010-2011 | 10.0 | 9.9 | 10.0 |
| 55-64 | 2011-2012 | 10.2 | 10.2 | 10.2 |
| 65-74 | 2000-2001 | 13.0 | 13.0 | 13.1 |
| 65-74 | 2001-2002 | 13.7 | 13.7 | 13.8 |
| 65-74 | 2002-2003 | 14.1 | 14.1 | 14.2 |
| 65-74 | 2003-2004 | 14.5 | 14.5 | 14.6 |
| 65-74 | 2004-2005 | 14.8 | 14.8 | 14.9 |
| 65-74 | 2005-2006 | 15.1 | 15.1 | 15.2 |
| 65-74 | 2006-2007 | 15.3 | 15.3 | 15.4 |
| 65-74 | 2007-2008 | 15.6 | 15.5 | 15.6 |
| 65-74 | 2008-2009 | 15.8 | 15.7 | 15.8 |
| 65-74 | 2009-2010 | 16.0 | 16.0 | 16.1 |
| 65-74 | 2010-2011 | 16.3 | 16.2 | 16.3 |
| 65-74 | 2011-2012 | 16.4 | 16.3 | 16.4 |
| 75-84 | 2000-2001 | 18.4 | 18.3 | 18.5 |
| 75-84 | 2001-2002 | 19.3 | 19.2 | 19.4 |
| 75-84 | 2002-2003 | 19.9 | 19.9 | 20.0 |
| 75-84 | 2003-2004 | 20.6 | 20.5 | 20.6 |
| 75-84 | 2004-2005 | 21.1 | 21.0 | 21.2 |
| 75-84 | 2005-2006 | 21.5 | 21.4 | 21.6 |
| 75-84 | 2006-2007 | 21.8 | 21.7 | 21.9 |
| 75-84 | 2007-2008 | 22.0 | 21.9 | 22.1 |
| 75-84 | 2008-2009 | 22.4 | 22.3 | 22.5 |
| 75-84 | 2009-2010 | 22.7 | 22.6 | 22.8 |
| 75-84 | 2010-2011 | 23.0 | 22.9 | 23.0 |
| 75-84 | 2011-2012 | 23.1 | 23.0 | 23.2 |
| 85+ | 2000-2001 | 19.8 | 19.7 | 19.9 |
| 85+ | 2001-2002 | 21.0 | 20.9 | 21.2 |
| 85+ | 2002-2003 | 22.0 | 21.8 | 22.1 |
| 85+ | 2003-2004 | 22.8 | 22.7 | 22.9 |
| 85+ | 2004-2005 | 23.5 | 23.3 | 23.6 |
| 85+ | 2005-2006 | 24.0 | 23.9 | 24.1 |
| 85+ | 2006-2007 | 24.5 | 24.4 | 24.6 |
| 85+ | 2007-2008 | 24.7 | 24.6 | 24.9 |
| 85+ | 2008-2009 | 25.2 | 25.1 | 25.4 |
| 85+ | 2009-2010 | 25.5 | 25.4 | 25.6 |
| 85+ | 2010-2011 | 25.8 | 25.7 | 25.9 |
| 85+ | 2011-2012 | 26.0 | 25.9 | 26.1 |
In 2011-2012, the prevalence of COPD varied among provinces and territories in Canada (Figure 2.4). Nunavut showed the highest COPD prevalence among all Canadian jurisdictions, followed by Yukon, Nova Scotia and the Northwest Territories.
Figure 2.4 Age-standardized prevalence of diagnosed COPD among Canadians aged 35 years and older, by sex and province/territory, Canada, 2011-2012
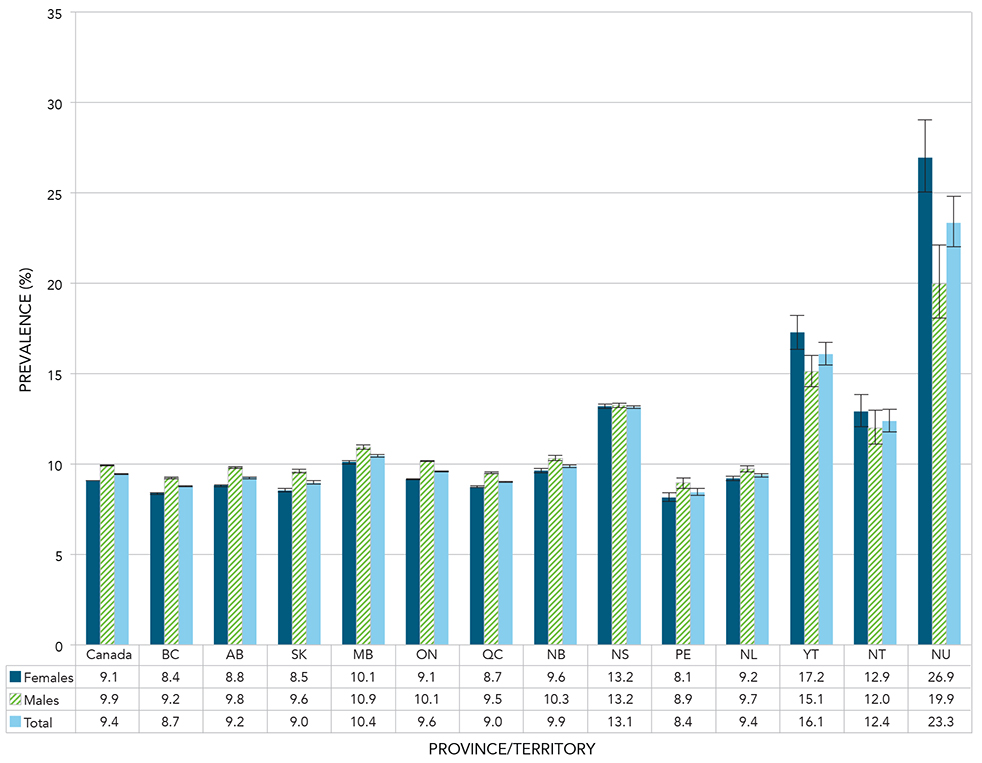
Notes: Age-standardized to the 2011 Canadian population. The 95% confidence interval shows an estimated range of values which is likely to include the true value 19 times out of 20.
Source: Public Health Agency of Canada, using Canadian Chronic Disease Surveillance System data files contributed by provinces and territories.
Figure 2.4 - Text equivalent
| Province or territory | Sex | Age-standardized Prevalence (%) | 95% Lower confidence interval | 95% Upper confidence interval |
|---|---|---|---|---|
| Canada | Females | 9.1 | 9.0 | 9.1 |
| Canada | Males | 9.9 | 9.9 | 9.9 |
| Canada | Total | 9.4 | 9.4 | 9.4 |
| British Columbia | Females | 8.4 | 8.3 | 8.4 |
| British Columbia | Males | 9.2 | 9.2 | 9.3 |
| British Columbia | Total | 8.7 | 8.7 | 8.8 |
| Alberta | Females | 8.8 | 8.7 | 8.9 |
| Alberta | Males | 9.8 | 9.7 | 9.9 |
| Alberta | Total | 9.2 | 9.2 | 9.3 |
| Saskatchewan | Females | 8.5 | 8.4 | 8.6 |
| Saskatchewan | Males | 9.6 | 9.5 | 9.7 |
| Saskatchewan | Total | 9.0 | 8.9 | 9.0 |
| Manitoba | Females | 10.1 | 10.0 | 10.2 |
| Manitoba | Males | 10.9 | 10.8 | 11.0 |
| Manitoba | Total | 10.4 | 10.3 | 10.5 |
| Ontario | Females | 9.1 | 9.1 | 9.2 |
| Ontario | Males | 10.1 | 10.1 | 10.2 |
| Ontario | Total | 9.6 | 9.6 | 9.6 |
| Quebec | Females | 8.7 | 8.7 | 8.8 |
| Quebec | Males | 9.5 | 9.4 | 9.5 |
| Quebec | Total | 9.0 | 9.0 | 9.0 |
| New Brunswick | Females | 9.6 | 9.5 | 9.7 |
| New Brunswick | Males | 10.3 | 10.2 | 10.4 |
| New Brunswick | Total | 9.9 | 9.8 | 9.9 |
| Nova Scotia | Females | 13.2 | 13.1 | 13.3 |
| Nova Scotia | Males | 13.2 | 13.1 | 13.4 |
| Nova Scotia | Total | 13.1 | 13.0 | 13.2 |
| Prince Edward Island | Females | 8.1 | 7.9 | 8.4 |
| Prince Edward Island | Males | 8.9 | 8.6 | 9.2 |
| Prince Edward Island | Total | 8.4 | 8.3 | 8.6 |
| Newfoundland and Labrador | Females | 9.2 | 9.0 | 9.3 |
| Newfoundland and Labrador | Males | 9.7 | 9.6 | 9.9 |
| Newfoundland and Labrador | Total | 9.4 | 9.3 | 9.5 |
| Yukon | Females | 17.2 | 16.3 | 18.2 |
| Yukon | Males | 15.1 | 14.3 | 16.0 |
| Yukon | Total | 16.1 | 15.5 | 16.7 |
| Northwest Territories | Females | 12.9 | 12.0 | 13.8 |
| Northwest Territories | Males | 12.0 | 11.1 | 12.9 |
| Northwest Territories | Total | 12.4 | 11.8 | 13.0 |
| Nunavut | Females | 26.9 | 25.0 | 29.0 |
| Nunavut | Males | 19.9 | 18.1 | 22.1 |
| Nunavut | Total | 23.3 | 22.0 | 24.8 |
Incidence
The incidence rates of COPD in Canada for 2011-2012 increased steadily for both males and females across the life span (Figure 2.5). Overall, the incidence rates ranged from 317.7 per 100,000 population in the 35-39 age group, to 2309.6 per 100,000 population in the 85 and older age group. Males had consistently higher COPD incidence rates compared to females of the same age group, with the gap between the two increasing with age.
Figure 2.5 Incidence rates of diagnosed COPD among Canadians aged 35 years and older, by age group and sex, Canada, 2011-2012
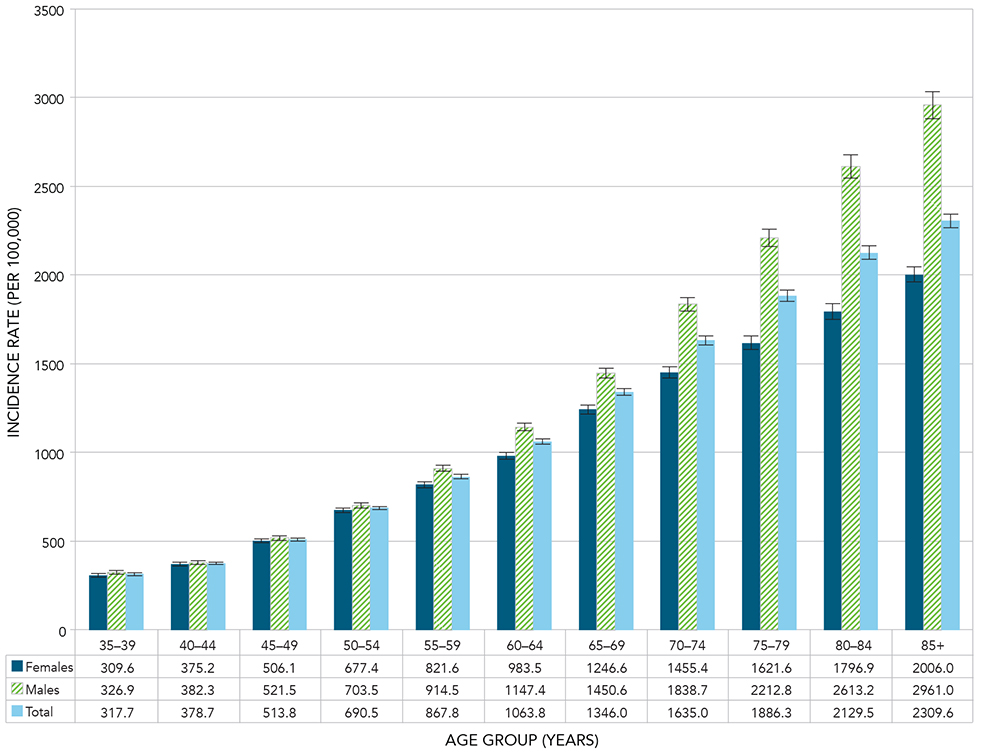
Notes: The 95% confidence interval shows an estimated range of values which is likely to include the true value 19 times out of 20. Crude estimates were based on randomly rounded counts to an adjacent multiple of 10 while age-standardized estimates were based on unrounded counts; therefore the total counts used for crude, age-specific and age-standardized estimates will differ.
Source: Public Health Agency of Canada, using Canadian Chronic Disease Surveillance System data files contributed by provinces and territories.
Figure 2.5 - Text equivalent
| Age Group (Years) | Sex | Incidence Rate (per 100,000) | 95% Lower confidence interval | 95% Upper confidence interval |
|---|---|---|---|---|
| 35-39 | Females | 309.6 | 299.7 | 319.7 |
| 35-39 | Males | 326.9 | 316.6 | 337.3 |
| 35-39 | Total | 317.7 | 310.6 | 325.0 |
| 40-44 | Females | 375.2 | 364.4 | 386.2 |
| 40-44 | Males | 382.3 | 371.5 | 393.4 |
| 40-44 | Total | 378.7 | 371.1 | 386.5 |
| 45-49 | Females | 506.1 | 494.0 | 518.3 |
| 45-49 | Males | 521.5 | 509.4 | 533.9 |
| 45-49 | Total | 513.8 | 505.3 | 522.5 |
| 50-54 | Females | 677.4 | 663.4 | 691.7 |
| 50-54 | Males | 703.5 | 689.2 | 718.0 |
| 50-54 | Total | 690.5 | 680.5 | 700.7 |
| 55-59 | Females | 821.6 | 805.0 | 838.3 |
| 55-59 | Males | 914.5 | 897.0 | 932.3 |
| 55-59 | Total | 867.8 | 855.8 | 880.0 |
| 60-64 | Females | 983.5 | 963.7 | 1003.5 |
| 60-64 | Males | 1147.4 | 1125.7 | 1169.3 |
| 60-64 | Total | 1063.8 | 1049.1 | 1078.6 |
| 65-69 | Females | 1246.6 | 1221.2 | 1272.4 |
| 65-69 | Males | 1450.6 | 1422.4 | 1479.1 |
| 65-69 | Total | 1346.0 | 1327.0 | 1365.1 |
| 70-74 | Females | 1455.4 | 1423.3 | 1488.1 |
| 70-74 | Males | 1838.7 | 1800.4 | 1877.6 |
| 70-74 | Total | 1635.0 | 1610.1 | 1660.1 |
| 75-79 | Females | 1621.6 | 1583.4 | 1660.4 |
| 75-79 | Males | 2212.8 | 2163.3 | 2263.1 |
| 75-79 | Total | 1886.3 | 1855.7 | 1917.3 |
| 80-84 | Females | 1796.9 | 1752.5 | 1842.1 |
| 80-84 | Males | 2613.2 | 2548.7 | 2679.0 |
| 80-84 | Total | 2129.5 | 2092.2 | 2167.2 |
| 85+ | Females | 2006.0 | 1963.5 | 2049.3 |
| 85+ | Males | 2961.0 | 2885.0 | 3038.5 |
| 85+ | Total | 2309.6 | 2271.8 | 2347.9 |
Between 2000-2001 and 2011-2012, the overall aged-standardized incidence rate of COPD among Canadians aged 35 years and older declined from 1201.9 to 914.8 per 100,000 population; a 23.9% relative decrease (Figure 2.6). Specifically, the age-standardized incidence rate dropped from 1073.5 to 843.1 per 100,000 population for females (21.5% relative decrease), and from 1395.6 to 1008.7 per 100,000 population for males (27.7% relative decrease).
Figure 2.6 Age-standardized incidence rates of diagnosed COPD among Canadians aged 35 years and older, by sex and year, Canada, 2000-2001 to 2011-2012
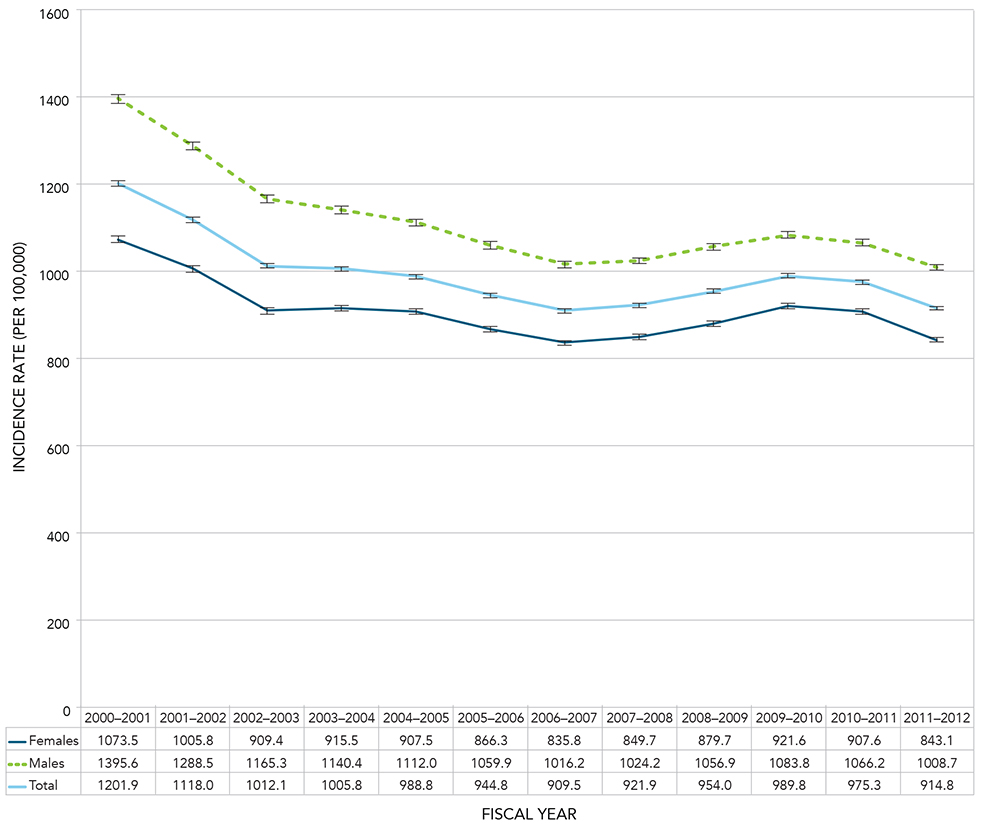
Notes: Age-standardized to the 2011 Canadian population. The 95% confidence interval shows an estimated range of values which is likely to include the true value 19 times out of 20.
Source: Public Health Agency of Canada, using Canadian Chronic Disease Surveillance System data files contributed by provinces and territories.
Figure 2.6 - Text equivalent
| Fiscal Year | Sex | Age-standardized Incidence Rate (per 100,000) | 95% Lower confidence interval | 95% Upper confidence interval |
|---|---|---|---|---|
| 2000-2001 | Females | 1073.5 | 1066.2 | 1080.9 |
| 2000-2001 | Males | 1395.6 | 1386.0 | 1405.2 |
| 2000-2001 | Total | 1201.9 | 1196.2 | 1207.6 |
| 2001-2002 | Females | 1005.8 | 998.8 | 1012.8 |
| 2001-2002 | Males | 1288.5 | 1279.4 | 1297.6 |
| 2001-2002 | Total | 1118.0 | 1112.6 | 1123.5 |
| 2002-2003 | Females | 909.4 | 902.8 | 916.0 |
| 2002-2003 | Males | 1165.3 | 1156.7 | 1173.9 |
| 2002-2003 | Total | 1012.1 | 1007.0 | 1017.3 |
| 2003-2004 | Females | 915.5 | 909.0 | 922.1 |
| 2003-2004 | Males | 1140.4 | 1132.0 | 1148.8 |
| 2003-2004 | Total | 1005.8 | 1000.7 | 1010.9 |
| 2004-2005 | Females | 907.5 | 901.1 | 914.0 |
| 2004-2005 | Males | 1112.0 | 1103.9 | 1120.2 |
| 2004-2005 | Total | 988.8 | 983.8 | 993.8 |
| 2005-2006 | Females | 866.3 | 860.1 | 872.6 |
| 2005-2006 | Males | 1059.9 | 1052.1 | 1067.7 |
| 2005-2006 | Total | 944.8 | 940.0 | 949.6 |
| 2006-2007 | Females | 835.8 | 829.8 | 842.0 |
| 2006-2007 | Males | 1016.2 | 1008.7 | 1023.8 |
| 2006-2007 | Total | 909.5 | 904.8 | 914.2 |
| 2007-2008 | Females | 849.7 | 843.7 | 855.8 |
| 2007-2008 | Males | 1024.2 | 1016.9 | 1031.7 |
| 2007-2008 | Total | 921.9 | 917.3 | 926.6 |
| 2008-2009 | Females | 879.7 | 873.6 | 885.8 |
| 2008-2009 | Males | 1056.9 | 1049.5 | 1064.3 |
| 2008-2009 | Total | 954.0 | 949.3 | 958.7 |
| 2009-2010 | Females | 921.6 | 915.4 | 927.8 |
| 2009-2010 | Males | 1083.8 | 1076.5 | 1091.2 |
| 2009-2010 | Total | 989.8 | 985.1 | 994.5 |
| 2010-2011 | Females | 907.6 | 901.5 | 913.7 |
| 2010-2011 | Males | 1066.2 | 1059.0 | 1073.4 |
| 2010-2011 | Total | 975.3 | 970.7 | 979.9 |
| 2011-2012 | Females | 843.1 | 837.3 | 848.9 |
| 2011-2012 | Males | 1008.7 | 1001.8 | 1015.6 |
| 2011-2012 | Total | 914.8 | 910.4 | 919.3 |
Generally, age-specific incidence rates of COPD declined for all age groups between 2000-2001 and 2011-2012. A slight increase in rates was seen in the years 2007-2008 to 2010-2011 for the younger age groups, however rates declined again in 2011-2012 (Figure 2.7).
Figure 2.7 Incidence rates of diagnosed COPD among Canadians aged 35 years and older, by 10-year age group and year, Canada, 2000-2001 to 2011-2012
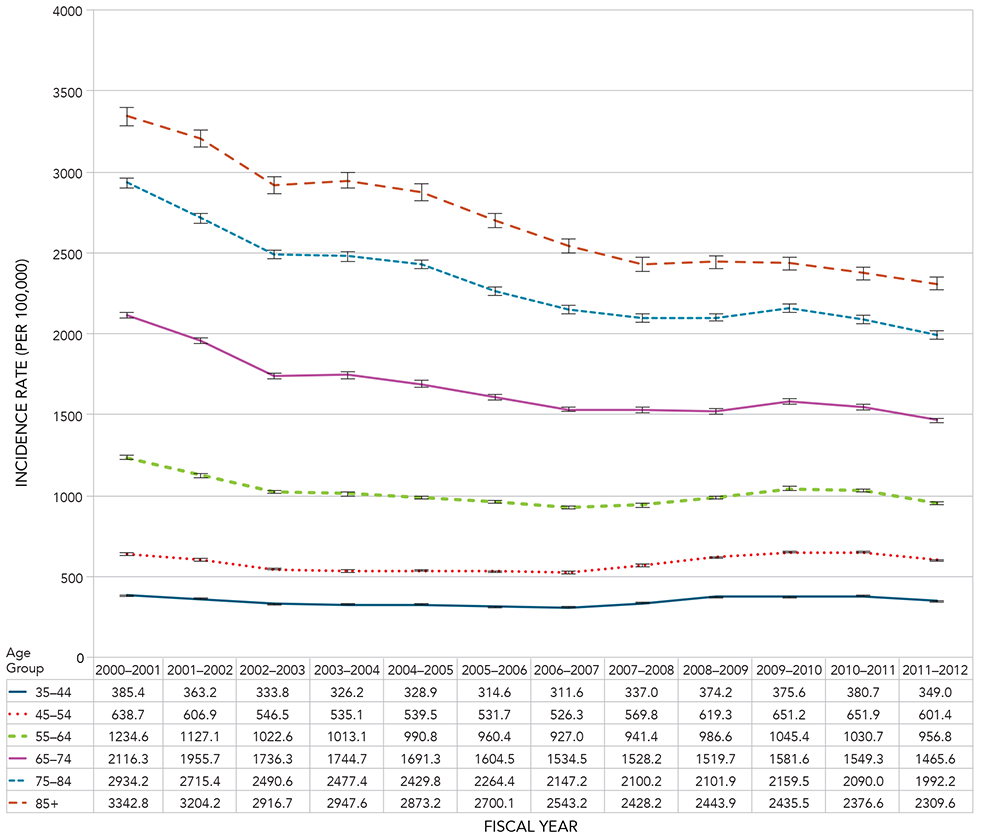
Notes: The 95% confidence interval shows an estimated range of values which is likely to include the true value 19 times out of 20. Crude estimates were based on randomly rounded counts to an adjacent multiple of 10 while age-standardized estimates were based on unrounded counts; therefore the total counts used for crude, age-specific and age-standardized estimates will differ.
Source: Public Health Agency of Canada, using Canadian Chronic Disease Surveillance System data files contributed by provinces and territories.
Figure 2.7 - Text equivalent
| Age Group (Years) | Fiscal Year | Incidence Rate (per 100,000) | 95% Lower confidence interval | 95% Upper confidence interval |
|---|---|---|---|---|
| 35-44 | 2000-2001 | 385.4 | 380.2 | 390.7 |
| 35-44 | 2001-2002 | 363.2 | 358.2 | 368.4 |
| 35-44 | 2002-2003 | 333.8 | 328.9 | 338.7 |
| 35-44 | 2003-2004 | 326.2 | 321.4 | 331.1 |
| 35-44 | 2004-2005 | 328.9 | 324.0 | 333.8 |
| 35-44 | 2005-2006 | 314.6 | 309.8 | 319.5 |
| 35-44 | 2006-2007 | 311.6 | 306.8 | 316.5 |
| 35-44 | 2007-2008 | 337.0 | 332.0 | 342.2 |
| 35-44 | 2008-2009 | 374.2 | 368.8 | 379.7 |
| 35-44 | 2009-2010 | 375.6 | 370.2 | 381.1 |
| 35-44 | 2010-2011 | 380.7 | 375.2 | 386.3 |
| 35-44 | 2011-2012 | 349.0 | 343.7 | 354.3 |
| 45-54 | 2000-2001 | 638.7 | 631.3 | 646.1 |
| 45-54 | 2001-2002 | 606.9 | 599.8 | 614.1 |
| 45-54 | 2002-2003 | 546.5 | 539.8 | 553.3 |
| 45-54 | 2003-2004 | 535.1 | 528.5 | 541.7 |
| 45-54 | 2004-2005 | 539.5 | 533.0 | 546.1 |
| 45-54 | 2005-2006 | 531.7 | 525.4 | 538.2 |
| 45-54 | 2006-2007 | 526.3 | 519.9 | 532.6 |
| 45-54 | 2007-2008 | 569.8 | 563.3 | 576.4 |
| 45-54 | 2008-2009 | 619.3 | 612.6 | 626.1 |
| 45-54 | 2009-2010 | 651.2 | 644.3 | 658.1 |
| 45-54 | 2010-2011 | 651.9 | 645.1 | 658.9 |
| 45-54 | 2011-2012 | 601.4 | 594.8 | 608.0 |
| 55-64 | 2000-2001 | 1234.6 | 1221.6 | 1247.8 |
| 55-64 | 2001-2002 | 1127.1 | 1114.9 | 1139.3 |
| 55-64 | 2002-2003 | 1022.6 | 1011.3 | 1034.0 |
| 55-64 | 2003-2004 | 1013.1 | 1002.1 | 1024.2 |
| 55-64 | 2004-2005 | 990.8 | 980.1 | 1001.5 |
| 55-64 | 2005-2006 | 960.4 | 950.1 | 970.7 |
| 55-64 | 2006-2007 | 927.0 | 917.0 | 937.0 |
| 55-64 | 2007-2008 | 941.4 | 931.5 | 951.4 |
| 55-64 | 2008-2009 | 986.6 | 976.6 | 996.6 |
| 55-64 | 2009-2010 | 1045.4 | 1035.3 | 1055.5 |
| 55-64 | 2010-2011 | 1030.7 | 1020.9 | 1040.6 |
| 55-64 | 2011-2012 | 956.8 | 947.4 | 966.2 |
| 65-74 | 2000-2001 | 2116.3 | 2096.0 | 2136.7 |
| 65-74 | 2001-2002 | 1955.7 | 1936.2 | 1975.3 |
| 65-74 | 2002-2003 | 1736.3 | 1717.9 | 1754.8 |
| 65-74 | 2003-2004 | 1744.7 | 1726.4 | 1763.2 |
| 65-74 | 2004-2005 | 1691.3 | 1673.3 | 1709.4 |
| 65-74 | 2005-2006 | 1604.5 | 1587.1 | 1622.0 |
| 65-74 | 2006-2007 | 1534.5 | 1517.6 | 1551.5 |
| 65-74 | 2007-2008 | 1528.2 | 1511.5 | 1545.0 |
| 65-74 | 2008-2009 | 1519.7 | 1503.4 | 1536.3 |
| 65-74 | 2009-2010 | 1581.6 | 1565.2 | 1598.2 |
| 65-74 | 2010-2011 | 1549.3 | 1533.3 | 1565.5 |
| 65-74 | 2011-2012 | 1465.6 | 1450.5 | 1480.9 |
| 75-84 | 2000-2001 | 2934.2 | 2903.4 | 2965.2 |
| 75-84 | 2001-2002 | 2715.4 | 2686.1 | 2745.1 |
| 75-84 | 2002-2003 | 2490.6 | 2462.7 | 2518.7 |
| 75-84 | 2003-2004 | 2477.4 | 2449.9 | 2505.2 |
| 75-84 | 2004-2005 | 2429.8 | 2402.7 | 2457.1 |
| 75-84 | 2005-2006 | 2264.4 | 2238.4 | 2290.6 |
| 75-84 | 2006-2007 | 2147.2 | 2122.1 | 2172.6 |
| 75-84 | 2007-2008 | 2100.2 | 2075.5 | 2125.1 |
| 75-84 | 2008-2009 | 2101.9 | 2077.2 | 2126.9 |
| 75-84 | 2009-2010 | 2159.5 | 2134.5 | 2184.6 |
| 75-84 | 2010-2011 | 2090.0 | 2065.6 | 2114.6 |
| 75-84 | 2011-2012 | 1992.2 | 1968.5 | 2016.2 |
| 85+ | 2000-2001 | 3342.8 | 3287.1 | 3399.3 |
| 85+ | 2001-2002 | 3204.2 | 3150.3 | 3258.9 |
| 85+ | 2002-2003 | 2916.7 | 2865.7 | 2968.4 |
| 85+ | 2003-2004 | 2947.6 | 2896.9 | 2998.9 |
| 85+ | 2004-2005 | 2873.2 | 2824.1 | 2922.9 |
| 85+ | 2005-2006 | 2700.1 | 2653.6 | 2747.2 |
| 85+ | 2006-2007 | 2543.2 | 2499.2 | 2587.7 |
| 85+ | 2007-2008 | 2428.2 | 2386.3 | 2470.8 |
| 85+ | 2008-2009 | 2443.9 | 2402.5 | 2485.8 |
| 85+ | 2009-2010 | 2435.5 | 2395.0 | 2476.4 |
| 85+ | 2010-2011 | 2376.6 | 2337.5 | 2416.2 |
| 85+ | 2011-2012 | 2309.6 | 2271.8 | 2347.9 |
The incidence of COPD varied among provinces and territories in Canada in 2011-2012 (Figure 2.8). Nunavut, the Northwest Territories and Yukon had the highest overall incidence of COPD among Canadian jurisdictions. The lowest incidence rates were in Ontario, Newfoundland and Labrador and Quebec. In general, the rates did not differ much between males and females across Canada.
Nunavut, Yukon, the Northwest Territories and Nova Scotia ranked among the highest in incidence as well as prevalence. Conversely, Prince Edward Island and British Columbia ranked fourth and sixth highest respectively in incidence, but ranked among the lowest in prevalence (Figures 2.4 and 2.8).
Figure 2.8 Age-standardized incidence rates of diagnosed COPD among Canadians aged 35 years and older, by sex and province/territory, Canada, 2011-2012
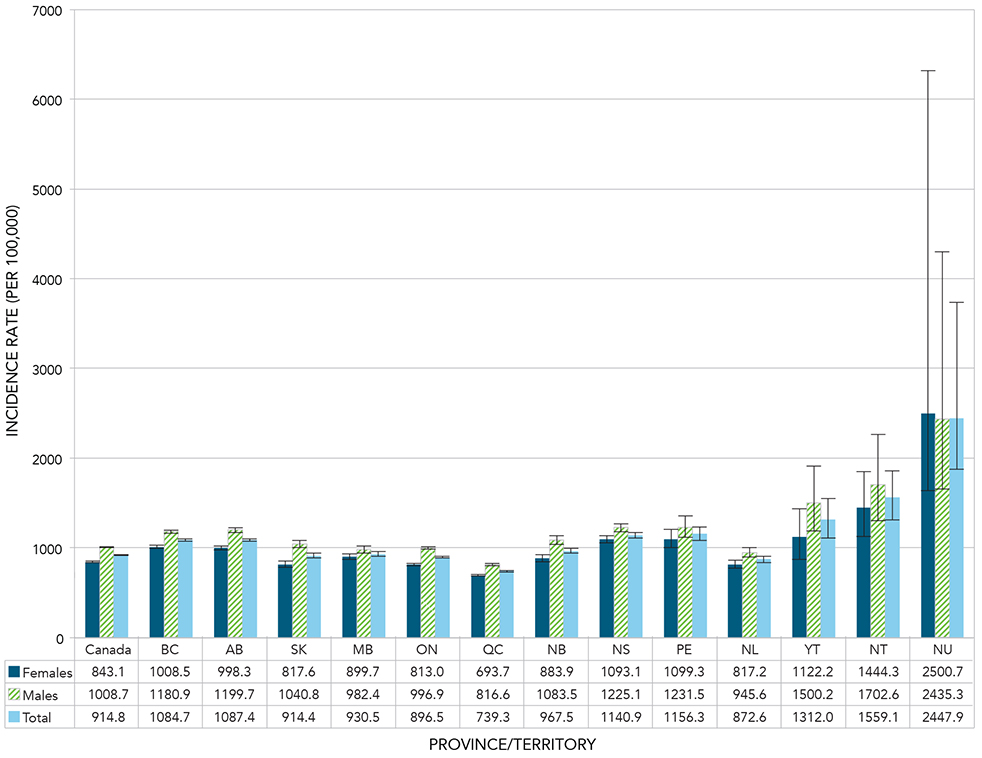
Notes: Age-standardized to the 2011 Canadian population. The 95% confidence interval shows an estimated range of values which is likely to include the true value 19 times out of 20.
Source: Public Health Agency of Canada, using Canadian Chronic Disease Surveillance System data files contributed by provinces and territories.
Figure 2.8 - Text equivalent
| Province or territory | Sex | Age-standardized incidence rate (per 100,000) | 95% Lower confidence interval | 95% Upper confidence interval |
|---|---|---|---|---|
| Canada | Females | 843.1 | 837.3 | 848.9 |
| Canada | Males | 1008.7 | 1001.8 | 1015.6 |
| Canada | Total | 914.8 | 910.4 | 919.3 |
| British Columbia | Females | 1008.5 | 991.3 | 1025.9 |
| British Columbia | Males | 1180.9 | 1161.1 | 1200.9 |
| British Columbia | Total | 1084.7 | 1071.8 | 1097.7 |
| Alberta | Females | 998.3 | 977.2 | 1019.7 |
| Alberta | Males | 1199.7 | 1174.4 | 1225.5 |
| Alberta | Total | 1087.4 | 1071.4 | 1103.7 |
| Saskatchewan | Females | 817.6 | 784.2 | 852.1 |
| Saskatchewan | Males | 1040.8 | 1000.8 | 1082.2 |
| Saskatchewan | Total | 914.4 | 888.9 | 940.6 |
| Manitoba | Females | 899.7 | 867.1 | 933.2 |
| Manitoba | Males | 982.4 | 945.4 | 1020.7 |
| Manitoba | Total | 930.5 | 906.3 | 955.2 |
| Ontario | Females | 813.0 | 803.8 | 822.1 |
| Ontario | Males | 996.9 | 986.2 | 1007.8 |
| Ontario | Total | 896.5 | 889.5 | 903.5 |
| Quebec | Females | 693.7 | 683.0 | 704.6 |
| Quebec | Males | 816.6 | 803.4 | 830.0 |
| Quebec | Total | 739.3 | 731.1 | 747.5 |
| New Brunswick | Females | 883.9 | 845.4 | 923.8 |
| New Brunswick | Males | 1083.5 | 1036.9 | 1131.9 |
| New Brunswick | Total | 967.5 | 938.1 | 997.7 |
| Nova Scotia | Females | 1093.1 | 1054.6 | 1132.6 |
| Nova Scotia | Males | 1225.1 | 1180.0 | 1271.6 |
| Nova Scotia | Total | 1140.9 | 1112.0 | 1170.3 |
| Prince Edward Island | Females | 1099.3 | 1003.4 | 1202.3 |
| Prince Edward Island | Males | 1231.5 | 1121.1 | 1351.6 |
| Prince Edward Island | Total | 1156.3 | 1084.1 | 1232.3 |
| Newfoundland and Labrador | Females | 817.2 | 773.4 | 862.9 |
| Newfoundland and Labrador | Males | 945.6 | 893.9 | 1000.0 |
| Newfoundland and Labrador | Total | 872.6 | 839.4 | 906.8 |
| Yukon | Females | 1122.2 | 874.7 | 1437.4 |
| Yukon | Males | 1500.2 | 1185.2 | 1912.6 |
| Yukon | Total | 1312.0 | 1112.0 | 1549.6 |
| Northwest Territories | Females | 1444.3 | 1127.7 | 1852.8 |
| Northwest Territories | Males | 1702.6 | 1305.9 | 2262.8 |
| Northwest Territories | Total | 1559.1 | 1311.7 | 1860.0 |
| Nunavut | Females | 2500.7 | 1640.5 | 6323.9 |
| Nunavut | Males | 2435.3 | 1657.8 | 4297.1 |
| Nunavut | Total | 2447.9 | 1878.8 | 3735.4 |
All-cause Mortality
Throughout the observation period (2000-2001 to 2011-2012), all-cause mortality rates were consistently higher among Canadians aged 35 years and older living with COPD compared to those without (Figure 2.9). It is notable that the mortality rates among those living with COPD have declined throughout the observation period. However, the rate ratios remained similar over the years between those with and without COPD, with only a slight decrease from 2.8 in 2000-2001 to 2.7 in 2011-2012. This suggests that improvements occurred in both groups, irrespective of disease status.
Figure 2.9 Age-standardized all-cause mortality rates and rate ratios among Canadians aged 35 years and older with diagnosed COPD compared to those without diagnosed COPD, by year, Canada, 2000-2001 to 2011-2012
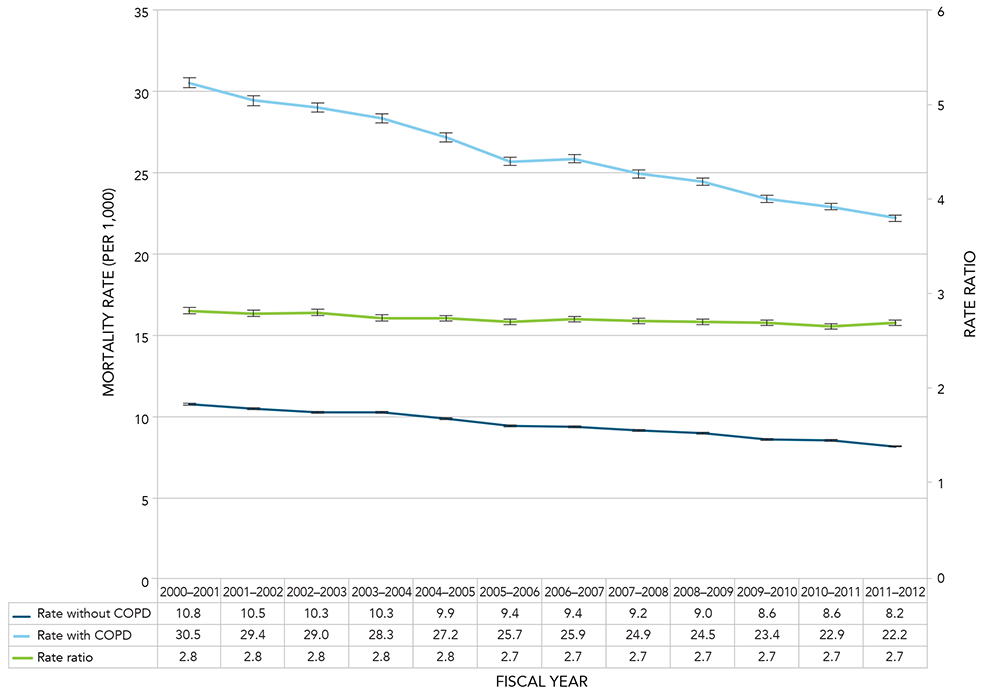
Notes: Age-standardized to the 2011 Canadian population. The 95% confidence interval shows an estimated range of values which is likely to include the true value 19 times out of 20.
Source: Public Health Agency of Canada, using Canadian Chronic Disease Surveillance System data files contributed by provinces and territories.
Figure 2.9 - Text equivalent
| Fiscal Year | Age-standardized All-cause Mortality Rate without COPD | 95% Lower confidence interval Rate (without COPD) | 95% Upper confidence interval Rate (without COPD) | Age-standardized All-cause Mortality Rate with COPD | 95% Lower confidence interval Rate (with COPD) | 95% Upper confidence interval Rate (with COPD) | Rate Ratio | 95% Lower confidence interval (Rate Ratio) | 95% Upper confidence interval (Rate Ratio) |
|---|---|---|---|---|---|---|---|---|---|
| 2000-2001 | 10.8 | 10.7 | 10.8 | 30.5 | 30.2 | 30.8 | 2.8 | 2.8 | 2.9 |
| 2001-2002 | 10.5 | 10.4 | 10.5 | 29.4 | 29.2 | 29.7 | 2.8 | 2.8 | 2.8 |
| 2002-2003 | 10.3 | 10.2 | 10.4 | 29.0 | 28.7 | 29.3 | 2.8 | 2.8 | 2.8 |
| 2003-2004 | 10.3 | 10.2 | 10.3 | 28.3 | 28.1 | 28.6 | 2.8 | 2.7 | 2.8 |
| 2004-2005 | 9.9 | 9.8 | 9.9 | 27.2 | 26.9 | 27.4 | 2.8 | 2.7 | 2.8 |
| 2005-2006 | 9.4 | 9.4 | 9.5 | 25.7 | 25.5 | 25.9 | 2.7 | 2.7 | 2.7 |
| 2006-2007 | 9.4 | 9.4 | 9.5 | 25.9 | 25.6 | 26.1 | 2.7 | 2.7 | 2.8 |
| 2007-2008 | 9.2 | 9.1 | 9.2 | 24.9 | 24.7 | 25.2 | 2.7 | 2.7 | 2.7 |
| 2008-2009 | 9.0 | 9.0 | 9.1 | 24.5 | 24.3 | 24.7 | 2.7 | 2.7 | 2.7 |
| 2009-2010 | 8.6 | 8.6 | 8.7 | 23.4 | 23.2 | 23.6 | 2.7 | 2.7 | 2.7 |
| 2010-2011 | 8.6 | 8.5 | 8.6 | 22.9 | 22.7 | 23.1 | 2.7 | 2.6 | 2.7 |
| 2011-2012 | 8.2 | 8.2 | 8.2 | 22.2 | 22.0 | 22.4 | 2.7 | 2.7 | 2.7 |
All-cause mortality rates were higher among those living with COPD than those without COPD, across all age groups; rate ratios ranged from 4.7 in the 35-39 age group to 1.7 in the 85 and older age group (Figure 2.10).
Figure 2.10 All-cause mortality rates and rate ratios among Canadians aged 35 years and older with diagnosed COPD compared to those without diagnosed COPD, by age group, Canada, 2011-2012
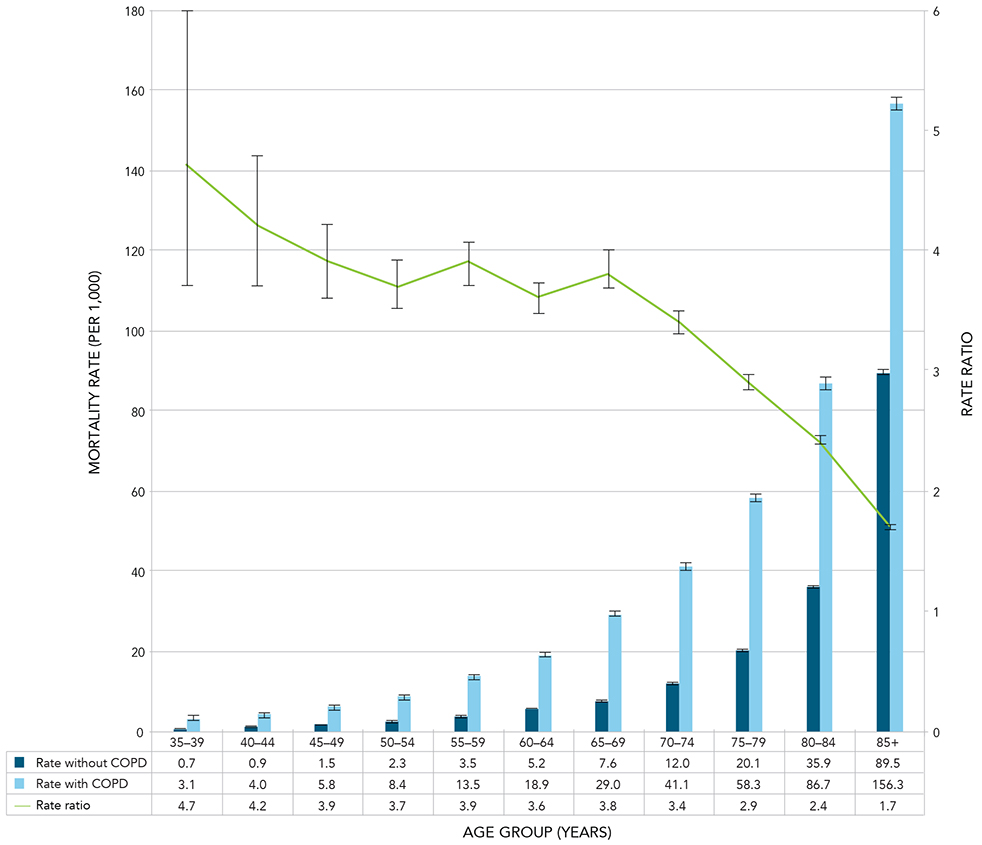
Notes: The 95% confidence interval shows an estimated range of values which is likely to include the true value 19 times out of 20. Crude estimates were based on randomly rounded counts to an adjacent multiple of 10 while age-standardized estimates were based on unrounded counts; therefore the total counts used for crude, age-specific and age-standardized estimates will differ.
Source: Public Health Agency of Canada, using Canadian Chronic Disease Surveillance System data files contributed by provinces and territories.
Figure 2.10 - Text equivalent
| Age Group (Years) | All-cause Mortality Rate without COPD | 95% Lower confidence interval (without COPD) | 95% Upper confidence interval (without COPD) | All-cause Mortality Rate with COPD | 95% Lower confidence interval (with COPD) | 95% Upper confidence interval (with COPD) | Rate Ratio | 95% Lower confidence interval (Rate Ratio) | 95% Upper confidence interval (Rate Ratio) |
|---|---|---|---|---|---|---|---|---|---|
| 35-39 | 0.7 | 0.6 | 0.7 | 3.1 | 2.4 | 3.9 | 4.7 | 3.7 | 6.0 |
| 40-44 | 0.9 | 0.9 | 1.0 | 4.0 | 3.5 | 4.6 | 4.2 | 3.7 | 4.8 |
| 45-49 | 1.5 | 1.4 | 1.5 | 5.8 | 5.4 | 6.2 | 3.9 | 3.6 | 4.2 |
| 50-54 | 2.3 | 2.2 | 2.3 | 8.4 | 8.0 | 8.9 | 3.7 | 3.5 | 3.9 |
| 55-59 | 3.5 | 3.4 | 3.5 | 13.5 | 13.0 | 14.0 | 3.9 | 3.7 | 4.1 |
| 60-64 | 5.2 | 5.1 | 5.3 | 18.9 | 18.4 | 19.5 | 3.6 | 3.5 | 3.8 |
| 65-69 | 7.6 | 7.4 | 7.7 | 29.0 | 28.3 | 29.7 | 3.8 | 3.7 | 4.0 |
| 70-74 | 12.0 | 11.8 | 12.2 | 41.1 | 40.3 | 41.9 | 3.4 | 3.3 | 3.5 |
| 75-79 | 20.1 | 19.8 | 20.5 | 58.3 | 57.2 | 59.3 | 2.9 | 2.8 | 3.0 |
| 80-84 | 35.9 | 35.4 | 36.4 | 86.7 | 85.4 | 88.0 | 2.4 | 2.4 | 2.5 |
| 85+ | 89.5 | 88.7 | 90.2 | 156.3 | 154.6 | 158.0 | 1.7 | 1.7 | 1.8 |
Comorbidity
In reporting on comorbidity, a different approach was used for COPD compared to that for asthma. The prevalence of COPD among those with and without each of the comorbidities was reported, i.e. those with and without asthma, mood and/or anxiety disorders,Footnote c diabetes and hypertension. The Chronic Respiratory Disease Working Group recommended this approach as it was more consistent with the natural course of disease with respect to COPD.
Between 2000-2001 and 2011-2012, among Canadians aged 35 years and older, the prevalence of COPD was greater among those with diagnosed diabetes, hypertension, mood and/or anxiety disorders, and asthma, than among those without, as indicated by prevalence ratios greater than one for all four comorbid conditions (Figure 2.11).
The prevalence ratios for COPD between those with and those without diagnosed asthma ranged from a high of 5.2 in 2000-2001 to a low of 3.7 in 2011-2012 (Figure 2.11).
Figure 2.11 Age-standardized prevalence ratios of diagnosed COPD among those with and without diagnosed asthma, mood and/or anxiety disorders, diabetes and hypertension, by year, Canada, 2000-2001 to 2011-2012
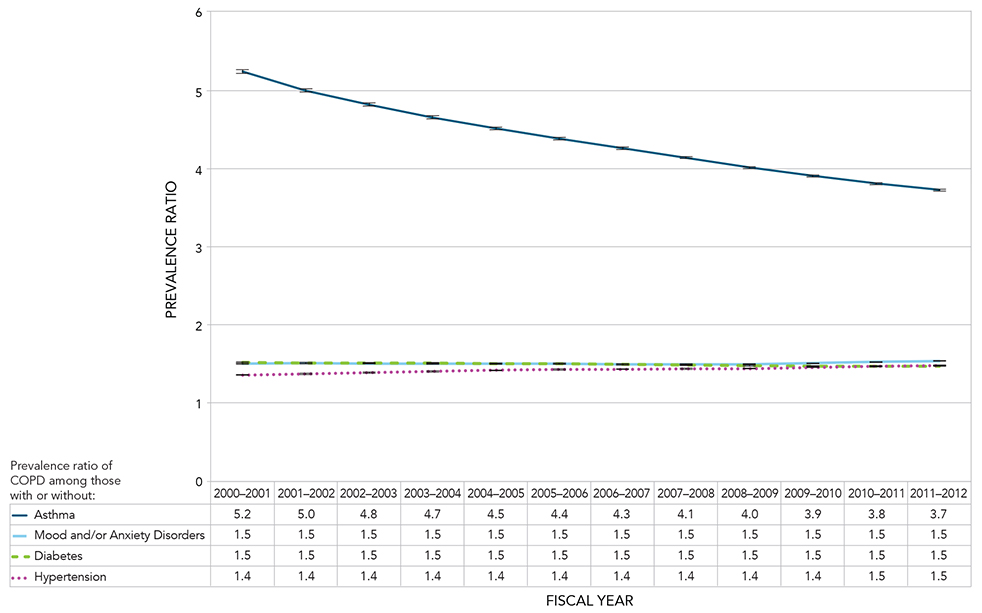
Notes: Age-standardized to the 2011 Canadian population. The 95% confidence interval shows an estimated range of values which is likely to include the true value 19 times out of 20.
Source: Public Health Agency of Canada, using Canadian Chronic Disease Surveillance System data files contributed by provinces and territories.
Figure 2.11 - Text equivalent
| Fiscal Year | Age-standardized Prevalence ratio of COPD among those with and without asthma | 95% Lower confidence interval of prevalence ratio of COPD among those with and without asthma | 95% Upper confidence interval of prevalence ratio of COPD among those with and without asthma | Age-standardized Prevalence ratio of COPD among those with and without mood and/or anxiety disorder | 95% Lower confidence interval of prevalence ratio of COPD among those with and without mood and/or anxiety disorder | 95% Upper confidence interval of prevalence ratio of COPD among those with and without mood and/or anxiety disorder | Age-standardized Prevalence ratio of COPD among those with and without diabetes | 95% Lower confidence interval of prevalence ratio of COPD among those with and without diabetes | 95% Upper confidence interval of prevalence ratio of COPD among those with and without diabetes | Age-standardized Prevalence ratio of COPD among those with and without hypertension | 95% Lower confidence interval of prevalence ratio of COPD among those with and without hypertension | 95% Upper confidence interval of prevalence ratio of COPD among those with and without hypertension |
|---|---|---|---|---|---|---|---|---|---|---|---|---|
| 2000-2001 | 5.2 | 5.2 | 5.3 | 1.5 | 1.5 | 1.5 | 1.5 | 1.5 | 1.5 | 1.4 | 1.3 | 1.4 |
| 2001-2002 | 5.0 | 5.0 | 5.0 | 1.5 | 1.5 | 1.5 | 1.5 | 1.5 | 1.5 | 1.4 | 1.4 | 1.4 |
| 2002-2003 | 4.8 | 4.8 | 4.8 | 1.5 | 1.5 | 1.5 | 1.5 | 1.5 | 1.5 | 1.4 | 1.4 | 1.4 |
| 2003-2004 | 4.7 | 4.6 | 4.7 | 1.5 | 1.5 | 1.5 | 1.5 | 1.5 | 1.5 | 1.4 | 1.4 | 1.4 |
| 2004-2005 | 4.5 | 4.5 | 4.5 | 1.5 | 1.5 | 1.5 | 1.5 | 1.5 | 1.5 | 1.4 | 1.4 | 1.4 |
| 2005-2006 | 4.4 | 4.4 | 4.4 | 1.5 | 1.5 | 1.5 | 1.5 | 1.5 | 1.5 | 1.4 | 1.4 | 1.4 |
| 2006-2007 | 4.3 | 4.2 | 4.3 | 1.5 | 1.5 | 1.5 | 1.5 | 1.5 | 1.5 | 1.4 | 1.4 | 1.4 |
| 2007-2008 | 4.1 | 4.1 | 4.2 | 1.5 | 1.5 | 1.5 | 1.5 | 1.5 | 1.5 | 1.4 | 1.4 | 1.4 |
| 2008-2009 | 4.0 | 4.0 | 4.0 | 1.5 | 1.5 | 1.5 | 1.5 | 1.5 | 1.5 | 1.4 | 1.4 | 1.4 |
| 2009-2010 | 3.9 | 3.9 | 3.9 | 1.5 | 1.5 | 1.5 | 1.5 | 1.5 | 1.5 | 1.4 | 1.4 | 1.5 |
| 2010-2011 | 3.8 | 3.8 | 3.8 | 1.5 | 1.5 | 1.5 | 1.5 | 1.5 | 1.5 | 1.5 | 1.5 | 1.5 |
| 2011-2012 | 3.7 | 3.7 | 3.7 | 1.5 | 1.5 | 1.5 | 1.5 | 1.5 | 1.5 | 1.5 | 1.5 | 1.5 |
Discussion
COPD remains one of the leading chronic respiratory diseases in Canada, and will likely continue to be a major public health concern due to an aging population and historically high smoking rates. Addressing COPD will require concerted efforts by policy makers, health educators, health care providers and non-governmental organizations to address the risk factors associated with COPD and to ensure proper management of the disease.
COPD incidence rates declined over the observation period from 1201.9 per 100,000 in 2000-2001 to 914.8 per 100,000 in 2011-2012. The incidence rates ranged from 317.7 per 100,000 population in the 35-39 age group to 2309.6 per 100,000 population in the 85 and older age group. Males had consistently higher COPD incidence rates compared to females of the same age group, with the gap between the two increasing with age. This difference between males and females reflects the typical latency period between smoking and COPD and historically higher smoking rates among males.Footnote 45Footnote 46Footnote 47Footnote 48Footnote 49 Although a higher prevalence of smoking was seen in female youth in the more recent past, from 1994 to 2005, the data from the 2012-13 Canadian Youth Smoking Survey show a greater percentage of males smoking.Footnote 13Footnote 50 It will be important to follow these trends to see whether the differences in COPD rates among males and females will mirror the sex differences in trends observed for smoking.
COPD incidence rates varied geographically across Canada; ranging from 2447.9 per 100,000 in Nunavut to 739.3 per 100,000 in Quebec. This suggests that geographical differences could exist in gene-environment interaction predisposition, exposure to risk factors such as smoking or industrial exposures, diagnostic practices, or combinations of these factors. Generally, provinces and territories with higher rates of smoking in the Canadian Community Health Survey are those with higher incidence rates of COPD.Footnote 51 But, further studies are necessary to examine the role of smoking relative to other contributing factors on the observed differences in COPD rates.
The age-standardized prevalence of COPD increased from 7.0% in 2000-2001 to 9.4% in 2011-2012. Increased prevalence will require careful planning and resource allocation to ensure the increased need for services and care will be met. Due to the chronic nature and incurability of COPD, many areas of health care are implicated including: pulmonary rehabilitation, oxygen therapy, home care, long-term care, acute care and palliative care services.
The prevalence of COPD also increased across the life span; with proportions ranging from 0.9% among those aged 35-39 to 26.0% among those aged 85 years and older. The disease primarily develops after years of assault on lung tissue by cigarette smoking or other irritants. As well, there is evidence suggesting that having asthma can play a role in the development of COPDFootnote 52 and as many as half of those with COPD have co-occurring asthma.Footnote 26 Common risk factors between asthma and COPD, such as smoking, likely play a role in the high comorbidity.
Between 2000-2001 and 2011-2012, an increase in age-specific prevalence of COPD was seen in nearly all age groups with the exception of those aged 35-44 where the proportion remained stable. The stable proportion in this age group may signal a declining smoking rate among Canadians aged 35-44 years, but more years of data are needed to confirm the impact of decreasing rates of smoking on the prevalence of COPD. This age cohort should be monitored over the long term to determine if this is the case.
Many COPD patients are advanced in age and often have one or more other chronic diseases or conditions in addition to COPD. This co-morbidity means more intensive requirements will be placed on the health care system in both time and resources, as several diseases or conditions need to be managed simultaneously. This adds to the burden and costs of caring for COPD patients.
All-cause mortality rates declined among those living with COPD from 30.5 per 1,000 in 2000-2001 to 22.2 per 1,000 in 2011-2012. This may be due to better COPD treatment and management. The all-cause mortality rates were consistently higher among Canadians aged 35 years and older living with COPD compared to those who do not have COPD (rate ratios ranged from 2.7-2.8). Among the younger groups, the rate ratios were high (ranging from 3.7-4.7); indicating higher all cause-mortality among those living with COPD relative to those who do not have COPD. More research is needed to determine why the rate ratios are high among the younger age groups. One possible explanation is that those diagnosed at younger ages may be heavier smokers and therefore present with COPD symptoms earlier. The mortality rate ratio declines with age, as generally, there is higher mortality due to many causes at older ages.
The burden of COPD is known to be underestimated due to under-diagnosis, attribution of illness and death to other comorbid diseases or conditions such as pneumonia (especially among older adults), and a lack of consistent use of targeted lung function testing among at-risk populations.Footnote 32Footnote 53Footnote 54Footnote 55 Thus, the true burden of COPD might be higher than what is presented in this report.
Several studies examining the use of lung function testing identified that only between 30% and 50% of those diagnosed with COPD had lung function tests. This indicates that a large number of individuals with a clinical diagnosis of COPD have not had confirmatory testing to validate the diagnosis.Footnote 56Footnote 57Footnote 58Footnote 59Footnote 60Footnote 61Footnote 62Footnote 63 In addition, a number of studies comparing spirometry results with surveys or other self-reports, showed greater proportions of individuals with airflow obstruction than is indicated by self-reports.Footnote 64Footnote 65Footnote 66
Studies have also shown that COPD-related mortality is under-reported. Patients living with COPD often have one or more additional serious diseases or conditions such as cardiovascular disease, lung cancer, or pneumonia. These diseases or conditions often preclude COPD from being recorded as the primary or underlying cause of death on death certificates.Footnote 40Footnote 54Footnote 64Footnote 66 In one study, where patients were known to have COPD, COPD was not mentioned on 42% of the death certificates.Footnote 67 Furthermore, in cases where COPD exacerbation was the adjudicated cause of death, COPD was not listed as the main cause of death in 34% of the cases and not mentioned at all in 21% of the cases.Footnote 67 The under-reporting of COPD (morbidity and mortality) has significant negative implications for the management, prevention and resource allocation for this disease.
COPD and asthma have a common clinical presentation, leading to COPD being misdiagnosed as asthma and vice versa. Individuals may also have both diseases. This overlap in asthma – COPD diagnosis may account for some of the observed high comorbidity for asthma and COPD. A number of other possible explanations can be suggested for this high comorbidity of asthma and COPD: 1) a common pathology, 2) a common gene-environment interaction predisposition, or 3) a common risk factor or disease origin resulting in one disease evolving into the other.Footnote 25
The long course of COPD, and the fact that it is a risk factor for other diseases or conditions (e.g., cardiovascular diseaseFootnote 68), increase the likelihood of comorbidity as an individual ages. This complicates the management of COPD and necessitates an integrated care approach. Health care systems will need to be aware of the increasing demands stemming from greater prevalence of COPD while providing comprehensive care and ensuring optimal outcomes for individuals affected by COPD.
Smoking is the single largest risk factor for COPD. Further reduction in smoking rates will decrease future COPD morbidity and mortality and increase the number of productive life years to be enjoyed by Canadians.
Chapter 3: A Final Word
Moving Forward
Expanding surveillance and research to examine the causes of asthma and COPD and utilizing population-based surveys and other data sources such as lung function testing (i.e., spirometry) data, other health services (e.g. home care, oxygen therapy) and medication use, may further improve our understanding of the full burden of asthma and COPD in Canada. Interventions targeting improving indoor and outdoor air quality, and smoking prevention and cessation programming may also help to reduce the risks of developing or worsening of these diseases. As well, the broader use of spirometry could support early detection efforts leading to earlier treatment and better health outcomes and a better quality of life for Canadians living with asthma or COPD.Footnote 2Footnote 30Footnote 31Footnote 32Footnote 33Footnote 69
A continued focus on optimizing our surveillance methodology is necessary to ensure accurate measurement of the prevalence and incidence of asthma and COPD in the Canadian population, and the burden of these diseases on the health care system, society as a whole and individuals. This information may help design better policies and programs to effectively address these diseases, thereby reducing their occurrence and burden on Canadians.
Appendix A: Chronic Respiratory Disease Surveillance Development through the Canadian Chronic Disease Surveillance System
Canadian Chronic Disease Surveillance System
The purpose of the CCDSS is to estimate and report on current burden and trends of chronic diseases and conditions in Canada. Based on the model of the former National Diabetes Surveillance System, the CCDSS continues to track diabetes; however, its scope has expanded to include other chronic diseases and conditions such as mental illness, mood and/or anxiety disorders, hypertension, asthma, chronic obstructive pulmonary disease, heart failure, ischemic heart disease, acute myocardial infarction, stroke, arthritis, osteoporosis, and neurological conditions. The CCDSS provides coverage of 97% of Canada's population, including individuals who are often missed by other methods of data collection (e.g. surveys). It provides a more comprehensive picture of chronic diseases and conditions seen in the Canadian health care system than databases which track hospitalized diseases and conditions alone. It is guided by the expertise of the CCDSS Science Committee, with representatives from each province and territory.
This report identifies those who interact with the health care system (either by physician visit or hospital separation), and thus does not identify those who have not yet been diagnosed by a physician as having asthma or COPD. That limitation notwithstanding, under a single-payer system, administrative data has the advantage of having broad coverage of the population, and serves as an inexpensive data source compared to population-based surveys.
As in any surveillance system, there is the potential for false positives (wrongly identifying someone as having the disease when the person does not) and false negatives (wrongly identifying someone as not having the disease when the person does). The case definitions used in the CCDSS were validated by independent researchers.
Data sources: The CCDSS uses datasets provided by the provinces and territories constructed by linking the following data sources:
- Provincial/territorial health insurance registry;
- Provincial/territorial physician billing claims database (nurse practitioners were included in provinces and territories where they are employed and where billings are available); and
- Provincial/territorial hospital discharge records.
Year of data: All jurisdictions identified cases occurring as of 1995; with the exception of Quebec which began in 1996 and Nunavut which began in 2005. Estimates in this report refer to data from fiscal years 2000-2001 to 2011-2012. The data files used for the analysis include data contributed by the provinces and territories as of November 2015. The lag time between the year of the data and the reporting year is due to the necessity to fully process the data, both at the provincial/territorial and federal levels.
Chronic Respiratory Disease Feasibility Studies
The recommendation to expand the CCDSS to include asthma and COPD was developed in collaboration with six provinces (British Columbia, Alberta, Saskatchewan, Manitoba, Ontario and Nova Scotia) through two rounds of feasibility studies conducted in 2009 and 2010. The studies demonstrated the feasibility of using provincial administrative health data to generate comparable estimates of asthma and COPD across provinces. These results were used to support the inclusion of the case definitions for asthma and COPD, developed during the feasibility studies, into the CCDSS.
Diagnostic fields: In the feasibility studies, variations in the case definitions were tested to determine which would yield the best results. One such study occurred in Nova Scotia where the researchers compared the use of the first diagnostic field only versus three fields when searching for the diagnostic code in the physician billing claims database. The results showed that searching beyond the first diagnostic field to identify cases made a negligible difference in the asthma and COPD prevalence estimates.
Diagnostic codes excluded: ICD-9 490 and ICD-10-CA J40 (Bronchitis – not specified as acute or chronic) were excluded from the COPD case definition in the CCDSS. Including this code resulted in prevalence estimates double those where it was excluded and this code is not used in Ontario. It was decided by the CCDSS Chronic Respiratory Disease Working Group that this code could result in too many false positives (i.e., diagnoses captured by this code may not be true COPD cases).
Emergency room data: The feasibility studies examined the contribution of emergency room data to the prevalence estimates for asthma and COPD. The use of emergency room data in Alberta and Ontario captured an additional 10% and 13% of asthma cases respectively and an additional 33% and 25% of COPD cases respectively. However, not all provinces or territories have emergency room data. Consequently, recommendations for asthma and COPD case definitions for national surveillance did not include emergency room data.
Health events under surveillance: The health events under surveillance for the feasibility studies were:
- Asthma (ICD-9(-CM): 493, and ICD-10-CA: J45-J46); and
- COPD (ICD-9(-CM): 491-492, 496 and ICD-10-CA: J41-J44).
Other validation studies: Previous validation work in Ontario and Manitoba supports the two physician visits in two years or one hospital separation case definition for asthma. This work showed this case definition among adults was associated with a sensitivity of 84% and a specificity of 77% when compared with the expert panel reference standard.Footnote 18 The validation work in Manitoba showed that increasing the "search window" from one year to two years yields estimates that are closer to the community-based surveys, but increasing beyond two years had no effect on improving agreement between the two sources.Footnote 70
The previous validation work in Ontario supports the COPD case definition - one physician visit or one hospital separation ever - as this case definition was associated with a sensitivity of 85% and a specificity of 78%.Footnote 44
In order to allow for the "prevalence pool effect" to dissipate, data collected for the first five years were not reported. The five-year window was arrived at by plotting and observing when the incidence rates stabilized.Footnote d
Limitations of the CCDSS
The CCDSS may underestimate the burden of asthma and COPD as it relies partly on the physician billing claims database to identify cases. One of the limitations of this database is that physicians not paid on a fee-for-service basis are not always required to submit medical claims. Other payment schemes include salary, contract, capitation and partial fee-for-service. Alternative payment of physicians is more frequent for some specialties, in remote areas and for some primary health care centres. However, in some jurisdictions, physicians under alternative payment schemes are still expected to remit service information, otherwise known as "shadow billing". Both fee-for-service claims and shadow billing were included where available. Services for non-fee-for-service physicians who do not shadow bill are not captured. Currently, it is not possible to establish the magnitude of this impact at the national scale; further studies are required.
The data in the CCDSS are derived from physician billings claims and from hospital separation data. Canada has a single-payer health care system in each province and territory for which all residents are eligible. The coverage of Canadians under this system is 97%. Certain groups are not covered under provincial or territorial health care plans in Canada as they are covered under separate federally funded programs. The following are not included in provincial and territorial health care plans: members of the Canadian Armed Forces, members of the Royal Canadian Mounted Police and individuals residing in federal correctional facilities.
In addition, only those who have sought care are included in the CCDSS. Consequently, those who do not seek medical care are not captured; for example, those who are undiagnosed or are diagnosed prior to the observation period but do not require regular care because their asthma is well managed. Furthermore, among those who seek care, not all receive testing for airflow limitation via spirometry. According to the Canadian Thoracic Society's clinical practice guidelinesFootnote 71 and the Global Initiative for Chronic Obstructive Lung Disease (GOLD),Footnote 30 spirometry is the standard for confirming a diagnosis and staging the severity of the disease. However, a number of studies using spirometry have found that many individuals with airflow limitation were not previously diagnosed as having COPD (i.e., they were missed when diagnosis was based on signs and symptoms alone). Studies in Africa, Asia, Europe, Canada and the United States all showed higher COPD prevalence with spirometry than previously reported.Footnote 34Footnote 36Footnote 72Footnote 73Footnote 74
On the contrary, using the CCDSS, there is the potential for the accumulation of false positive cases of asthma. In other words, once someone is identified as a case, the person is always included in the database as a case, even if the person's symptoms resolve. However, the current case definition was adopted in order minimize the number of false positives as much as possible in order to reduce their impact on the data.
Appendix B: Case Definitions for Comorbid Conditions
Comorbid Diseases or Conditions
Comorbidity is the simultaneous existence of two or more diseases or conditions in an individual. Comorbidity for the purpose of respiratory disease in the CCDSS was defined as the co-existence in an individual of one of either asthma or COPD with diabetes, hypertension, mood and/or anxiety disorders, asthma (with COPD) or COPD (with asthma).
For asthma, the prevalence of four comorbid diseases or conditions was calculated among those with and without asthma. For diabetes and mood and/or anxiety disorders, the prevalence was calculated for those age one and older; for hypertension, it was calculated for those aged 20 years and older and for COPD, for those aged 35 years and older.
For COPD, the prevalence of COPD was reported among those with and without each of the comorbid conditions. Therefore the prevalence of COPD was calculated among those with and without diabetes, mood and/or anxiety disorders, hypertension and asthma. The prevalence was calculated among those aged 35 years and older among all four comorbid diseases or conditions, corresponding to the reporting age for COPD.
The following case definitions were used for the comorbid diseases and conditions:
Diabetes
Individuals aged one year and older, with at least one inpatient hospitalization listing a diagnostic code for diabetes in any diagnostic field, or at least two physician billing claims listing a diagnostic code for diabetes in any diagnostic field, in a two-year period (with probable cases of gestational diabetes removed). Once identified, an individual is considered a prevalent case for life.
Hypertension
Individuals aged 20 years and older, with at least one inpatient hospitalization listing a diagnostic code for hypertension in any diagnostic field, or at least two physician billing claims listing a diagnostic code for hypertension in any diagnostic field, in a two-year period (with probable cases of pregnancy-induced hypertension removed). Once identified, an individual is considered a prevalent case for life.
Mood and/or Anxiety Disorder
Individuals aged one and older with at least one physician billing claim listing a mood and/or anxiety diagnostic code in the first field, or one hospital discharge abstract listing a mood and/or anxiety diagnostic code in the most responsible diagnosis field in a one-year period.
Glossary
- Age-specific rate or proportion:
- The rate or proportion calculated for a specific age group.
- Age-standardized rate or proportion:
- A rate or proportion adjusted for the differences in population age structure between the study population and a reference population. Age-standardized rates or proportions are commonly used in trend analysis or when comparing different geographic areas or subpopulations.
- All-cause mortality:
- Mortality due to any cause of death.
- Asthma:
- Asthma is a common, chronic respiratory disease usually characterized by symptoms of cough, shortness of breath, chest tightness and wheeze. The CCDSS case definition of diagnosed asthma is: individuals aged one year and older having at least two visits to a physician with a diagnosis of asthma in the first diagnostic field in a two-year period, or at least one hospital separation with a diagnosis of asthma ever in any diagnostic field, coded by ICD-9(-CM) 493 or ICD-10-CA J45-46.
- Chronic Obstructive Pulmonary Disease (COPD):
- Chronic obstructive pulmonary disease (COPD) is a chronic disease with shortness of breath, cough and sputum production, also referred to as chronic bronchitis and emphysema. The CCDSS case definition of diagnosed COPD is: individuals aged 35 years and older having at least one visit to a physician with a diagnosis of COPD in the first diagnostic field, or one hospital separation with a diagnosis of COPD in any diagnostic field ever, coded by ICD-9(-CM) 491-492, 496 or ICD-10-CA J41-44.
- Comorbidity:
- Coexisting diseases or conditions which are additional to a specific disease or condition under study.
- Diabetes Mellitus:
- A chronic disease that occurs when the body is either unable to sufficiently produce or properly use insulin. There are various forms of diabetes (primarily type 1, type 2, gestational). If left uncontrolled, diabetes results in consistently high blood sugar levels (hyperglycemia), which may lead to serious complications. Diabetes is diagnosed when a patient has a fasting plasma glucose level greater or equal to 7.0 mmol/L, a 2-hour plasma glucose value in a 75 g oral glucose tolerance test greater or equal to 11.1 mmol/L or a glycated hemoglobin (A1C) value greater or equal to 6.5%.
- Feasibility study:
- A study conducted to determine if data are appropriate to use for surveillance purposes.
- Fee-for-service:
- Payment of claims based on submission of individual medical services.
- Hospital separation:
- A hospital separation is the departure of an inpatient from hospital, either due to a discharge or death. Hospital separation records are completed by hospitals for each patient who is discharged or who dies in hospital. Hospital separation records provide data on the relative frequency of a disease and the trends in morbidity from it.Footnote 75
- Hypertension:
- A chronic condition that occurs when blood pressure is consistently high for long periods of time, leading to the damage of arteries and decreased blood flow to affected organs. Hypertension is defined as systolic blood pressure equal to or greater than 140 mmHg or diastolic blood pressure equal to or greater than 90 mmHg.
- Incidence:
- The number of new cases of a disease or condition occurring in a given time period in a population at risk, expressed as a rate or proportion.
- International Classification of Diseases (ICD):
- An international standard diagnostic classification for diseases and other health conditions for epidemiological, clinical and health management purposes. For example, it is used to monitor the incidence and prevalence of diseases and other health problems, providing a picture of the general health situation of countries and populations.Footnote 76
- Morbidity:
- Any departure, subjective or objective, from a state of physiological or psychological well-being.
- Mortality data:
- Mortality or death data are collected from death certificates by provincial and territorial registrars of vital statistics.
- Mortality rate:
- An estimate of the proportion of the population that dies during a specified period. Calculated as the number of deaths in a specified period of time (typically one year) divided by the population at risk of dying during that period (typically the mid-year population).
- Prevalence:
- The frequency of a disease or condition in a population during a defined period of time expressed as the proportion of that population that has the disease or condition. Prevalence provides a measure of the burden of the disease or condition in the population.
- Prevalence pool effect:
- The overestimation of incidence that results from the erroneous inclusion of cases that have had previous encounters with the health care system (physician visit or hospital admission) prior to the study observation period.
- Prevalence ratio:
- The ratio of two related measures. For example, the prevalence of a disease or condition among those with diagnosed asthma compared to those without diagnosed asthma.
- Pulmonary function tests:
- A group of tests that measure how well the lungs are working. They measure how much air the lungs can hold and how well the person can let the air out of the lungs. Pulmonary function tests are also called lung function tests. The most common pulmonary function tests are spirometry and total lung capacity. Spirometry measures how much and how quickly air can be exhaled from the lungs. Total lung capacity measures the total amount of air a person's lungs can hold.
- Rate ratio:
- The ratio of two related measures. For example, the all-cause mortality rate among those with diagnosed asthma compared to the all-cause mortality rate among those without diagnosed asthma.
- Relative percent change:
- A measure of relative change expressed as a percentage. It can be used to demonstrate how much a prevalence estimate at the end of a surveillance period increased or decreased relative to the estimate at the beginning of a surveillance period.
- Shadow billing:
- An administrative process whereby salaried physicians submit service provision information using provincial and territorial fee codes, even though they are reimbursed by other means of payment. Shadow billing can be used to maintain historical measures of service provision based on fee-for-service claims data.
- Standard population:
- A population structure that is used to provide a constant age distribution, so that the rates or proportions of different study populations can be adjusted for comparison (see age-standardized rate or proportion). The 2011 Canadian population was used to calculate age-standardized rates or proportions in this report.
Acknowledgements
This report is the result of the collaborative effort of many people across Canada. It is the culmination of three years of preliminary work and feasibility studies conducted by members of the Chronic Respiratory Disease Working Group of the Canadian Chronic Disease Surveillance System.
The Public Health Agency of Canada wishes to acknowledge, and graciously thank the following people for their contributions and support in all aspects of this report from the inception and testing of the idea of using administrative data for chronic respiratory disease surveillance, through to reviewing this report.
Chronic Respiratory Disease Working Group Members (Past and Present)
- Andrea Gershon, Institute for Clinical Evaluative Sciences
- Anita Kozyrskyj, University of Alberta
- Bogdan Bogdanovic, University of Manitoba
- Danielle Saint-Laurent, Institut national de santé publique du Québec
- Darcy Marciniuk, University of Saskatchewan
- Drona Rasali, Ministry of Health Saskatchewan (past), BC Centre for Disease Control (present)
- Gary Teare, University of Saskatchewan
- Helena Klomp, Health Quality Council, Saskatchewan
- Janice Hawkey, Saskatchewan Health
- Kim Reimer, BC Ministry of Healthy
- Larry Svenson, Alberta Health and Wellness
- Lisa Lix, Manitoba Centre for Health Policy
- Mariève Doucet, Institut national de santé publique du Québec
- Mark Smith, University of Manitoba
- Mathew Standbrook, University of Toronto
- Nancy Garvey, Ontario Ministry of Health and Long Term Care
- Nikolaos Yiannakoulias, McMaster University
- Pat Camp, University of British Columbia
- Peter Nestman, Dalhousie University
- Robert Campbell, Concordia University College of Alberta
- Robert Prosser, RJ Prosser & Associates
- Teresa To, Hospital for Sick Children
- Upal Nath, University of Manitoba
- William Osei, Saskatchewan Health
- Yue Chen, University of Ottawa
- Zaman Kamruzzaman, Ministry of Health, Saskatchewan
Public Health Agency of Canada Production Team (past and present)
- Sharon Bartholomew
- Sylvie Desjardins
- Joellyn Ellison
- Jessica Evans
- Natalie Gabora
- Yong Jun Gao
- Charles Gilbert
- Lise Lévesque
- Bob McRae
- Louise McRae
- Jay Onysko
- Catherine Pelletier
- Kristina Sabou
- Jennette Toews
- Bruce Tudin
- Chris Waters
This report was made possible through collaboration between PHAC and the respective governments of Alberta, British Columbia, Manitoba, New Brunswick, Newfoundland and Labrador, Nova Scotia, Northwest Territories, Nunavut, Ontario, Prince Edward Island, Quebec, Saskatchewan and Yukon. The opinions, results, and conclusions in this report are those of the authors. No endorsement by the above provinces and territories is intended or should be inferred.
References
- Footnote 1
Global Initiative for Asthma (GINA). Global strategy for asthma management and prevention [Internet]. GINA; [updated 2016; cited 2016 June 17]. Available at: http://ginasthma.org/gina-reports/
- Footnote 2
Fromer L, Cooper CB. A review of the GOLD guidelines for the diagnosis and treatment of patients with COPD. Int J Clin Pract. 2008 Aug;62(8):1219-36.
- Footnote 3
Eisner MD, Anthonisen N, Coultas D, Kuenzli N, Perez-Padilla R, Postma D et al. On behalf of the Environmental and Occupational Health Assembly Committee on Nonsmoking COPD. An official American Thoracic Society public policy statement: Novel risk factors and the global burden of chronic obstructive pulmonary disease. Am J Respir Crit Care Med. 2010 Sep;182(5):693-718.
- Footnote 4
Rabe KF, Hurd S, Anzueto A, Barnes PJ, Buist SA, Calverley P, et al. Global strategy for the diagnosis, management, and prevention of chronic obstructive pulmonary disease: GOLD executive summary. Am J Respir Crit Care Med. 2007 Sep;176(6):532-55.
- Footnote 5
Caramori G, Adcock I. Gene-environment interactions in the development of chronic obstructive pulmonary disease. Curr Opin Allergy Clin Immunol. 2006 Oct;6(5):323-8.
- Footnote 6
Chen Z-H, Kim HP, Ryter SW, Choi AMK. Identifying targets for COPD treatment through gene expression analyses. Int J Chron Obstruct Pulmon Dis. 2008 Sep;3(3):359-70.
- Footnote 7
Dahl M, Nordestgaard BG. Markers of early disease and prognosis in COPD. Int J Chron Obstruct Pulmon Dis. 2009 Apr;4:157-67.
- Footnote 8
Bush A. COPD: a pediatric disease. COPD. 2008 Feb;5(1):53-67.
- Footnote 9
Svanes C, Sunyer J, Plana E, Dharmage S, Heinrich J, Jarvis D, et al. Early life origins of chronic obstructive pulmonary disease. Thorax. 2010 Jan;65(1):14-20.
- Footnote 10
Stern DA, Morgan WJ, Wright AL, Guerra S, Martinez FD. Poor airway function in early infancy and lung function by age 22 years: a non-selective longitudinal cohort study. Lancet. 2007 Sep;370(9589):758-64.
- Footnote 11
Statistics Canada. Table 102-0563 - Leading causes of death, total population, by sex, Canada, provinces and territories, annual, CANSIM (database) [Internet]. Ottawa, ON, Canada [updated 2015 Dec 10; cited 2016 May 31]. Available at: http://www5.statcan.gc.ca/cansim/a26?lang=eng&retrLang=eng&id=1020563&&pattern=&stByVal=1&p1=1&p2=-1&tabMode=dataTable&csid=
- Footnote 12
Health Canada. Strong foundation, renewed focus. An overview of Canada's Federal Tobacco Control Strategy 2012-17 [Internet]. Ottawa, ON, Canada [cited 2016 May 31]. Available at: http://healthycanadians.gc.ca/publications/healthy-living-vie-saine/tobacco-strategy-2012-2017-strategie-tabagisme/alt/tobacco-strategy-2012-2017-strategie-tabagisme-eng.pdf
- Footnote 13
Reid JL, Hammond D, Rynard VL, Burkhalter R. Tobacco Use in Canada: Patterns and Trends, 2015 Edition. Waterloo, ON: Propel Centre for Population Health Impact, University of Waterloo. Available at: http://www.tobaccoreport.ca
- Footnote 14
World Health Organization. Asthma. Fact sheet No 307 [Internet]. World Health Organization; [updated 2013 Nov; cited 2016 May 31]. Available at: http://www.who.int/mediacentre/factsheets/fs307/en/
- Footnote 15
Masoli M, Fabian D, Holt S, Beasley R, for the Global Initiative for Asthma (GINA) program. The global burden of asthma: executive summary of the GINA Dissemination Committee Report. Allergy. 2004 May;59(5):469-78.
- Footnote 16
Global Burden of Disease Study 2015. Global Burden of Disease Study 2015 Disability-adjusted Life Years and Life Expectancy 1990-2015 [Internet]. Institute for Health Metrics and Evaluation; [updated 2016 Nov 8; cited 2017 Feb10]. Available at: http://ghdx.healthdata.org/record/global-burden-disease-study-2015-gbd-2015-disability-adjusted-life-years-and-healthy-life
- Footnote 17
To T, Dell S, Dick PT, Cicutto L, Harris JK, MacLusky IB, et al. Case verification of children with asthma in Ontario. Pediatr Allergy Immunol. 2006 Feb;17(1):69-76.
- Footnote 18
Gershon AS, Wang C, Guan J, Vasilevska-Ristovska J, Cicutto L, To T. Identifying patients with physician-diagnosed asthma in health administrative databases. Can Respir J. 2009 Nov/Dec;16(6):183-8.
- Footnote 19
Bisgaard H, Bønnelykke. Long-term studies of the natural history of asthma in childhood. Allergy Clin Immunol. 2010 Aug;126(2):187-97.
- Footnote 20
Gershon AS, Guan J, Wang C, To T. Trends in asthma prevalence and incidence in Ontario, Canada, 1996-2005: A population study. Am J Epidemiol. 2010 Sep;172(6):728-36.
- Footnote 21
Lougheed MD, Lemiere C, Ducharme FM, Licskai C, Dell SD, Rowe BH, et al. Canadian Thoracic Society Asthma Clinical Assembly. Canadian Thoracic Society 2012 guideline update: Diagnosis and management of asthma in preschoolers, children and adults: executive summary. Can Respir J. 2012 Nov-Dec;19(6):e81-8.
- Footnote 22
Chen Y, Dales R, Krewski D, Breithaupt K. Increased effects of smoking and obesity on asthma among female Canadians: The National Population Health Survey, 1994-1995. Am J Epidemiol. 1999 Aug;150(3):255-62.
- Footnote 23
Schaubel D, Johansen H, Dutta M, Desmeules M, Becker A, Mao Y. Neonatal characteristics as risk factors for preschool asthma. J Asthma. 1996 Jan;33(4):255-64.
- Footnote 24
Thompson AE, Anisimowicz Y, Miedemo B, Hogg W, Wodchis WP, Aubrey-Bassler K. The influence of gender and other patient characteristics on health care-seeking behaviour: a QUALICOPC study [Internet]. BMC Fam Pract. 2016 Mar 31 [cited 2017 Feb 9];17(38). Available at: https://bmcfampract.biomedcentral.com/articles/10.1186/s12875-016-0440-0
- Footnote 25
Gibson PG, Simpson JL. The overlap syndrome of asthma and COPD: what are its features and how important is it? Thorax. 2009 Aug;64(8):728-35.
- Footnote 26
Marsh SE, Travers J, Weatherall M, Williams MV, Aldington S, Hansell AL, et al. Proportional classifications of COPD phenotypes. Thorax. 2008 Sep;63(9):761-7.
- Footnote 27
Tinkelman DG, Price DB, Nordyke RJ, Halbert RJ. Misdiagnosis of COPD and asthma in primary care patients 40 years of age and over. J Asthma. 2006 Jan-Feb;43(1):75-80.
- Footnote 28
Kuebler KK, Buchsel PC, Balkstra CR. Differentiating chronic obstructive pulmonary disease from asthma. J Am Acad Nurse Pract. 2008 Sep;20(9):445-54.
- Footnote 29
Lougheed MD, Lemiere C, Dell SD, Ducharme FM, FitzGerald JM, Leigh R, et al. Canadian Thoracic Society Asthma Management Continuum — 2010 Consensus Summary for children six years of age and over, and adults. Can Respir J. 2010 Jan/Feb;17(1):15-24.
- Footnote 30
Global initiative for chronic obstructive lung disease (GOLD): Global strategy for the diagnosis, management, and prevention of Chronic Obstructive Pulmonary Disease [Internet]. GOLD; [updated 2016; cited 2016 June 17]. Available at: http://goldcopd.org
- Footnote 31
Barnett M. An overview of assessment and management in COPD. Br J Community Nurs. 2009 May;14(5):195-201.
- Footnote 32
Miller JJ, MacNee W. What's new in COPD? Scott Med J. 2007 May;52(2):36-41.
- Footnote 33
Balkissoon R, Lommatzsch S, Carolan B, Make B. Chronic obstructive pulmonary disease: a concise review. Med Clin North Am. 2011 Nov;95(6):1125-41.
- Footnote 34
Buist AS, McBurnie MA, Vollmer WM, Gillespie S, Burney P, Mannino DM, et al. International variation in the prevalence of COPD (the BOLD study): a population-based prevalence study. Lancet. 2007 Sep;370(9589):741-50.
- Footnote 35
Gershon AS, Wang C, Wilton AS, Raut R, To T. Trends in chronic obstructive pulmonary disease prevalence, incidence, and mortality in Ontario, Canada, 1996 to 2007: A population-based study. Arch Intern Med. 2010 Mar;170(6):560-5.
- Footnote 36
Evans J, Chen Y, Camp PG, Bowie DM, McRae L. Estimating the prevalence of COPD in Canada: Reported diagnosis versus measured airflow obstruction. Health Reports. 2014 Mar;25(3):3-11.
- Footnote 37
World Health Organization. The top 10 causes of death. Fact sheet No 310 [Internet]. World Health Organization [updated 2014 May;cited 2016 Sept 30]. Available at: http://www.who.int/mediacentre/factsheets/fs310/en/
- Footnote 38
Global Burden of Disease 2013 Mortality and Causes of Death Collaborators. Global, regional, and national age-specific all-cause and cause-specific mortality for 240 causes of death, 1990-2013: a systematic analysis for the Global Burden of Disease Study 2013. Lancet. 2015 Jan:385(9963):117-71.
- Footnote 39
Global Burden of Disease Study 2013 Collaborators. Global, regional, and national incidence, prevalence, and years lived with disability for 301 acute and chronic diseases and injuries in 188 countries, 1990-2013: a systematic analysis for the Global Burden of Disease Study 2013. Lancet. 2015 Aug: 386 (9995): 743-800.
- Footnote 40
Berry CE, Wise RA. Mortality in COPD: Causes, risk factors, and prevention. COPD. 2010 Oct;7(5):375-82.
- Footnote 41
Halpin D. Mortality in COPD: Inevitable or preventable? Insights from the cardiovascular arena. COPD. 2008 Jun;5(3):187-200.
- Footnote 42
Bryan A, Navaneelan, T. Deaths from Chronic Obstructive Pulmonary Disease in Canada, 1950 to 2011. Health at a Glance. 2015 Nov. Statistics Canada Catalogue no. 82-624-X.
- Footnote 43
Gershon AS, Warner L, Cascagnette P, Victor JC, To T. Lifetime risk of developing chronic obstructive pulmonary disease: a longitudinal population study. Lancet. 2011 Sep;378(9795):991-6.
- Footnote 44
Gershon AS, Wang C, Guan J, Vasilevska-Ristovska J, Cicutto L, To T. Identifying individuals with physician diagnosed COPD in health administrative databases. COPD. 2009 Oct;6(5):388-94.
- Footnote 45
French DJ, Jang SN, Tait RJ, Anstey KJ. Cross-national gender differences in the socioeconomic factors associated with smoking in Australia, the United States of America and South Korea. Int J Public Health. 2013 Jun;58(3):345-53.
- Footnote 46
Hitchman SC, Fong GT. Gender empowerment and female-to-male smoking prevalence ratios. Bull World Health Organ. 2011 Mar;89(3):195-202.
- Footnote 47
Corsi DJ, Subramanian SV, Lear SA, Chow CK, Teo KK, Boyle MH. Co-variation in dimensions of smoking behaviour: A multivariate analysis of individuals and communities in Canada. Health Place. 2013 Jul;22:29-37.
- Footnote 48
Dedobbeleer N, Beland F, Contandriopoulos AP, Adrian M. Gender and the social context of smoking behaviour. Soc Sci Med. 2004 Jan;58(1):1-12.
- Footnote 49
Health Canada. The national strategy: Moving forward - the 2006 progress report on tobacco control [Internet]. Ottawa (Ontario): Health Canada; [updated 2006; cited 2016 Jan 10]. Available at: http://www.hc-sc.gc.ca/hc-ps/alt_formats/hecs-sesc/pdf/pubs/tobac-tabac/prtc-relct-2006/prtc-relct-2006-eng.pdf
- Footnote 50
Health Canada. Supplementary Tables, Youth Smoking Survey 2012-2013. [Internet]. Ottawa (Ontario): Health Canada; [updated 2014 June 03; cited 2016 May 26]. Available at: http://healthycanadians.gc.ca/publications/healthy-living-vie-saine/youth-smoking-survey-tables-2012-2013-tableaux-enquete-jeunes-tabagisme/index-eng.php
- Footnote 51
Statistics Canada. Table 105-0501 - Canadian Community Health Survey, 2014. Health indicator profile, annual estimates, by age group and sex, Canada, provinces, territories, health regions (2013 boundaries) and peer groups. CANSIM (database) [Internet]. Ottawa, ON, Canada [updated 2016 April 22; cited: 2016 May 31). Available at: http://www5.statcan.gc.ca/cansim/a26?lang=eng&id=1050501
- Footnote 52
Silva GE, Sherrill DL, Guerra S, Barbee RA. Asthma as a risk factor for COPD in a longitudinal study. Chest. 2004 Jul;126(1):59-65.
- Footnote 53
Sin DD, Anthonisen NR, Soriano JB, Agusti AG. Mortality in COPD: role of comorbidities. Eur Respir J. 2006 Dec;28(6):1245-57.
- Footnote 54
Jensen HH, Godtfredsen NS, Lange P, Vestbo J. Potential misclassification of causes of death from COPD. Eur Respir J. 2006 Oct;28(4):781-5.
- Footnote 55
Fabbri LM, Luppi F, Beghe B, Rabe KF. Update in chronic obstructive pulmonary disease 2005. Am J Respir Crit Care Med. 2006 May;173(10):1056-65.
- Footnote 56
Arne M, Lisspers K, Stallberg B, Boman G, Hedenstrom H, Janson C, et al. How often is diagnosis of COPD confirmed with spirometry? Respir Med. 2010 Apr;104(4):550-6.
- Footnote 57
Anthonisen NR, Wooldrage K, Manfreda J. Use of spirometry and respiratory drugs in Manitobans over 35 years of age with obstructive lung diseases. Can Respir J. 2005 Mar;12(2):69-74.
- Footnote 58
Damarla M, Celli BR, Mullerova HX, Pinto-Plata VM. Discrepancy in the use of confirmatory tests in patients hospitalized with the diagnosis of chronic obstructive pulmonary disease or congestive heart failure. Respir Care. 2006 Oct;51(10):1120-4.
- Footnote 59
Gershon AS, Hwee J, Croxford R, Aaron SD, To T. Patient and physician factors associated with pulmonary function testing for COPD: A population study. Chest. 2014 Feb;145(2):272-81.
- Footnote 60
Han MK, Kim MG, Mardon R, Renner P, Sullivan S, Diette GB, et al. Spirometry utilization for COPD: How do we measure up? Chest. 2007 Aug;132(2):403-9.
- Footnote 61
Joo MJ, Lee TA, Weiss KB. Geographic variation of spirometry use in newly diagnosed COPD. Chest. 2008 Jul;134(1):38-45.
- Footnote 62
Lee TA, Bartle B, Weiss KB. Spirometry use in clinical practice following diagnosis of COPD. Chest. 2006 Jun;129(6):1509-15.
- Footnote 63
Mapel DW, Picchi MA, Hurley JS, Frost FJ, Petersen HV, Mapel VM, et al. Utilization in COPD: Patient characteristics and diagnostic evaluation. Chest. 2000 May;117(5 Suppl 2):346S-53S.
- Footnote 64
Soriano JB, Rodriguez-Roisin R. Chronic obstructive pulmonary disease overview: epidemiology, risk factors, and clinical presentation. Proc Am Thorac Soc. 2011 Aug;8(4):363-7.
- Footnote 65
Coultas DB, Mapel D, Gagnon R, Lydick E. The health impact of undiagnosed airflow obstruction in a national sample of United States adults. Am J Respir Crit Care Med. 2001 Aug;164(3):372-7.
- Footnote 66
Coultas DB, Mapel DW. Undiagnosed airflow obstruction: prevalence and implications. Curr Opin Pulm Med. 2003 Mar;9(2):96-103.
- Footnote 67
Drummond MB, Wise RA, John M, Zvarich MT, McGarvey LP. Accuracy of death certificates in COPD: analysis from the TORCH trail. COPD. 2010 Jun;7(3):179-85.
- Footnote 68
Corlateanu A, Covantev S, Mathioudakis AG, Botnaru V, Siafakas. Prevalence and burden of comorbidities in Chronic Obstructive Pulmonary Disease. Respir Investig. 2016 Nov;54(6):387-96.
- Footnote 69
Downs CA, Appel SJ. Chronic obstructive pulmonary disease: Diagnosis and management. J Am Acad Nurse Pract. 2007 Mar;19(3):126-32.
- Footnote 70
Huzel L, Roos LL, Anthonisen NR, Manfreda J. Diagnosing asthma: The fit between survey and administrative database. Can Respir J. 2002 Nov/Dec;9(6):407-12.
- Footnote 71
Coates AL, Graham BL, McFadden RG, McParland C, Moosa D, Provencher S, et al. Spirometry in primary care. Can Respir J. 2013 Jan/Feb;20(1):13-22.
- Footnote 72
Fang X, Wang X, Bai C. COPD in China: The burden and importance of proper management. Chest. 2011 Apr;139(4):920-9.
- Footnote 73
Mehrotra A, Oluwole AM, Gordon SB. The burden of COPD in Africa: a literature review and prospective survey of the availability of spirometry for COPD diagnosis in Africa. Trop Med Int Health. 2009 Aug;14(8):840-8.
- Footnote 74
Statistics Canada. Chronic obstructive pulmonary disease in Canadians, 2009 to 2011. Health Fact Sheet (Catalogue 82-625-X). Ottawa: Statistics Canada, 2013.Available at: http://www.statcan.gc.ca/pub/82-625-x/2012001/article/11709-eng.htm
- Footnote 75
Canadian Institute for Health Information. Hospital Mental Health Services in Canada, 2005 2006. Ottawa, ON, Canada [cited 2016 Nov 4]. Available at: https://secure.cihi.ca/free_products/Hmhdb_annual_report_2008_e.pdf
- Footnote 76
World Health Organization. International Classification of Diseases (ICD) [Internet]. World Health Organization [cited 2016 Nov 4]. Available at: http:www.who.int/classifications/icd/en
Footnotes
- Footnote a
The CCDSS estimates represent the prevalence of health service use for mood and anxiety disorders rather than the prevalence of diagnosed mood and anxiety disorders. The CCDSS may capture individuals who do not meet all standard diagnostic criteria for mood and anxiety disorders but were assigned a diagnostic code based on clinical assessment. Conversely, the CCDSS does not capture individuals meeting all standard diagnostic criteria for mood and anxiety disorders who did not receive a relevant diagnostic code (includes those who sought care but were not captured in provincial and territorial administrative health databases and those who have not sought care at all).
- Footnote b
Note: the converse was done for COPD in Chapter 2, i.e. the proportions of COPD among those with/without the comorbid diseases or conditions were compared, at the recommendation of the Chronic Respiratory Disease Working Group.
- Footnote c
The CCDSS estimates represent the prevalence of health service use for mood and anxiety disorders rather than the prevalence of diagnosed mood and anxiety disorders. The CCDSS may capture individuals who do not meet all standard diagnostic criteria for mood and anxiety disorders but were assigned a diagnostic code based on clinical assessment. Conversely, the CCDSS does not capture individuals meeting all standard diagnostic criteria for mood and anxiety disorders who did not receive a relevant diagnostic code (includes those who sought care but were not captured in provincial and territorial administrative health databases and those who have not sought care at all).
- Footnote d
The exception to the run-in period is Nunavut. A run-in period was not applied as the data were only available beginning in 2005.