
Autism Spectrum Disorder among Children and Youth in Canada 2018
A Report of the National Autism Spectrum Disorder Surveillance System
Download the alternative format
(PDF format, 837 KB, 42 pages)
Organization: Public Health Agency of Canada
Published: March 2018
Foreword
Foreword Message from the Chief Public Health Officer
As Chief Public Health Officer, I am pleased to present the National Autism Spectrum Disorder Surveillance System (NASS) 2018 Report. This surveillance report is “Made in Canada” and provides a first reporting of national data and information to improve our understanding of Autism Spectrum Disorder (ASD) in Canada.
Approximately 1 in 66 children and youth are diagnosed with ASD in Canada. For families, an ASD diagnosis can involve significant emotional and financial challenges. For those in health, education and social services sectors, ASD is an important issue due to the resources those living with ASD require for intervention and treatment and due to the on-going impact on the health and well-being of Canadian children, youth, adults and their families and communities.
A critical aspect in responding to ASD in Canada is addressing key knowledge gaps in our understanding of the number and characteristics of people diagnosed with ASD both across regions and over time. To contribute towards this need, and consistent with its core role for health surveillance, the Public Health Agency of Canada has developed the NASS. The NASS is a collaboration of federal, provincial and territorial governments, working together to build a comprehensive picture of ASD in Canada.
It is my hope that this report will be a valuable resource for health, and other professionals, government organizations and researchers to inform ASD programs and support evidence-based decision making in Canada.
I would like to take this opportunity to thank the organizations and individuals who have dedicated their time and expertise to collaborate on this report. These include members of the National ASD Advisory Committee and collaborators from participating provincial and territorial governments. The Public Health Agency of Canada is pleased to work with these individuals in our shared commitment to improving the health of Canadians.
Table of Contents
- Executive summary
- Introduction
- What is Autism Spectrum Disorder (ASD)?
- What is public health surveillance?
- What is the National Autism Spectrum Disorder Surveillance System (NASS)?
- How was NASS developed?
- What methodology is used to collect data?
- Who is counted?
- What information is counted?
- What data sources were used to collect data?
- National results
- What proportion of children and youth are represented in 2015 results?
- How many children and youth were identified with ASD in 2015?
- How do ASD prevalence rates differ by sex and age?
- At what age are children and youth with ASD typically diagnosed?
- How do results vary by province and territory?
- How do results compare with earlier years?
- What rates of incidence were reported for 2015?
- How do NASS results compare with results from the United States?
- Provincial and Territorial Results
- Future Directions
- Technical Annex: NASS Surveillance Methods
- List of acronyms
- References
List of figures
- Figure 1 - Incidence and prevalence illustration
- Figure 2 - Provinces and territories by ASD data source for NASS, 2015
- Figure 3 - ASD prevalence among 5–17 year olds, 2015
- Figure 4 - ASD prevalence by sex, 2015
- Figure 5 - Percentage of males and females with ASD by age, 2015
- Figure 6 - ASD prevalence per 1,000 by age and sex, 2015
- Figure 7 - The cumulative percentage of 5–17 year olds with ASD by age of diagnosis, 2015
- Figure 8 - ASD prevalence per 1,000 by province, territory and overall, 2015
- Figure 9 - ASD prevalence per 1,000 in Quebec, Newfoundland and Labrador, and Prince Edward Island from 2003–2015 among 5–14 year olds
- Figure 10 - ASD incidence rate per 10,000 by sex in Quebec, 2000-2015
- Figure 11 - ASD incidence rate by year and age group per 10,000 in Quebec, 2000-2015
- Figure 12 - Percentage of ASD cases diagnosed by age group and year, Quebec, 2000-2015
- Figure 13 - NASS data elements
List of tables
- Table 1 - ASD prevalence per 1,000 by province/territory and sex, 2015
- Table 2 - NASS and ADDM Network (Canada and United States) comparison
- Table 3 - Provincial and territorial comparisons by prevalence, population coverage, data sectors and sources, 2015
- Table 4 - NASS ASD case definition
- Table 5 - Assessment of the strength and limitations of NASS data
Authors: Marianna Ofner, PhD, Anthony Coles, MPA, Mary Lou Decou, MSc, Minh T Do, PhD, Asako Bienek, MHA, Judy Snider, MSc and Anne-Marie Ugnat, PhD.
Reviewers: Brittany Irvine, MA, Thomas Atkins, BA, Manal Salibi, MPH, and the members of the National ASD – Advisory Committee.
National ASD-Advisory Committee members: Robert Strang (Chair), MD, Anthony Bailey, (Past Chair), MBBS, Lonnie Zwaigenbaum, (Vice Chair), MD, Jessica Brian, PhD, Sheila Bulmer, MA, Linda Dodds, PhD, Jill Farber, Nathalie Garcin, PhD, Shari Joseph, PhD, Karen Kalynchuk, Brian Kelly, Laurie Mawlam, B.Com, Hélène Ouellette-Kuntz, PhD, Deborah Pugh, MA and Rosanna Weksberg, MD, PhD.
The Public Health Agency of Canada (PHAC) would like to acknowledge key people within the participating provinces and territories who contributed a significant amount of time and effort for the development of NASS: Newfoundland and Labrador - Paulette Jackman and Kerry Pope; Nova Scotia - Susan Jozsa and Don Glover; Prince Edward Island - Marlene Breitenbach and Chris Schwint; New Brunswick - Brian Kelly and Kim Korotkov; Quebec - Éric Pelletier and Louis Rochette; British Columbia - Michaela Jelena and Karen Bopp; and, the Yukon Territory - Karen Campbell.
PHAC would like to thank those who have contributed to the NASS program and this report, including: Lisa Belzak, Mitsi Cardinal, Maria Carvalho, Judy Foley, Margaret Herbert, Juan Andrés Leon, Tara Longpre, Wei Luo, Les Mery, Manon Noiseux, Jay Onysko, Claudia Vela and Paul Villeneuve.
Executive summary
The Public Health Agency of Canada’s National Autism Spectrum Disorder (ASD) Surveillance System (NASS) is a federally funded initiative to estimate and monitor the number of individuals with ASD. The initial phase of the program estimates this number among children and youth. The findings of the 2015 NASS report focuses on those aged 5–17 years, from six provinces and one territory: Newfoundland and Labrador, Nova Scotia, Prince Edward Island, New Brunswick, Quebec, British Columbia and the Yukon.
Summary of findings
- Among children and youth 5–17 years old across seven provinces and territory, the combined prevalence of ASD for the year 2015 is 1 in 66 (15.2 per 1,000).
- Males were diagnosed with ASD four times more frequently than females. NASS found that 1 in 42 males (23.9 per 1,000) and 1 in 165 females (6.0 per 1,000) aged 5–17 years old were diagnosed with ASD.
- Retrospective data from 2003–2015 from Newfoundland and Labrador, Prince Edward Island, and Quebec showed that, among 5–14 year olds, ASD prevalence has increased from 6.0 per 1,000 to 19.6 per 1,000 in Newfoundland and Labrador; from 5.0 per 1,000 to 17.7 per 1,000 in Prince Edward Island; and, from 3.5 per 1,000 to 15.7 per 1,000 in Quebec.
- In comparison to the Autism and Developmental Disabilities Monitoring (ADDM) Network from the United States’ Centers for Disease Control and Prevention (CDC), which looks only at 8 year olds, NASS’ prevalence was 1 in 63 (8 year olds) in the year 2015 versus the ADDM Network’s prevalence of 1 in 68 in the year 2012.
Introduction
The Public Health Agency of Canada (PHAC) acknowledges the efforts that are taking place across the country towards supporting those who are living with Autism Spectrum Disorder (ASD). Most of this support takes place in the health care, education and social services sectors – domains under the responsibility of provincial and territorial governments.
An essential aspect in supporting these front-line efforts is developing an understanding of the magnitude and characteristics of individuals with ASD both across regions and over time. Although there are existing repositories of ASD data across the country, there are no comprehensive and comparable national level data.
In response, PHAC has established the National ASD Surveillance System (NASS), with an initial focus on child and youth populations.
NASS is a collaboration of federal, provincial and territorial governments, working to build a comprehensive picture of ASD in Canada. NASS will contribute evidence to help inform critical planning of programs, services and research that impact Canadians living with ASD, their families and caregivers.
What is Autism Spectrum Disorder (ASD)?
ASD is a neurodevelopmental disorder that includes impairments in language, communication skills, and social interactions combined with restricted and repetitive behaviours, interests or activities.Footnote 1 Signs of ASD are typically detected in early childhood, with boys four to five times more frequently diagnosed with ASD than girls.Footnote 2
Each person with ASD is unique and will have different symptoms, deficits and abilities. Because of the range of characteristics, this condition is named a "spectrum" disorder, where ones' abilities and deficits can fall anywhere along a spectrum, and thereby, support needs may range from none to very substantial. It is a complex life-long condition that impacts not only the person with ASD, but their families, caregivers and communities.
In Canada, the diagnosis of ASD is usually provided by medical doctors or psychologists. ASD diagnostic assessments typically use both direct observation and developmental interviews to inform the diagnosing clinician's clinical judgement based on ASD criteria from the Diagnostic and Statistical Manual of Mental Disorders (i.e., DSM-5).Footnote 3
It is common for individuals living with ASD to have one or more comorbid conditions. Comorbid conditions are diseases or conditions that exist alongside a primary condition. In addition to other developmental disorders (Attention Deficit/Hyperactivity Disorder, language disorders, intellectual disability, sensory integration disorder), other comorbid conditions associated with ASD may include psychiatric, neurological, gastrointestinal and sleep disorders. These are often diagnosed as, but not limited to, depression, anxiety disorder, obsessive compulsive disorder, Tourette syndrome, seizures or epilepsy, insomnia and gastro-intestinal issues.Footnote 4
What is public health surveillance?
Public Health Surveillance is defined as the tracking and forecasting of any health event or health determinant through the on-going collection of data; their integration, analysis and interpretation; and, the communication of results for public information, policy and decision-making.
Surveillance is a core function of public health and PHAC; and, is viewed as an integral component of any public health strategy.
Recognizing shared responsibility with provinces and territories (PTs) on public health issues, PHAC works to build an effective public health system that enables Canadians to achieve better health and well-being. In this capacity, PHAC plays a unique role in leading and coordinating national public health initiatives.
What is the National Autism Spectrum Disorder Surveillance System (NASS)?
NASS is a collaboration of federal, provincial and territorial governments, working to build a comprehensive picture of ASD in Canada. NASS will contribute evidence to help inform critical planning of programs, services and research that impact Canadians living with ASD, their families and caregivers.
Led and coordinated by PHAC, NASS tracks the occurrence and demographic characteristics of children and youth with ASD, including estimates of prevalence, incidence and key characteristics, patterns and trends both over time and across geographic regions. NASS collects, analyzes and reports ASD data from multiple sectors such as health, education and social services.
The key objectives of NASS are to:
- Estimate how many children and youth in Canada have ASD (i.e. prevalence) and how many new cases (i.e. incidence) are emerging over time;
- Describe the population of children and youth in Canada with ASD and compare patterns within Canada and internationally;
- Increase public awareness and understanding; and,
- Inform research, policy and program decision-making.
How was NASS developed?
The 2008 Federal Budget committed to establishing a surveillance system for developmental disorders in Canada as part of the federal Action Plan to Protect Human Health from Environmental Contaminants. The initial focus has been placed on the surveillance of ASD in children and youth (i.e., developing NASS).
Following an initial phase to hire core staff to begin consulting provinces and territories (PTs) and planning the development of NASS, PHAC established the ASD-Advisory Committee (ASD-AC) in 2011 to advise on the most effective approaches to capture data on ASD across Canada. Members of this committee include national experts from the areas of surveillance, epidemiology, psychology, medicine, education and knowledge translation; and, representatives from national stakeholder organizations that represent individuals and families living with ASD.
From 2011 to 2013, environmental scans were conducted by PHAC within all PTs. ASD data holders and data sources across Canada were identified with the aid of the Healthy People and Communities Steering Committee of the Pan-Canadian Public Health Network. In 2007, prior to the inception of NASS development, PHAC coordinated a technical workshop with clinicians and researchers to determine surveillance needs and data options for a national system. A list of priority data elements to track ASD across Canada was developed. This list provided the basis of data elements sought through the scan. In total, 47 data sources were surveyed to assess corresponding case definitions and data elements for potential use in NASS.
The environmental scans were one of the major consultation pieces that informed the development of NASS, including: NASS ASD surveillance case definition; the data elements to be sought; NASS data dictionary (i.e., a common reference guide for data collection) and other national infrastructure components. The environmental scans were also instrumental in initiating partnerships with PT data holders; and, in validating that education, health and social services sectors would be the key data sources for developing NASS.
From 2012 to 2013, PHAC planned, developed and presented NASS implementation plans, including a collaborative and phased multi-sectoral PT engagement strategy, for approval by the Public Health Network as well as the Council of Chief Medical Officers of Health. This provided the impetus for NASS implementation. All PTs received Letters of Invitation to participate.
Subsequently, PHAC has been working closely with PT partners in the development of the surveillance system, via this collaborative and phased approach. This approach was designed to be inclusive and accommodate varying states of PT readiness; and, has allowed PHAC to engage individual PTs based on their capacity to participate and the readiness of their potential data sources.
The phased approach to NASS planning and implementation has included supporting PT partners in conducting preliminary feasibility and validation projects. These are the basis of negotiated agreements, the formal mechanisms for operationalizing program implementation. Key to NASS planning is ensuring that data collection can be reasonably standardized to inform comparable monitoring of trends over time and across regions.
Supported by federal funding, 2014 marked the first wave of PTs joining NASS. Following completion of some initial feasibility projects, validation studies and data sharing agreements with participating PTs, the first wave of data collection for NASS began in 2015. As of September 2017, seven PTs have contributed 2015 data to NASS. Additional PTs are being phased in as feasibility and validation work is completed in their respective regions.
What methodology is used to collect data?
A number of surveillance methods to estimate the prevalence of ASD were considered, most notably: record-review; survey data; and administrative data collection methods. Each of these methods uses a different approach to identify information.
A record-review method involves access to all available documents from health and/or education sources to identify children with ASD and/or ASD behaviours. The records are reviewed by trained professionals to classify cases. The survey data collection method involves the direct collection of data through standardized tools that are primarily administered with telephone or electronic questionnaires. The third method involves accessing details from administrative databasesNote i that have been designed by government agencies and other organizations to document the provision of health, education and/or social services. These data are then analyzed for surveillance purposes.
The use of an administrative data methodology is a more cost effective approach than either a record review or survey method. Administrative data have been previously and successfully used to describe ASD in Canada, in the National Epidemiological Database for the Study of Autism in Canada (NEDSAC).Note ii
Administrative data used in NASS are provided to PHAC under strict conditions and are governed by agreements reached between the data holders and PHAC. The Access to Information Act, Privacy Act, and legislation pertaining to data providers, govern the sharing of administrative data with PHAC.
Further description of the NASS surveillance methodology is provided in the section entitled, Technical Annex: NASS Surveillance Methods.
Who is counted?
NASS collects anonymized case-level or aggregated data based on administrative data from health, education or social service sectors, from participating PTs, on children and youth aged 5–17 years, diagnosed with ASD. Children less than 5 years of age and youth greater than 17 years of age were not included in this report as incomplete case capture was identified and denominator data were incomplete in some regions.
Given variability in age at diagnosis, the NASS population under surveillance focuses on an age range (i.e., 5–17 year olds), rather than a specific age (e.g., 8 year olds which is done in the United States), in order to provide a more comprehensive picture of the prevalence of ASD in Canada.
Age at diagnosis of ASD can be influenced by a number of factors that can include clinical characteristics, the complexity of clinical symptoms, socio-demographic status, parental awareness/concern, accessibility and proximity to assessment clinics or specialists, and systems interactions. A critical review of 42 studies found that the mean age at diagnosis for these studies ranged from 3–10 years old.Footnote 5 In a more recent study the median age at diagnosis was 5.3 years old, with a range of age of diagnosis from 2–17 years old.Footnote 6
For NASS, some PTs provided the median age of diagnosis whenever that information was available within their data source. Furthermore, NASS uses different data sources such as education, health and social services, which are more amendable to capture cases at different age ranges.
What information is counted?
NASS is particularly interested in reporting on two indicators with respect to ASD estimates in Canada:
Prevalence: The total number of cases diagnosed compared to the total number of individuals in a population for a specific time period (e.g., a specific year - 2015 or a specific date within a year), supporting comparisons by age, sex, region, time and/or other factors.
Incidence: The number of newly diagnosed cases in a specific time period (e.g. a specific year - 2015) in a defined population. This may inform a more targeted understanding of any changes (increases/decreases) by age, sex, region, time and/or other factors. For NASS, the incidence year is attributed to the year in which cases are first diagnosed.
Figure 1 - Incidence and prevalence illustration
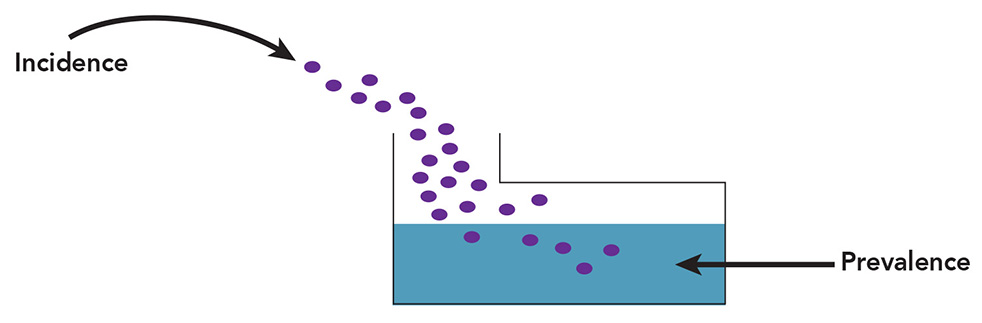
Figure 1 - Text description
Figure 1 presents a visualization of incidence and prevalence. A container represents the population. Dots outside of, and moving into, the container represent new incidence. These dots blend into the portion of the container that is filled. The filled area of the container represents prevalence. The dots once blended with the filled portion of the container collectively represent prevalence.
For ASD prevalence, the numerator is the total number of identified ASD cases collected from PT data; the denominator is the total number of Canadian children and youth at that point in time. Incidence denominator would only include the total number of Canadian children and youth who are not included as ASD cases. Estimates can be expressed as a percentage (i.e., X %); a rate (i.e., X per 1,000); and, as a ratio (i.e., 1 in X number).
The foundational principle in public health surveillance focuses on the continuous, systematic collection, analysis and interpretation of health-related data which is needed for the planning, implementation and evaluation of health practices. A standardized case definition is used to ensure uniform criteria are utilized when identifying cases enabling data to be counted and compared.
In consultation with the ASD-AC, a case definition for ASD surveillance, as well as data elements were established; both of which served to define the surveillance information that was needed to be gathered from PT data sources.
Further description of NASS case definition and data elements are provided in the section entitled, Technical Annex: NASS Surveillance Methods.
What data sources were used to collect data?
NASS data are collected from a variety of sources, namely from education, social services and health sectors. The data source for each PT was identified through the environmental scans conducted from 2011 to 2015. Figure 2 identifies the PT ASD data sources from the participating regions for NASS.
Figure 2 - Provinces and territories by ASD data source for NASS, 2015
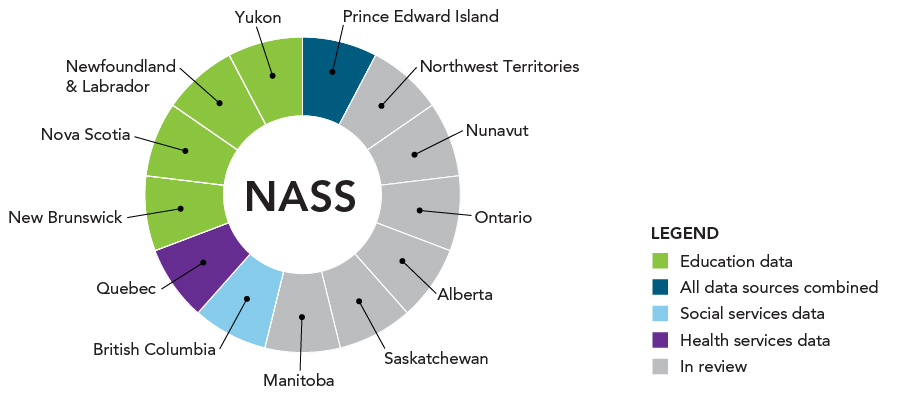
Figure 2 - Text description
Figure 2 illustrates the data sources of each of the 13 provinces and territories using a doughnut figure that has been colour coded to represent sources for each location. Five provinces use education data including: New Brunswick, Nova Scotia, Newfoundland and Labrador, and Yukon. Quebec uses Health Services data. British Columbia uses social services data. Prince Edward Island uses all data sources combined. The six remaining provinces and territories are under review for their data sources including: Northwest Territories, Nunavut, Ontario, Alberta, Saskatchewan, and Manitoba.
National results
What proportion of children and youth are represented in 2015 results?
Children and youth residing in the seven PTs participating in NASS represented a total of 40% of all children and youth aged 5–17 years across Canada (based on the 2011 Canadian census). Looking only at the population totals from the seven participating PTs in 2015, data collected by NASS represented a total of 88% of children and youth from the participating PTs.
How many children and youth were identified with ASD in 2015?
A combined prevalence of 1 in 66 children and youth (i.e., 15.2 per 1,000) 5–17 years of age were diagnosed with ASD in 2015 across the seven participating PTs (Figure 3). The number of children and youth with ASD varied between PTs, from 1 in 126 in the Yukon to 1 in 57 in Newfoundland and Labrador.
Figure 3 - ASD prevalence among 5–17 year olds, 2015
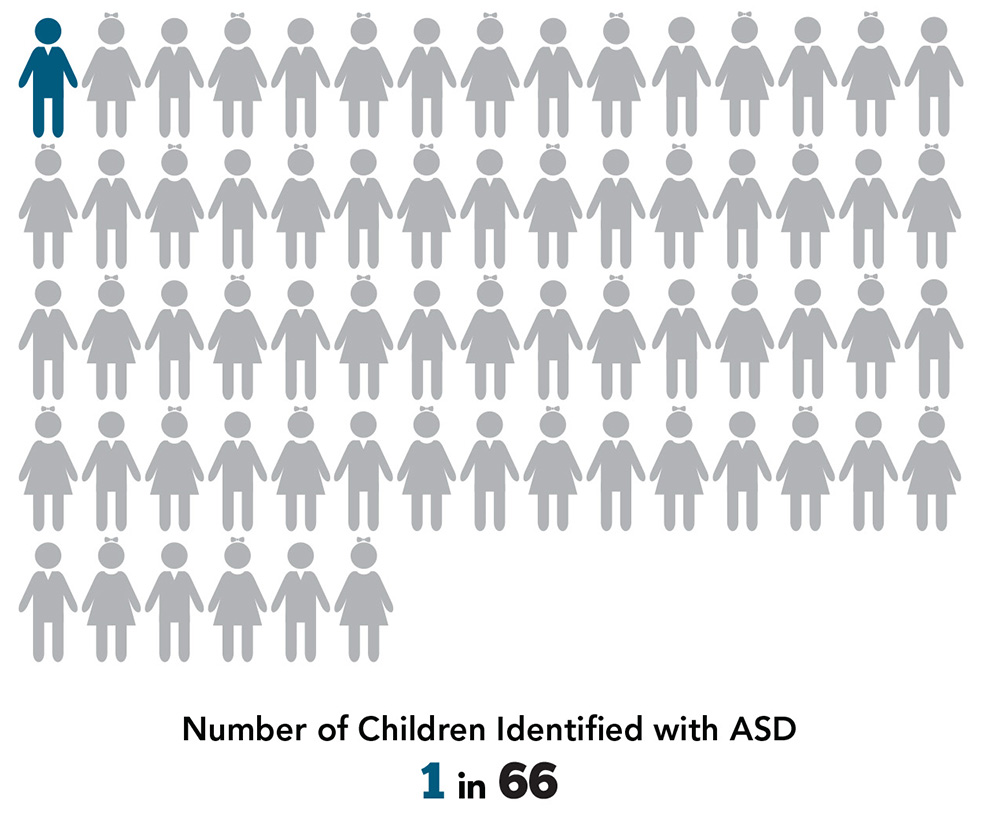
Figure 3 - Text description
This figure visually represents the number of children identified with ASD. By including 66 stick figures of males and females and having one figure uniquely coloured, it visualizes that one in every 66 children, 5-17 years old, was identified with ASD in 2015.
How do ASD prevalence rates differ by sex and age?
Prevalence estimates are reported as being much higher in males than females. In 2015, males were identified with ASD four times more frequently at 1 in 42 (i.e., 23.9 per 1,000) than females at 1 in 165 (i.e., 6.0 per 1,000) (Figure 4). Prevalence in males ranged from 12.8 per 1,000 (1 in 78) in the Yukon to 28.8 per 1,000 (1 in 35) in Newfoundland and Labrador. Prevalence in females ranged from 2.6 per 1,000 (1 in 379) in the Yukon to 6.5 per 1,000 (1 in 153) in Quebec.
Figure 4 - ASD prevalence by sex, 2015
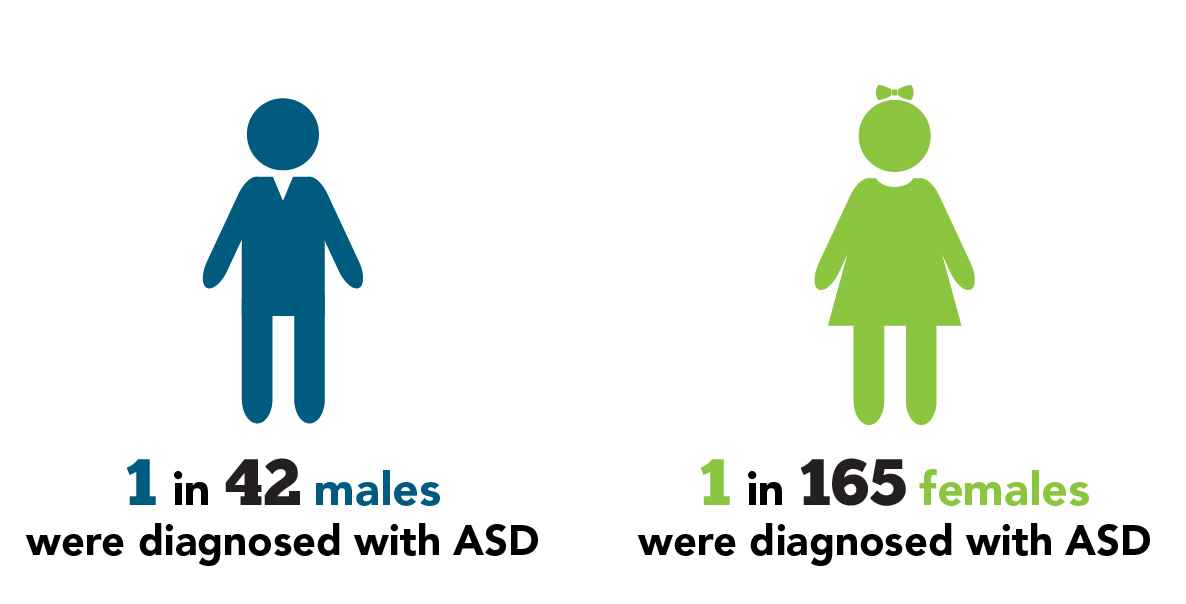
Figure 4 - Text description
This figure illustrates the prevalence of ASD by sex. It includes two stick figures, one male and the other female to highlight each sex. Each is holding a sign to represent prevalence for their sex. For males, 1 in 42 are diagnosed with ASD and for females, the prevalence is 1 in 165 diagnosed with ASD in 2015.
Figure 5 - Percentage of males and females with ASD by age, 2015
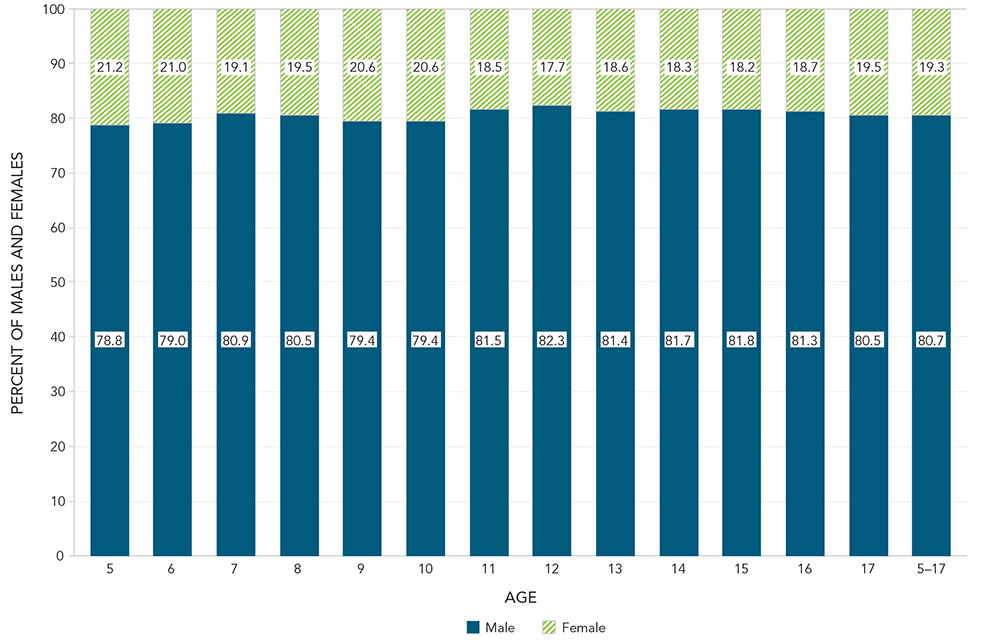
Figure 5 - Text description
This figure visualizes the percentage of males and females, by age, with ASD. It visualizes that for all ages, the greatest percentage of those with ASD are male. The Figure 5 table contains each of the data points represented in Figure 5.
| Age (years) | Sex | |
|---|---|---|
| Male | Female | |
| 5 | 78.8 | 21.2 |
| 6 | 79.0 | 21.0 |
| 7 | 80.9 | 19.1 |
| 8 | 80.5 | 19.5 |
| 9 | 79.4 | 20.6 |
| 10 | 79.4 | 20.6 |
| 11 | 81.5 | 18.5 |
| 12 | 82.3 | 17.7 |
| 13 | 81.4 | 18.6 |
| 14 | 81.7 | 18.3 |
| 15 | 81.8 | 18.2 |
| 16 | 81.3 | 18.7 |
| 17 | 80.5 | 19.5 |
| 5-17 | 80.7 | 19.3 |
The proportion of males to females is consistently greater across all ages, as displayed in Figure 5.
Figure 6 - ASD prevalence per 1,000 by age and sex, 2015
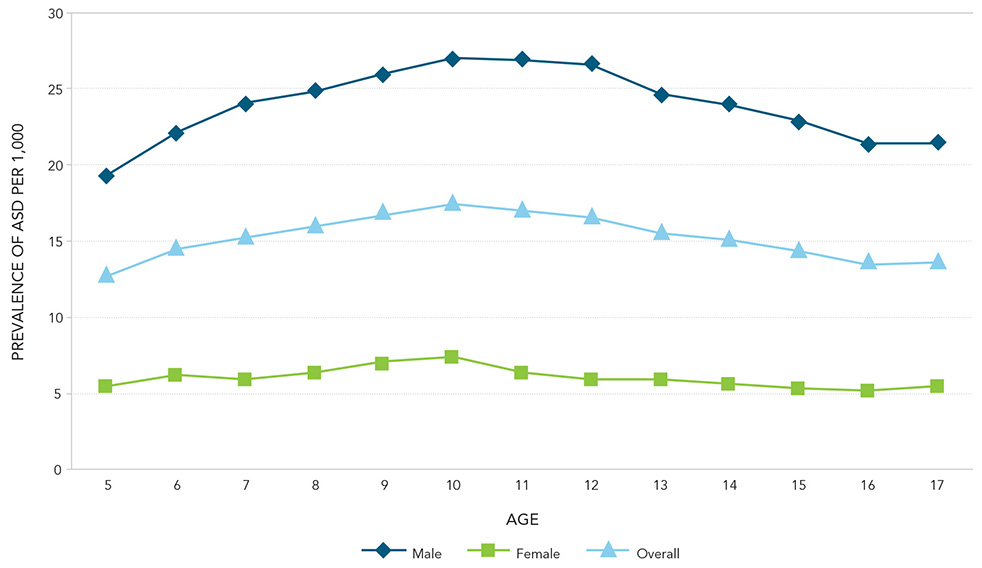
Figure 6 - Text description
Figure 6 presents line charts of prevalence per 1,000 by age and sex for ASD by sex and and for both sexes combined for children ages 5 to 17 years for 2015. The pattern is similar for both sexes. Prevalence among males is consistently higher than among females. For males and females, the trends show similar variability with the highest prevalence observed at 10 years of age. This figure does not mean that the prevalence of ASD decreases with age rather that the majority of cases are diagnosed at a younger age at this point in time. The Figure 6 table contains each of the data points represented in Figure 6.
| Age (years) | Sex | ||
|---|---|---|---|
| Male | Female | Overall | |
| 5 | 19.3 | 5.5 | 12.6 |
| 6 | 22.1 | 6.3 | 14.4 |
| 7 | 24.0 | 6.0 | 15.2 |
| 8 | 24.9 | 6.4 | 15.9 |
| 9 | 25.9 | 7.1 | 16.7 |
| 10 | 27.0 | 7.3 | 17.4 |
| 11 | 27.0 | 6.4 | 16.9 |
| 12 | 26.6 | 6.0 | 16.5 |
| 13 | 24.6 | 5.9 | 15.5 |
| 14 | 24.0 | 5.6 | 15.0 |
| 15 | 22.8 | 5.4 | 14.3 |
| 16 | 21.4 | 5.1 | 13.5 |
| 17 | 21.4 | 5.4 | 13.6 |
Figure 6 presents a cross-sectional snap-shot in 2015 of ASD prevalence by age and sex. This figure does not mean that the prevalence of ASD decreases with age, rather that the majority of cases are diagnosed at a younger age at this point in time (year 2015), perhaps due to increased incidence or other factors. Prevalence among males is consistently higher than among females.
At what age are children and youth with ASD typically diagnosed?
Among those diagnosed by 17 years of age, 56% had received their diagnosis by 6 years of age; almost three-quarters (i.e., 72%) had been diagnosed by 8 years of age; and less than 10% were diagnosed after 12 years of age. Figure 7 illustrates the distribution of ASD cases diagnosed by 17 years old, by age of diagnosis as a cumulative percentage, among 5–17 year olds in 2015. These data represent cases from Prince Edward Island, Nova Scotia, Newfoundland and Labrador and the Yukon.
Figure 7 - The cumulative percentage of 5–17 year olds with ASD by age of diagnosis, 2015Figure 7 note *
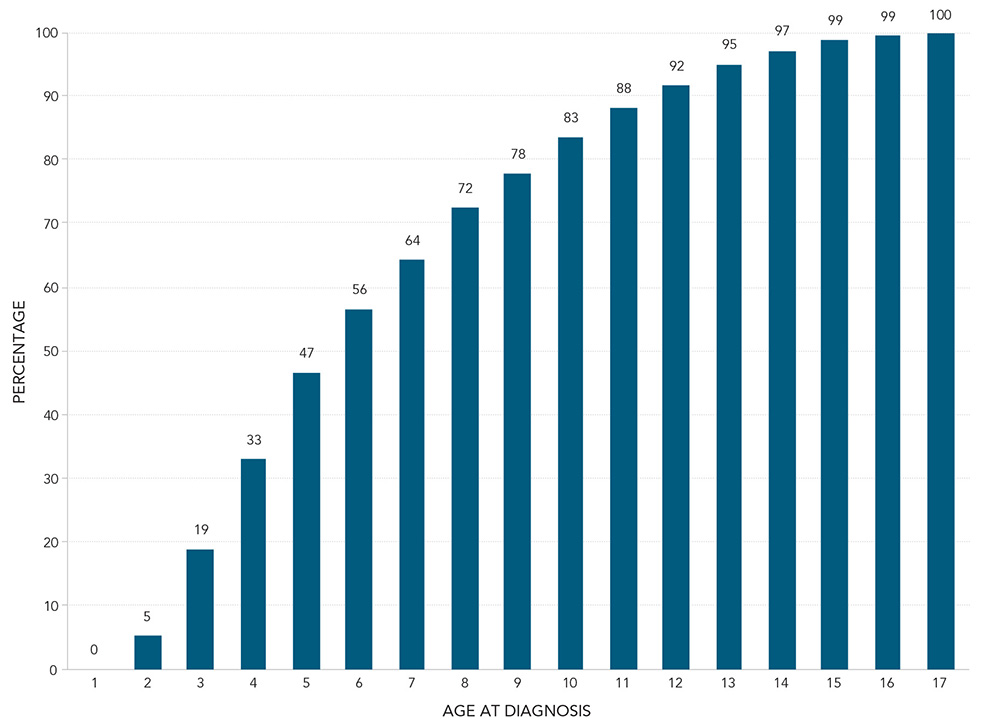
Figure 7 - Text description
Figure 7 presents the cumulative percentage of age at diagnosis for ASD of 5 to 17 year olds. By six years of age, over half have received a diagnosis and more than three quarters by 9 years of age. Less than 10% were diagnosed after 12 years of age. This figure is based on 2015 data from Prince Edward Island, Nova Scotia, Newfoundland and Labrador, and the Yukon. The Figure 7 table contains each of the data points represented in Figure 7.
| Age at Diagnosis (years) | Cumulative % |
|---|---|
| 1 | 0 |
| 2 | 5 |
| 3 | 19 |
| 4 | 33 |
| 5 | 47 |
| 6 | 56 |
| 7 | 64 |
| 8 | 72 |
| 9 | 78 |
| 10 | 83 |
| 11 | 88 |
| 12 | 92 |
| 13 | 95 |
| 14 | 97 |
| 15 | 99 |
| 16 | 99 |
| 17 | 100 |
- Figure 7 note *
-
Includes data from Prince Edward Island, Nova Scotia, Newfoundland and Labrador and the Yukon.
How do results vary by province and territory?
The overall combined prevalence estimate was 15.2 per 1,000 in 2015 (Figure 8). Prevalence estimates ranged from 8.0 to 17.5 per 1,000 (or a range of 0.8 to 1.8 percent).
Figure 8 - ASD prevalence per 1,000 by province, territory and overall, 2015
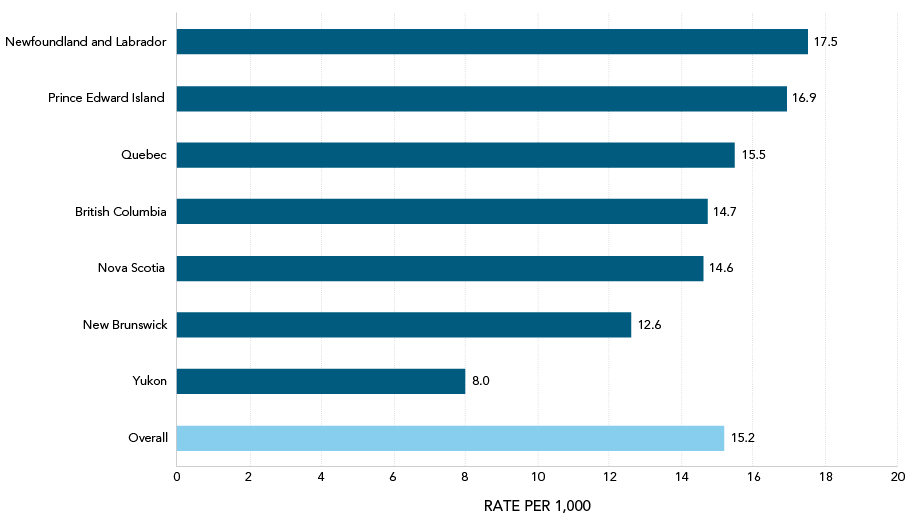
Note: Overall prevalence includes the six participating provinces and one territory.
Figure 8 - Text description
Figure 8 presents horizontal bars to represent ASD prevalence per 1,000 by province, territory, and overall. Prevalence ranges from 8.0 per 1,000 in the Yukon to 17.5 per 1,000 in Newfoundland and Labrador. The overall prevalence is 15.2 per 1,000 which includes data from six participating provinces and territory. The Figure 8 table contains each of the data points represented in Figure 8.
| Province / Territory | Prevalence |
|---|---|
| Yukon | 8.0 |
| New Brunswick | 12.6 |
| Nova Scotia | 14.6 |
| British Columbia | 14.7 |
| Overall | 15.2 |
| Quebec | 15.5 |
| Prince Edward Island | 16.9 |
| Newfoundland & Labrador | 17.5 |
There are a number of factors that may influence prevalence estimates and variances between regions. For instance, PTs with surveillance systems that rely on multiple data sources (i.e., Prince Edward Island); those with long standing programs and systems (i.e., Prince Edward Island and Newfoundland and Labrador); or those that employ active case ascertainment methods (i.e., Prince Edward Island and Newfoundland and Labrador) may report relatively higher prevalence estimates than other PTs.
As seen in Table 1, the provinces with large populations contributed a larger number of ASD cases to NASS. These larger PTs will thereby significantly influence the overall national prevalence estimates. In particular, British Columbia and Quebec have much larger populations than the Atlantic Provinces and the Yukon. British Columbia and Quebec made up 89 percent of the population submitting data to NASS and these two PTs contributed 90 percent of the ASD cases reported in 2015. It should be noted that the larger population provinces will always influence the overall prevalence estimates much more than the smaller PTs.
| Province / Territory | Population total of 5-17 year olds | ASD cases total | Overall Prevalence per 1,000 | Ratio | Male Prevalence per 1,000 | Female Prevalence per 1,000 | Female to Male Prevalence Ratio |
|---|---|---|---|---|---|---|---|
| Total | 1,916,588 | 29,099 | 15.2 | 1:66 | 23.9 | 6.0 | 1:4 |
| Newfoundland & Labrador | 66,769 | 1,167 | 17.5 | 1:57 | 28.8 | 5.6 | 1:5 |
| Nova Scotia | 47,670 | 697 | 14.6 | 1:68 | 23.2 | 5.7 | 1:4 |
| Prince Edward Island | 19,666 | 332 | 16.9 | 1:59 | 28.7 | 5.4 | 1:5 |
| New Brunswick | 62,378Table 1 note * | 789 | 12.6 | 1:79 | 19.1 | 5.9 | 1:3 |
| Quebec | 1,094,262 | 16,987 | 15.5 | 1:64 | 24.1 | 6.5 | 1:4 |
| British Columbia | 616,100 | 9,082 | 14.7 | 1:68 | 23.6 | 5.3 | 1:5 |
| Yukon | 4,772 | 38 | 8.0 | 1:126 | 12.8 | 2.6 | 1:5 |
|
|||||||
How do results compare with earlier years?
The geographic regions able to provide retrospective (historical) data were Newfoundland and Labrador, Prince Edward Island and Quebec.
Data from Quebec were obtained from the Système intégré de surveillance des maladies chroniques du Québec (SISMACQ), which collected data from the year 2000 onward.Footnote 7 Data from Newfoundland and Labrador and Prince Edward Island were collected as part of the NEDSAC surveillance program.Footnote 8
Newfoundland and Labrador and Prince Edward Island could only provide data on 5–14 year olds. Further, retrospective data received from Newfoundland and Labrador are limited to the period of 2003–2009.
Through NEDSAC, Prince Edward Island collected data from 2003–2010. From 2011–2015 Prince Edward Island continued collecting ASD data using similar methods established with NEDSAC. In 2015, Prince Edward Island officially launched the PASS system (i.e., the Prince Edward Island Autism Surveillance System), with the intention to report to NASS and to provide information to the province.
These data reflect the years 2003 to 2015, among those aged 5–14 years. The ASD prevalence has increased from 6.0 per 1,000 to 19.6 per 1,000 in Newfoundland and Labrador; from 5.0 per 1,000 to 17.7 per 1,000 in Prince Edward Island; and from 3.5 per 1,000 to 15.7 per 1,000 in Quebec. These data are illustrated in Figure 9. Data from Newfoundland and Labrador were unavailable from 2010-2014.
Figure 9 - ASD prevalence per 1,000 in Quebec, Newfoundland and Labrador, and Prince Edward Island from 2003–2015 among 5–14 year olds
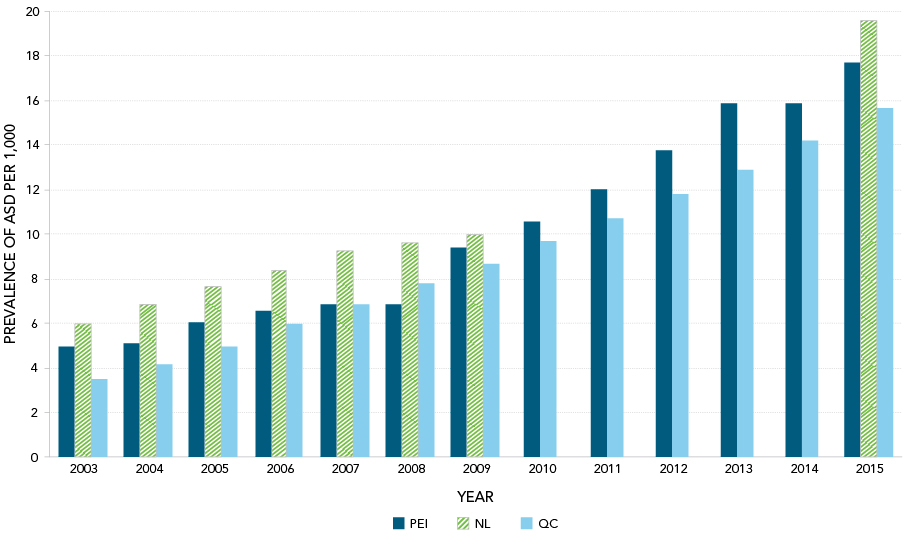
Note: Prince Edward Island and Newfoundland and Labrador collected ASD data as part of the NEDSAC program. Prince Edward Island continued and Newfoundland and Labrador stopped in 2010. The 2015 data represent data from NASS for ages 5-14 years. This age group is used because it was the age group for which historical data from NEDSAC was collected and reported.
Figure 9 - Text description
This figure presents ASD prevalence over time, between 2003 and 2015, for the three provinces where the data was available: PEI, Quebec, and Newfoundland & Labrador. In all three locations, prevalence consistently increased over time and for almost every year, prevalence is higher in Newfoundland & Labrador than Prince Edward Island which is higher than Quebec. Data was not available for Newfoundland & Labrador between 2010 and 2014, however the rate in 2015 follows the pattern of what would be expected in relation to the other two locations and based on the pattern from earlier years. Prince Edward Island and Newfoundland and Labrador collected ASD data as part of the NEDSAC program. Prince Edward Island continued and Newfoundland and Labrador stopped in 2010. The 2015 data represent data from NASS for ages 5-14 years. This age group is used because it was the age group for which historical data from NEDSAC was collected and reported. The Figure 9 table contains each of the data points represented in Figure 9.
| Year | PEI | NL | QC |
|---|---|---|---|
| 2003 | 5 | 6 | 3.5 |
| 2004 | 5.1 | 6.9 | 4.2 |
| 2005 | 6.1 | 7.7 | 5 |
| 2006 | 6.6 | 8.4 | 6 |
| 2007 | 6.9 | 9.3 | 6.9 |
| 2008 | 6.9 | 9.6 | 7.8 |
| 2009 | 9.4 | 10 | 8.7 |
| 2010 | 10.6 | not available | 9.7 |
| 2011 | 12.0 | not available | 10.7 |
| 2012 | 13.8 | not available | 11.8 |
| 2013 | 15.9 | not available | 12.9 |
| 2014 | 15.9 | not available | 14.2 |
| 2015 | 17.7 | 19.6 | 15.7 |
What rates of incidence were reported for 2015?
Only Quebec was able to provide 2015 incidence data to NASS. Quebec uses health services data and was able to capture all newly diagnosed cases from 0 to 18 years of age. This allowed for incidence rates to be calculated. These results are later reported as part of individual provincial and territorial results.
As education databases estimate those attending school, most education databases cannot provide an accurate estimate of incidence. It is anticipated that incidence data from other regions will be collected as NASS expands to include additional PTs.
How do NASS results compare with results from the United States?
Initiated in 2000, the Autism and Developmental Disabilities Monitoring (ADDM) Network is an active surveillance system that provides estimates of the prevalence and characteristics of ASD among children aged 8 years in multiple communities across the United States.
In 2012, records from multiple sources were screened and abstracted from 11 different Network sites (Arkansas, Arizona, Colorado, Georgia, Maryland, Missouri, New Jersey, North Carolina, South Carolina, Utah and Wisconsin). Records were then reviewed by trained clinicians to determine if a child had ASD. This is referred to as a records-review method. Such reviews do not rely exclusively on a child having an ASD diagnosis, but also includes review of records for children with documented behaviours that are consistent with ASD.Footnote 9
Several key differences should be noted in comparing data reported by the ADDM Network and NASS, as follows:
- Data captured in the ADDM Network are limited and represent an estimated 8.5% of 8 year olds in the United States. Surveillance sites were determined through a competitive process and were not selected to be representative of children aged 8 years nationally or in the states where the surveillance site was located.
- Approximately 18% of cases identified in the ADDM Network have no formal ASD diagnosis and have been identified as an ASD case based on chart reviews using recorded symptoms as the source of diagnosis when no diagnosis is found on file.
- The NASS collects information on 5-17 year olds and the population reported on is representative of this respective age range.
- The NASS only includes ASD cases with a confirmed diagnosis.
- Lastly, most recent data reported by the ADDM Network were collected in 2012; while with the NASS, data reported were collected in 2015.
Despite the differences in methodology, the results from these two surveillance systems are quite similar. In comparing the prevalence of ASD among 8 year olds in Canada versus 8 year olds in the United States (Table 2), NASS reports a rate of 1 in 63 (2015), whereas most recent estimates from the ADDM Network report a prevalence of 1 in 68 (2012).Footnote 9
| NASS | ADDM Network | |
|---|---|---|
| Year of Data Collection | 2015 | 2012 |
| Ages | 5-17 year olds | 8 year olds |
| Prevalence | 1:66 (5-17 year olds)
1:63 (8 year olds) |
1:68 (8 year olds) |
In the United States, in 2012, 8 year old males were 4.5 times more commonly identified with ASD than 8 year old females. In comparison, in Canada, in 2015, 8 year old males are diagnosed 4.1 times more frequently than 8 year old females.
Differences in prevalence rates between Canada and the United States may be due to the data being reported from different years and to different data collection methods. Differences between dates and methods (e.g., age(s) of population under surveillance) should be considered when comparing the prevalence of ASD between any jurisdictions.Footnote 9
Provincial and Territorial Results
In 2015, six provinces and one territory submitted data to NASS (see Technical Annex Table 3). The participating provinces and territory are: Newfoundland and Labrador, Nova Scotia, New Brunswick, Prince Edward Island, Quebec, British Columbia, and the Yukon.
Newfoundland and Labrador
The Department of Education and Early Childhood Development’s Education Services Database contains information for all students 5–21 years old, attending public schools in the province’s two school districts. The Department, through the school districts, offers services to students with a letter of diagnosis from a qualified health professional. The Evaluation and Research Division collects individual-level data from schools specific to special education services through the Educational Service Database. In Newfoundland and Labrador, the data reported represent 97.1 percent of the population based on 2015 census population estimates for 5–17 year olds.
What was the ASD prevalence in Newfoundland and Labrador in 2015?
The 2015 overall prevalence of ASD in Newfoundland and Labrador was 17.5 per 1,000 (1 in every 57 or 1.8 percent) of 5–17 year olds.
What was the mode or most frequent age of diagnosis?
The mode or most frequent age of diagnosis was 4 years old.
What was the prevalence by sex?
In Newfoundland and Labrador, the prevalence of ASD in males was 28.8 per 1,000 males (1 in every 35 or 2.9 percent). The prevalence of ASD in females was 5.6 per 1,000 females (1 in every 179 or 0.6 percent). For every female with ASD, there were five males with ASD.
Nova Scotia
In Nova Scotia, the Department of Education and Early Childhood Development uses the Technology for Improving Education Network (TIENET) to collect data on students receiving support services. All students requiring additional programming and support outside the regular classroom are entered into TIENET, including those with ASD. The diagnosis of ASD is entered into TIENET when supported by a letter of diagnosis from a health care professional. The data collected in 2015 are from six of the eight school boards in Nova Scotia. In Nova Scotia the data in TIENET represent 39.7 percent of the population based on 2015 census estimates for 5–17 year olds.
What was the ASD prevalence in Nova Scotia in 2015?
The 2015 overall prevalence of ASD in Nova Scotia was 14.6 per 1,000 (1 in every 68 or 1.5 percent) of 5–17 year olds.
What was the mode or most frequent age of diagnosis?
The mode or most frequent age of diagnosis was 5 years old.
What was the prevalence by sex?
In Nova Scotia, the prevalence of ASD in males was 23.2 per 1,000 males (1 in every 43 or 2.3 percent). The prevalence of ASD in females was 5.7 per 1,000 females (1 in every 175 or 0.6 percent). For every one female with ASD, there were four males with ASD.
Prince Edward Island
In Prince Edward Island, diagnostic records of all individuals with ASD are referred to the Department of Education, Early Learning and Culture by either families, public or private diagnosticians, public or private service providers or schools. All cases are registered with PASS. Data from PASS represent 93.1 percent of the population of 5–17 year olds in Prince Edward Island based on 2015 census population estimates.
What was the ASD prevalence in Prince Edward Island in 2015?
The 2015 overall prevalence of ASD in Prince Edward Island was 16.9 per 1,000 (1 in every 59 or 1.7 percent) 5–17 year olds.
What was the mode or most frequent age of diagnosis?
The mode or most frequent age of diagnosis was 3 years old.
What was the prevalence by sex?
ASD prevalence in males was 28.7 per 1,000 males (1 in every 35 males or 2.9 percent). ASD prevalence in females was 5.4 per 1,000 females (1 in every 186 or 0.5 percent). For every one female with ASD, there were five males with ASD.
New Brunswick
In New Brunswick, the Department of Education and Early Childhood Development is divided into Anglophone and Francophone sectors, each with their own mechanisms for collecting information on their respective school populations and are responsible for education from Kindergarten to grade 12.
In New Brunswick the Anglophone sector represents 68.0 percent of the total population of 6–17 year olds, based on 2015 census population estimates for this age group.
What was the ASD prevalence in New Brunswick in 2015?
The 2015 overall prevalence of ASD in New Brunswick was 12.6 per 1,000 (1 in 79 or 1.3 percent) of the population of 6-17 year olds in New Brunswick Anglophone schools. The data source did not collect date of diagnosis and therefore the most frequent age of diagnosis is undetermined.
What was the prevalence by sex?
Among Anglophone students, ASD prevalence in males was 19.1 per 1,000 males (1 in every 52 or 1.9 percent) 6–17 year olds. For females, the estimated prevalence of ASD was 5.9 per 1,000 females (1 in every 170 or 0.6 percent) 6–17 year olds. For every one female with ASD, there were three males with ASD.
Quebec
In Quebec, Institut national de santé publique du Québec (INSPQ) ASD case data are identified by matching administrative files from the Régie de l'assurance maladie du Québec (RAMQ) and the Ministère de la Santé et des Services sociaux (MSSS), as part of the Système intégré de surveillance des maladies chroniques du Québec (SISMACQ). SISMACQ contains information from the RAMQ file on physicians' fee-for-service claims, which includes data on all medical acts billed to the RAMQ; and registration files for persons with provincial health insurance le Fichier d'inscription des personnes assures.
In Quebec, these data represent 100 percent of 5–17 year olds based on 2015 census population estimates.
What was the ASD prevalence in Quebec in 2015?
The 2015 overall prevalence of ASD in Quebec was 15.5 per 1,000 (1 in 64 or 1.6 percent) of 5–17 year olds.
What was the prevalence by sex?
In Quebec, the prevalence of ASD in males was 24.1 per 1,000 males (1 in every 41 or 2.4 percent). The estimated prevalence of ASD in females was 6.5 per 1,000 females (1 in every 153 or 0.7 percent). For every one female with ASD, there were four males with ASD.
What was the 2015 ASD incidence rate in Quebec?
The overall incidence rate increased from 3.9 per 10,000 in the year 2000 to 19.1 per 10,000 in 2015. These trends are illustrated in Figure 10. Incidence rates reflect only newly diagnosed ASD cases within a specific year.
What was the incidence rate by sex?
For males in 2015, the overall incidence rate was 29.1 per 10,000. This went from 5.9 in the year 2000 to 29.1 in 2015. For females in 2015, the overall incidence rate was 8.8 per 10,000. This went from 1.4 in the year 2000 to 8.8 in 2015.
Figure 10 - ASD incidence rate per 10,000 by sex in Quebec, 2000-2015
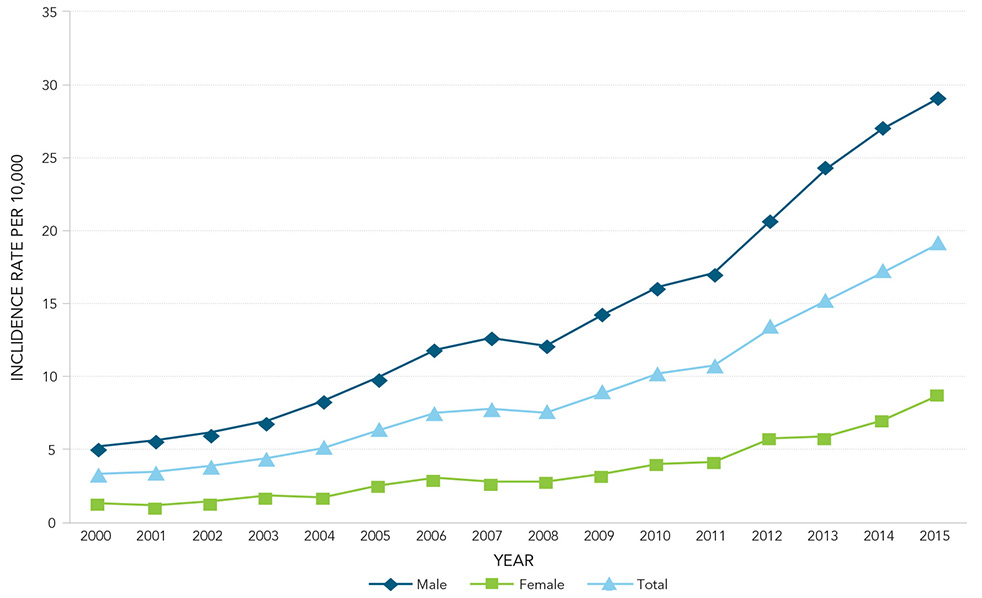
Figure 10 - Text description
This figure presents line charts of incidence rate per 10,000 in Quebec by sex over time. Between 2000 and 2015, incidence rates have increased for both sexes and males were consistently higher. In 2000, the difference was 1.4 for females to 5.2 for males. Over time, the rate increased consistently until 2015 where the difference was 8.8 for females and 29.1 for males. The Figure 10 table contains each of the data points represented in Figure 10.
| Year | Female | Male | Total |
|---|---|---|---|
| 2000 | 1.4 | 5.2 | 3.4 |
| 2001 | 1.2 | 5.7 | 3.5 |
| 2002 | 1.4 | 6.2 | 3.8 |
| 2003 | 1.8 | 7.0 | 4.4 |
| 2004 | 1.8 | 8.4 | 5.1 |
| 2005 | 2.6 | 10.0 | 6.3 |
| 2006 | 3.0 | 11.9 | 7.5 |
| 2007 | 2.8 | 12.7 | 7.8 |
| 2008 | 2.9 | 12.2 | 7.6 |
| 2009 | 3.4 | 14.3 | 8.9 |
| 2010 | 4.1 | 16.2 | 10.2 |
| 2011 | 4.2 | 17.1 | 10.7 |
| 2012 | 5.8 | 20.8 | 13.4 |
| 2013 | 5.9 | 24.3 | 15.2 |
| 2014 | 7.1 | 27.0 | 17.2 |
| 2015 | 8.8 | 29.1 | 19.1 |
As noted in Figure 11 the incidence rate of ASD is increasing for all age groups. The age group with the greatest increases in incidence rates are with 1–4 year olds, followed by the 5–9 years old age group. Those whose age group is greater than 10 years old continue to increase, although not as dramatically as the younger age groups over time.
Figure 11 - ASD incidence rate by year and age group per 10,000 in Quebec, 2000-2015
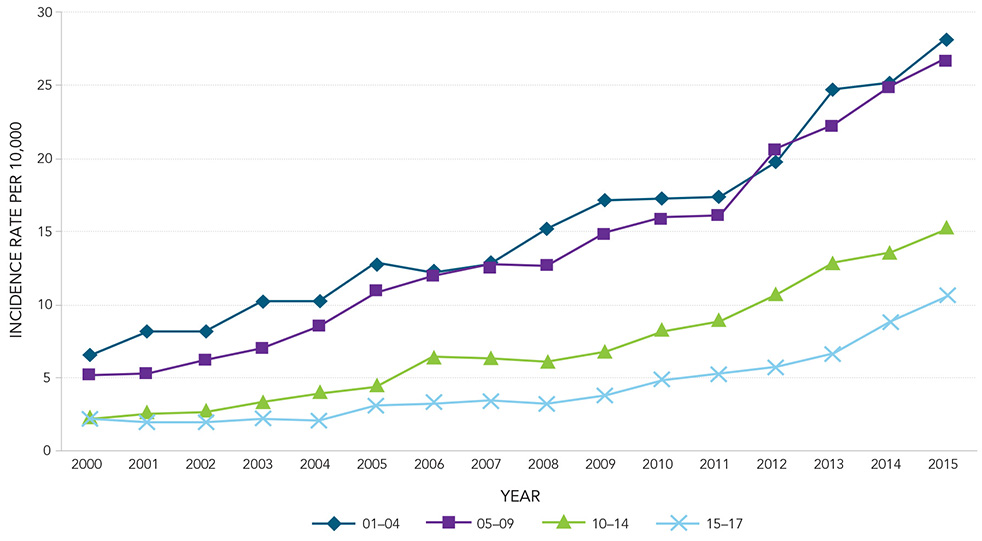
Figure 11 - Text description
This figure presents line charts of incidence rate per 10,000 in Quebec for four age groups over time. Between 2000 and 2015, incidence rates have increased for each of the age groups. The incidence rates were highest for the youngest age group (01 to 4 years of age) and with each subsequent age group, rates were lower respectively. There was also a gap between the younger two age groups and the older two. These trends continued over time. The Figure 11 table contains each of the data points represented in Figure 11.
| Year | Age Groups (years) | |||
|---|---|---|---|---|
| 01-04 | 05-09 | 10-14 | 15-17 | |
| 2000 | 6.5 | 5.2 | 2.2 | 2.2 |
| 2001 | 8.1 | 5.4 | 2.6 | 1.9 |
| 2002 | 8.2 | 6.3 | 2.7 | 1.9 |
| 2003 | 10.3 | 7.1 | 3.3 | 2.3 |
| 2004 | 10.2 | 8.5 | 4.0 | 2.0 |
| 2005 | 12.9 | 10.9 | 4.4 | 3.2 |
| 2006 | 12.2 | 12.0 | 6.5 | 3.3 |
| 2007 | 12.8 | 12.8 | 6.4 | 3.5 |
| 2008 | 15.2 | 12.6 | 6.1 | 3.2 |
| 2009 | 17.1 | 15.0 | 6.8 | 3.8 |
| 2010 | 17.3 | 16.0 | 8.2 | 4.9 |
| 2011 | 17.4 | 16.2 | 8.9 | 5.4 |
| 2012 | 19.9 | 20.7 | 10.7 | 5.8 |
| 2013 | 24.8 | 22.3 | 12.9 | 6.7 |
| 2014 | 25.3 | 24.9 | 13.6 | 8.8 |
| 2015 | 28.3 | 26.9 | 15.2 | 10.7 |
Figure 12 - Percentage of ASD cases diagnosed by age group and year, Quebec, 2000-2015
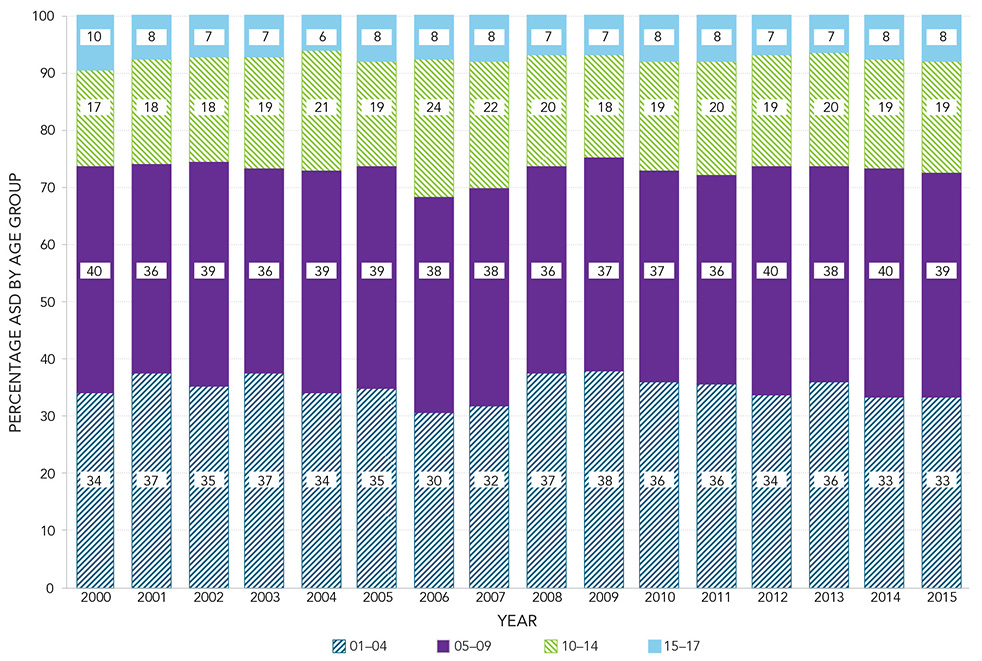
Figure 12 - Text description
This figure visualizes the proportion of cases diagnosed in each age group by year. It includes the incidence rate per 10,000 in Quebec for four age groups between 2000 and 2015. The proportion of incidence rates has remained fairly consistent over time. Approximately three quarters of all cases are diagnosed in the two younger age groups, 01 to 04 years and 05 to 09 years. The Figure 12 table contains each of the data points represented in Figure 12.
| Year | Age Groups (years) | |||
|---|---|---|---|---|
| 01-04 | 05-09 | 10-14 | 15-17 | |
| 2000 | 34.0 | 39.6 | 16.7 | 9.7 |
| 2001 | 37.5 | 36.4 | 18.3 | 7.8 |
| 2002 | 35.3 | 39.0 | 18.5 | 7.3 |
| 2003 | 37.3 | 36.0 | 19.5 | 7.2 |
| 2004 | 34.1 | 38.6 | 21.1 | 6.2 |
| 2005 | 34.8 | 38.6 | 18.5 | 8.1 |
| 2006 | 30.4 | 37.7 | 24.1 | 7.8 |
| 2007 | 31.8 | 38.0 | 22.1 | 8.1 |
| 2008 | 37.4 | 36.2 | 19.5 | 7.0 |
| 2009 | 37.9 | 37.0 | 18.2 | 6.9 |
| 2010 | 36.0 | 36.6 | 19.4 | 7.9 |
| 2011 | 35.6 | 36.4 | 19.9 | 8.1 |
| 2012 | 33.8 | 39.7 | 19.5 | 7.0 |
| 2013 | 35.8 | 37.7 | 19.8 | 6.7 |
| 2014 | 33.3 | 39.9 | 19.1 | 7.7 |
| 2015 | 33.2 | 39.3 | 19.4 | 8.1 |
Quebec data provided information on number of cases diagnosed in each age group by year (Figure 12). The proportion of new diagnoses across age groups remains fairly consistent over time. The majority of newly diagnosed cases predominantly occur in those less than 10 years old. Approximately three quarters of all cases are diagnosed by the age of 10.
British Columbia
In British Columbia, a province-wide system called Integrated Case Management captures and integrates data, including elements required for ASD surveillance. In British Columbia the data represent 99.4 percent of the population based on 2015 census population estimates for ages 5–17 years old.
What was the ASD prevalence in British Columbia in 2015?
In 2015, overall prevalence of ASD in British Columbia was 14.7 per 1,000 (1 in 68 or 1.5 percent) of 5–17 year olds.
What was the prevalence by sex?
In British Columbia the prevalence of ASD in males was 23.6 per 1,000 males (1 in 42 or 2.4 percent). The prevalence of ASD in females was 5.3 per 1,000 females (1 in 188 or 0.5 percent). For every one female with ASD, there were five males with ASD.
Yukon
The Yukon Department of Education gathers data on students with ASD through the Yukon Student Information System. All cases that have a letter of diagnosis from a health care professional stating the student meets DSM criteria for ASD are included in the Yukon data. The data represent 91.1 percent of the population based on 2015 census population estimates for 5–17 year olds.
What was the ASD prevalence in the Yukon in 2015?
The 2015 overall prevalence of ASD in the Yukon was 8.0 per 1,000 (1 in 126 or 0.8 percent) of the population.
What was the mode or most frequent age of diagnosis?
The mode or most frequent age of diagnosis was 5 years old.
What was the prevalence by sex?
In the Yukon the prevalence of ASD in males was 12.8 per 1,000 males (1 in 78 or 1.3 percent). The prevalence of ASD in females was 2.6 per 1,000 females (1 in every 379 or 0.3 percent). For every 1 female with ASD, there were 5 males with ASD.
Future Directions
ASD can have significant health, social, emotional, and financial impacts on individuals, their families, and their caregivers. Many Canadians living with ASD need appropriate supports to reach their full potential, while family and caregiver quality of life can also be improved if timely and appropriate support services are offered throughout the lifespan.
Surveillance data can help illustrate the picture of ASD in Canada, in addition to informing policies and programs aimed at improving the lives of those impacted by ASD. These findings offer a first glimpse of ASD in Canada based on data from NASS. The 2015 data are beginning to provide answers, but are also creating new questions that may be answered by NASS over time.
Beyond this important milestone of publishing the inaugural NASS 2018 Report, PHAC will continue to release NASS findings using diverse approaches, including data blogs, data tables, infographics and web updates to meet the need of diverse audiences.
More broadly, future directions for NASS will centre on:
- Working towards full program implementation of NASS in having each PT join as feasibility and validation work is completed in their respective jurisdictions;
- Supporting PT surveillance capacity and infrastructure development;
- Capitalizing on opportunities to enhance NASS through exploring the potential to include additional data elements and indicators, e.g., incidence beyond Quebec, ethnicity, and other comorbidities; and,
- Examining the possibility of expanding surveillance to other ASD populations, e.g., children less than 5 years of age; and adult populations.
The development work required to build NASS was significant, and the collaborative effort of all who played a role in its achievements is gratefully recognized. The data in this report are made possible only through the ongoing participation of PT partners and advice given by the ASD-AC.
The new evidence generated by NASS, combined with the ongoing work by health professionals, researchers and non-government organizations across Canada, will support governments and other stakeholders in their work to improving the quality of life for those living with ASD.
Technical Annex: NASS Surveillance Methods
1. Introduction
The purpose of the Technical Annex for NASS Surveillance Methods is to provide further details on the methods used to collect ASD data for the NASS. With all surveillance systems, the case definitions, data sources, comprehensiveness of these data and privacy protocols are essential for effective and efficient ongoing surveillance initiatives.
2. NASS Participating Provinces and Territory
Collection of PT data was initiated in 2015. As of 2017, seven PTs have contributed 2015 data to NASS, they are: Prince Edward Island, New Brunswick, Newfoundland and Labrador, Nova Scotia, Quebec, British Columbia and the Yukon. Retrospective data have also been collected from Newfoundland and Labrador (2003–2009), Prince Edward Island (2003–2015), and Quebec (2000–2015); which support analysis of trends over time within these regions. As full implementation is a phased process the remaining PTs will be brought into NASS as their data are assessed, and feasibility and validation projects are completed.
The population coverage varies amongst participating PTs. Nova Scotia’s data for 2015, included 40 percent of the population under surveillance as two of the largest school boards did not participate. In New Brunswick, 68 percent of the population 6–17 year olds is represented in NASS since presently only those who attend the Anglophone schools are included. The remaining PTs have representation of between 91 and 100 percent of the total school-aged population reflected in their 2015 NASS reporting.
Corresponding data for all participating PTs are given in Table 3: Provincial and territorial comparisons by prevalence, population representativeness, data sectors and data sources.
| Geographic Location | ASD Prevalence per 1000 | ASD Ratio 1 in X | Population and Percent under surveillance (ages 5–17) | Data Sector(s) | Data Source Name |
|---|---|---|---|---|---|
| Total NASS | 15.2 | 1:66 | 40% of the total population of 5–17 year olds in Canada | Education, social services and health | Varied |
| Newfoundland & Labrador | 17.5 | 1:57 |
|
Education | Educational Service Database |
| Nova Scotia | 14.6 | 1:68 |
|
Education | Technology for Improving Education Network (TIENET), Student Information System |
| Prince Edward Island | 16.9 | 1:59 |
|
Education, health and social services | PEI Autism Surveillance System (PASS) |
| New Brunswick | 12.6 | 1:79 |
|
Education | Student Education Program database |
| Quebec | 15.5 | 1:64 | 100% of the population receiving health services | Health and social services | Système intégré de surveillance des maladies chroniques du Québec (SISMACQ) |
| British Columbia | 14.7 | 1:68 |
|
Social services | Integrated Case Management system |
| Yukon | 8.0 | 1:126 |
|
Education | Student Information System |
3. Identification and Assessment of Data Sources and Data
Environmental Scans
All potential ASD data holders within each PT were identified and extensive interviews were conducted to determine the criteria for ASD cases (i.e., case definition), the comprehensiveness of the data (who was counted, who was not counted) and data elements collected, within the identified data source. At the end of the interviews, the interviewees were asked to identify other potential “data sources” in their jurisdictions. This snowball approach for identifying other sources of ASD data was lucrative in identifying sources that may not have otherwise been considered.
The environmental scans were conducted in all PTs with the exception of Quebec who notified NASS of the best data source at the current time in their province. Once the “best” data source was identified either a feasibility project, validation study or the collection of data harmonization templates followed.
Through these consultations with PTs, PHAC identified the various administrative sources of data available from PTs for ASD surveillance, and explored the feasibility of integrating these data into the national ASD surveillance system.
The environmental scan reviewed ASD-specific data from four key areas:
- Health: ASD health data across the country can be collected through PT Departments/Ministries of Health (such as through physician billing, hospital admission/discharges), Regional Health Authorities, and specialized health care centres/hospitals.
- Education: Education databases capture information on students who attend publically funded education programs and in some provinces it captures homeschooled individuals as well. In addition to special education services, this information may include ASD diagnostic information and psychoeducational assessments.
- Social Services: Social Service databases capture data on individuals who are registered and receiving services, often from government-funded programs, and/or those receiving financial contributions through programs funded by PTs for services for their condition or to support their employment.
- Research Teams: Some universities across Canada lead research projects that involve the linking of administrative data sets from different sectors. These teams have collected extensive information on individuals with ASD in selected geographic areas.
Data from potential administrative data sources, which met minimal criteria, were considered as a potential data source for NASS. Additional criteria assessed included: simplicity, flexibility, data quality, acceptability, sensitivity, predictive value positive, representativeness, timeliness, and stability. Each potential data source was further evaluated using data harmonization templates which attempted to measure and quantify each of these parameters.
Feasibility and Validation Projects
Once potential data sources had been identified, selected PTs were approached to do additional work to determine the feasibility of their data as a source for surveillance. Please note that projects did not occur in place of the pre-data collection review. Projects were completed in:
- Nova Scotia: a feasibility project to determine the validity of data entered into the provincial Department of Education diagnostic module (including case definition validation, which provided the diagnosis, prevalence analysis, and a comparison of prevalence estimates to known expected prevalence estimates).
- Newfoundland and Labrador: a date of diagnosis project was completed to ensure the dates were included in the present system.
- Quebec: a thorough review of the SISMACQ program as a source of data for NASS was completed. Additional work looking at other variables available including socioeconomic status, comorbid conditions and other variables were included.
- Ontario: a feasibility project was done with the Ministry of Education to review aggregate estimates of numbers of cases of ASD by school board and by rural vs. urban schools, to determine if this source could be used for surveillance.
- Manitoba: an intensive validation study to determine best algorithms for identification of cases was completed. This validation work determined the best algorithms to be used in Manitoba in contributing data to NASS.
- Saskatchewan: a feasibility project looking at the use of education data was completed. Additional work is needed to determine if education ASD prevalence data could be used in NASS.
- Nunavut: a feasibility project looking at the best algorithms using several administrative data sources was completed.
4. Case Ascertainment
Case Definitions
In consultation with experts, NASS case definition was developed with the aim of being practical and robust enough for the purposes of making standardized comparisons across Canada while also providing the most accurate estimate possible of Canadian children and youth that have been diagnosed with ASD. NASS case definition takes into account the diversity in clinical practice and service delivery across and within PTs. All cases reported in NASS must meet criteria given in NASS case definition.
The criteria for the case definition serve as a public health surveillance case definition for individuals diagnosed with ASD in Canada.
Table 4 - NASS ASD Case Definition
Both criteria must be met:
- The diagnosis of ASD is provided or confirmed by a licensedNote a health care professional(s)Note b
- The diagnosis of ASD is based on the clinical criteria in the Diagnostic and Statistical Manual (DSM)Note c for Mental Disorders or the case is identified as ASD in the International Classification for Diseases (ICD)Note d.
As part of the validation process within the feasibility, validation or data harmonization templates, the case definition for each data source was validated against these criteria.
DSM/ICD Criteria
- Education: for education sources all ASD diagnoses must come from a licensed health care provider. A letter of diagnosis is provided to the schools as proof of diagnosis. Letter of diagnosis may or may not state that the case met “DSM criteria”, however if a licensed health care provider provided the diagnosis then it was assumed that this criterium was used.
- Health Services: for Quebec, health services data were used for NASS. These health service data were obtained by the matching of administrative files from:
- the Régie de l’assurance maladie du Québec (RAMQ) and the MSSS, which made up the Système intégré surveillance des maladies chroniques du Québec (SISMACQ) available at the INSPQ. SISMACQ contains information from RAMQ file on physicians’ fee-for-service claims, which includes data on all medical acts billed to the RAMQ;
- registration file for persons with provincial health insurance, which provides demographic data and information on health insurance eligibility periods. It contains date of birth and death, postal code and health insurance eligibility status for all individuals with a health insurance number valid for at least one day since the start of the SISMACQ reference period (April 1, 1996);
- Maintenance et exploitation des données pour l’étude de la clientèle hospitalière (MED-ÉCHO) hospitalizations file, which identifies primary and secondary diagnoses associated with hospital admissions;
- Registre des événements démographiques provides the death file.
- ICD-9 codes are used to codify diagnoses in the medical services file for the entire observation period from January 1, 1996, to March 31, 2014, as well as in the MED-ÉCHO file until March 31, 2006, while codes from the 10th revision (ICD-10) are used in the MED-ÉCHO file as of April 1, 2006.
- Social Services: social service data were used in British Columbia. Since 2007 these data have been collected by the Autism Funding Branch of the Ministry of Children and Family Development. Current data about the British Columbia autism funding program are captured in the province-wide Integrated Case Management system. The aggregated data in this system are data which were submitted to NASS.
Data Elements
As it was recognized that the best data sources were different between PTs, the data elements collected were categorized into three groups (Figure 13). The first group contains the mandatory or “core minimal” data elements and these are the bare minimal data elements for a data source. The entire core minimal data elements needed to be within a system before it would be considered viable to use in NASS. The data elements collected were categorized as follows:
- Core Data Set (Minimal): Provides the core health surveillance data elements describing person (year-month of birth; sex; ASD flag), place (PT; geographic locator; data source), and time (date of data extraction; prevalence year) for each ASD case.
- Core Data Set (Additional) (as available): Complements the minimal data set by providing added information to help understand a more comprehensive picture of ASD in Canada. Data elements include information on the: date of diagnosis (i.e., year-month); diagnostic criteria, tools (i.e. Autism Diagnostic Interview – Revised and Autism Diagnostic Observation Schedule), scores or classification; other assessment tools and scores (e.g. adaptive behaviour, developmental scores and intelligence testing); source of diagnosis; other conditions (e.g. epilepsy, anxiety disorders); country of birth; country of first diagnosis; ethnicity; other geographic locators; and, citizenship.
- Enhanced Data Set: Provides data elements that are generally obtained in highly focused and specialized data sources where even more information is collected than in a typical administrative setting (e.g. Early Intensive Behavioural Intervention services, school, hospital). For instance, this may include information about maternal health prior to birth, neonatal medical information, the kinds of supports and interventions that an individual with ASD and/or their family have received. These data would inform additional and informative data analysis, and targeted surveillance studies.
NASS Data Elements Dictionary provides a detailed description for each NASS data element and presents the coding guidelines for NASS data elements. This document is a comprehensive reference for both PHAC and its PT partners, facilitating clear communication and agreements, and the standardization of data across data sources.
Each PT is expected to provide, at a minimum, the core (mandatory) variables. Core (additional) variables are sought where available.
Figure 13 - NASS data elements
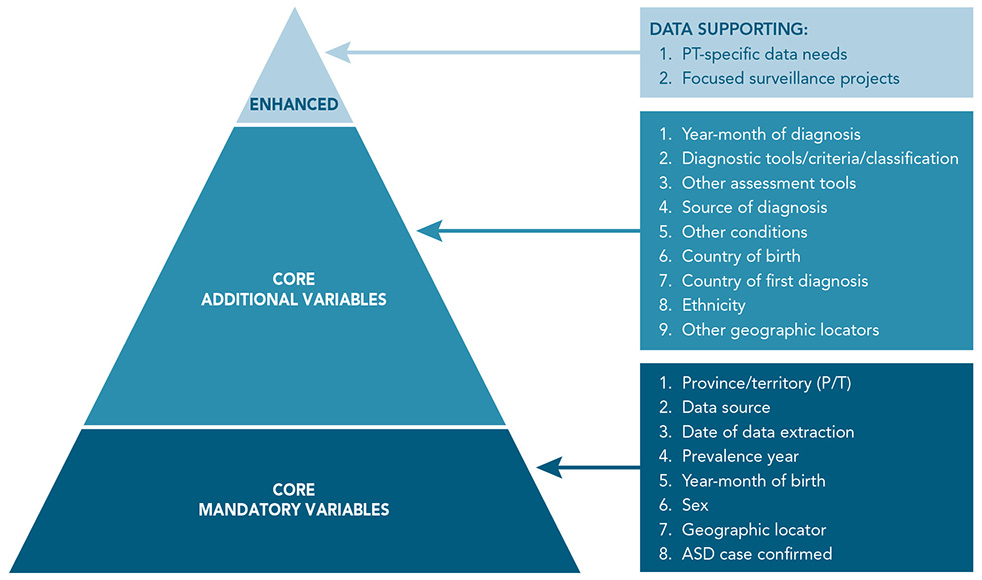
Figure 13 - Text description
Figure 13 presents the NASS data elements in a pyramid format which is split into three sections. The base contains the core, mandatory variables including: province/territory, data source, date of data extraction, prevalence year, year-month of birth, sex, geographic locator, and ASD case definition. The middle section of the pyramid contains the core additional variables including: year-month of diagnosis, diagnostic tools/criteria/classification, other assessment tools, source of diagnosis, other conditions, country of birth, country of first diagnosis, ethnicity, and other geographic locators. The upper section of the pyramid represents the enhanced elements including: data supporting PT specific data needs and/or focused surveillance projects.
Data Quality Review
All data prior to and after data transfer went through extensive reviews, as part of, or following the consolidation of jurisdiction level data. The steps in the review are:
- Data Harmonization Templates: As part of, or following the consolidation of jurisdiction level data, PT lead departments were strongly encouraged to use Data Harmonization Templates, established by PHAC, as a best practice to support surveillance data evaluation and data quality validation. This helped facilitate data quality documentation, monitoring and improvement. These templates were used to capture and communicate to PHAC crucial information, such as case identification pathways and act as an important means for ensuring the accuracy (e.g., consistency with NASS case definition), timeliness (e.g., data particular to the relevant surveillance reporting year) and completeness (e.g., capture of various data elements) with data collection before data are transferred to PHAC.
- Data Reviews: once data harmonization templates were received the data elements and aggregate data were reviewed. This included a review of the data elements, data format and determination of the comprehensiveness of reporting of that specific element. The aggregate data review included a review of the most recent data by age and sex. This review determined if data appeared to be outside of what would be expected for the age and sex reported.
- Data Quality Protocols: the data quality protocols were established for post-submission of data where comprehensiveness, missing variables and review of outliers was completed. These reviews were shared with the PTs and corrections and validation were provided.
- Missing Data: criteria for all data elements were established where if < 10% of a specific element was missing than it was still analyzed. If > 10% of a specific data element was missing a meeting was called to determine the utility of the data, after attempts to collect the missing data had already occurred.
Strengths and Limitations
Table 5 presents the strengths and limitation criteria for assessing public health surveillance systems applied to NASS.Footnote 10
| Criteria | Rating | Comments |
|---|---|---|
| Simplicity | High |
|
| Flexibility | Moderate | Data fields are already established however there is some flexibility in that change to what is being collected can be implemented. |
| Data quality | High | Established coding for ASD via ICD codes or educational codes. Very few missing fields. Validation projects were implemented in many of the participating PTs. Completeness of data element reporting was performed as part of the data quality review. All cases met the case definition and minimum criteria for data submission. |
| Acceptability | High | Data collection was seen as an important surveillance activity for all participating PTs. The purpose and goal of NASS reinforced the acceptability of both the system and its content. |
| Sensitivity | Moderate | The true sensitivity would be difficult to measure without a research study. However, most PTs services are contingent on diagnosis and therefore being identified and counted as a case is more likely to occur. While there will be some cases that are not identified in PT systems these numbers are believed to be minimal. |
| Predictive value positive | High | A strength of NASS lies in that each data source has the same strict case definition criteria. All cases must meet these criteria. A validation study of confirmation of cases was performed in Nova Scotia with a 99% accuracy in reporting of cases.NASS includes both the identification of ASD cases and those without ASD (e.g., with educational sector, data is based on all enrolled children). Patterns and trends remain stable over time, whether examining overall analyses or age/sex breakdowns. |
| Representativeness | High | Of the PTs contributing to NASS it has been established that they represent 88% of the populations within those PTs and 40% of the total population of children and youth ages 5–17 in Canada. |
| Timeliness | Moderate – High | Data are transferred annually. For educational data, the data are transferred during the summer when changes to the PT databases are minimal. This is valuable for the calculation of prevalence. |
| Stability | High | As the data sources have been established for other administrative purposes within each corresponding PT the stability of the systems is quite strong. |
| Overall | Moderate – High | Overall the strength of this system to estimate the prevalence of ASD is moderate to high. |
Limitations
NASS can only pick up ASD cases that have an official diagnosis entered into the data source. Undiagnosed cases, education sources where the diagnosis has not been shared with the school by the parents, and those missed entries in the system would not be captured. It is felt that these numbers would be minimal. For health data sources the limitation of case counts would include those who have been misdiagnosed and those whose coding has been entered incorrectly. Social service data are limited to cases that are obtaining services and therefore would not capture those who opt out of services or who have decided to pay privately for services.
The data collected within NASS is limited to the information available in the source records. As NASS evolves, there will be additional data elements with plans to include services and comorbid conditions. With the exception of Quebec, NASS estimates are primarily prevalence information and as such, no other PT at this point in time can provide incidence data.
Since denominators used are different between the education (school enrolment denominator) and health and social services (which use the census as denominator), the accuracy of the numbers will be better for the education data sources. When comparing prevalence estimates using as the denominator source school board enrolment or the census, the prevalence estimates decreased between 0.05 and 0.10 percent.
Privacy
ASD surveillance, like all surveillance, involves the electronic collection, use, and storage of health-related information on individuals. NASS undertakes comprehensive measures to ensure privacy of the individual’s data captured in the system is not breached.
The Office of the Privacy Commissioner of Canada oversees compliance with Canada’s Privacy Act, and government institutions must conduct Privacy Impact Assessments (PIA) for new or redesigned programs and services that raise privacy issues. PIAs are used to identify the potential privacy risks, and help eliminate or reduce those risks to an acceptable level. They also include information on how personal information is collected, used, disclosed, stored and ultimately destroyed. The NASS has completed a PIA to meet these requirements.
NASS collects data from participating PT partners based on pre-arranged data sharing agreements (i.e., a Memorandum of Agreement). These agreements are used to set out a clear blueprint of how a PT will participate in NASS and include provisions for data sharing governance. On an on-going annual basis, participating PT partners gather local/regional level data (e.g., individual records of cases) consistent with NASS ASD case definition, aligned with common data set, specification, and procedural standards, as identified in corresponding MOAs and various guidance materials, including PHAC’s Data Indicators Framework and Data Elements Dictionary. Ownership of collected data resides with individual PTs, while PHAC provides a stewardship role, reviews data quality, develops tools, and generates analytic reports.
NASS does not collect or require personal information concerning names, addresses or social insurance numbers of individuals. All data are de-identified by PT data providers prior to being transferred to PHAC; with the removal and/or truncation of any direct identifying variables (e.g., only partial dates of birth, dates of diagnosis and postal codes are collected).
Measures are undertaken when producing public reports to ensure that robust data suppression approaches are in place when dealing with geographic areas with small sizes to mitigate the risk of re-identification of individuals.
Analytic methods used for calculations of prevalence
Prevalence Denominators
- Health services – Quebec used health services data and their denominator included all those who were eligible for Quebec’s health insurance plan for at least one day between January 1, 1996, and March 31, 2015
- Education – Nova Scotia, Newfoundland and Labrador, New Brunswick (Anglophone schools only), Prince Edward Island and the Yukon all used school system data for the denominators
- Social services – British Columbia provided social service data and their denominators were derived from BC government statistics. These population estimates are derived using methods described and are consistent in aggregate form with the Statistics Canada produced annual (July 1) provincial level totals.
Prevalence Numerators
The total number of ASD cases within the surveillance year was collected via three different methods.
- Point prevalence – for Ministry/Department of Education school based ASD data, a point prevalence method was used. The dates for the point prevalence ranged from July and August for all PTs providing education data, i.e., Nova Scotia, Newfoundland and Labrador, New Brunswick (Anglophone schools only), Prince Edward Island and the Yukon. A feasibility study done in Nova Scotia showed that summer point prevalence estimates did not vary more than 0.1 percent when compared to end of calendar year estimated and therefore the summer point prevalence data were used for all NASS participating PTs submitting school based data.
- Aggregate prevalence – For 2015 Quebec and British Columbia provided aggregate numerator data tables. Aggregate data have proven to be a valid method of receiving surveillance data (e.g., The Canadian Chronic Disease Surveillance System uses aggregate data for a variety of chronic conditions in Canada). Aggregate data have no personal identifiers attached.
- Suppression of cells with aggregate data – data that included more than one descriptor (e.g. age and sex) where a cell size was less than five were suppressed using formulas which randomly put a number between one and four in the cell.
List of acronyms
- ADDM
- Autism and Developmental Disabilities Monitoring Network
- ASD
- Autism Spectrum Disorder
- ASD-AC
- Autism Spectrum Disorder Advisory Committee
- CDC
- Centers for Disease Control and Prevention
- DSM-5
- Diagnostic and Statistical Manual of Mental Disorders, 5th Edition
- ICD
- International Classification of Diseases
- INSPQ
- Institut national de santé publique du Québec
- MED-ÉCHO
- Maintenance et exploitation des données pour l'étude de la clientèle hospitalière
- MSSS
- Ministère de la Santé et des Services sociaux
- NASS
- National Autism Spectrum Disorder Surveillance System
- NEDSAC
- National Epidemiological Database for the Study of Autism in Canada
- PASS
- Prince Edward Island Autism Surveillance System
- PIA
- Privacy Impact Assessment
- PHAC
- Public Health Agency of Canada
- PT/PTs
- Provinces and Territories
- RAMQ
- Régie de l'assurance maladie du Québec
- SISMAC
- Système intégré de surveillance des maladies chroniques du Québec
- TIENET
- Technology for Improving Education Network