
Chlamydia, gonorrhea and infectious syphilis in Canada: 2020 (infographic)

Download in PDF format
(1 MB, 1 page)
Organization: Public Health Agency of Canada
Type: Infographic
Date published: 2023-02-13
ISBN: 978-0-660-47203-4
Cat.: HP40-284/2020E-PDF
Pub.: 220710
The Public Health Agency of Canada collects information on reported cases of sexually transmitted infections (STI) such as chlamydia, gonorrhea and infectious syphilisFootnote 1 through the Canadian Notifiable Diseases Surveillance System (CNDSS).
Introduction
- The COVID-19 pandemic affected the demand for and access to services related to sexually transmitted and blood-borne infections, including testingFootnote 2. This likely impacted new chlamydia, gonorrhea and infectious syphilis diagnosis rates in 2020.
- In the last decade, rates of chlamydia, gonorrhea and infectious syphilis have been rising. Between 2011 and 2019, rates have increased by 26% for chlamydia, 171% for gonorrhea, and 389% for infectious syphilis.
- Chlamydia remains the most commonly reported sexually transmitted infection.
- Antimicrobial resistance in gonorrhea remains an important public health concernFootnote 3
- Increasing rates of infectious syphilis in females have led to increased counts of congenital syphilisFootnote 4
Reported rates of chlamydia, gonorrhea and infectious syphilis from 2011 to 2020
- From 2011 to 2020, chlamydia had the highest reported rates among the three STI
- The reported rates of chlamydia and gonorrhea have also been increasing in recent years but at a slower rate than infectious syphilis
- While reported rates of chlamydia decreased in 2020, rates of gonorrhea and syphilis remained relatively stable between 2019 and 2020
- From 2011 to 2019, the reported rate of chlamydia increased from 296.2 per 100,000 people to 372.9 per 100,000 people. However, in 2020, there was a decrease in the chlamydia rate to 278.9 per 100,000 people (Figure 1)
- From 2011 to 2019, the rate of reported chlamydia among males increased faster than among females, narrowing the gap between female and male rates of reported chlamydia (Figure 1)
- Rates of reported chlamydia decreased in both males and females in 2020 (Figure 1)
- From 2011 to 2019, the rate of reported gonorrhea increased from 35.0 per 100,000 people to 94.8 per 100,000 people. However, in 2020, there was a decrease in the gonorrhea rate to 81.1 per 100,000 people (Figure 2)
- From 2011 to 2012, rates of reported gonorrhea were similar and somewhat stable among males and females. As of 2013, rates of reported gonorrhea began increasing in both sexes, but have been increasing faster in males than in females, widening the gap between male and female rates of reported gonorrhea (Figure 2)
- Rates of reported gonorrhea decreased in both males and females in 2020 (Figure 2)
- From 2011 to 2019, the rate of reported infectious syphilis increased from 5.1 per 100,000 people to 25.0 per 100,000 people. In 2020, there was a small decrease in the infectious syphilis rate to 24.6 per 100,000 people (Figure 3)
- Reported infectious syphilis rates have increased substantially in recent years, especially among women (Figure 3)
- Reported rates of infectious syphilis decreased among males, but continued to increase among females in 2020 (Figure 3)
Reported rates of chlamydia, gonorrhea and infectious syphilis in Canada, 2011 to 2020
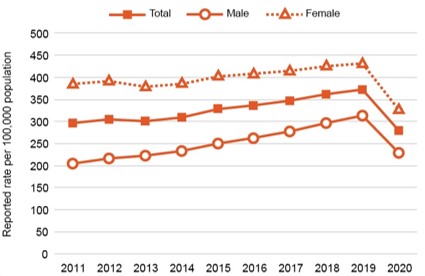
Figure 1 - Text description
Text Description: Chlamydia
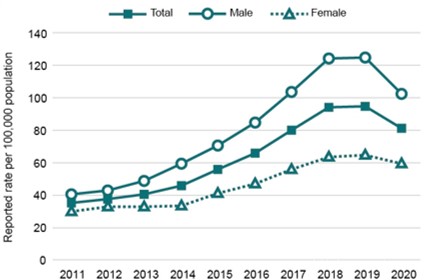
Figure 2 - Text description
Text Description: Gonorrhea
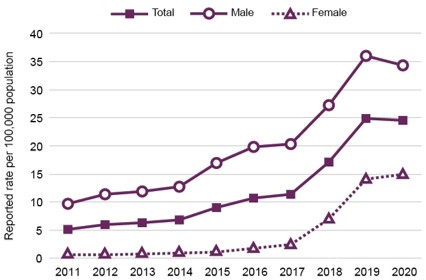
Figure 3 - Text description
Text Description: Infectious syphilis
Number of reported cases of chlamydia, gonorrhea and infectious syphilis in 2020
In 2020, there were:
- 105,982 reported cases of chlamydia
- 30,833 reported cases of gonorrhea and
- 9,358 reported cases of infectious syphilis
Reported rates of chlamydia, gonorrhea and infectious syphilis by province or territory in 2020
- Caution should be used when comparing rates across provinces and territories. Reported STI rates in provinces and territories with a relatively small population size are prone to fluctuation and instability due to small population denominators. To contextualize rates, it is also important to look at the case counts per province and territory
- Overall, across the three STI (chlamydia, gonorrhea and infectious syphilis), in 2020, reported rates were lowest in the Atlantic Provinces (New Brunswick, Newfoundland and Labrador, Nova Scotia, and Prince Edward Island) and highest in Northern (Yukon, Northwest Territories and Nunavut) and Central (Ontario, Quebec) Canada
- In 2020, the highest rates of reported chlamydia cases were observed in the territories: Nunavut (3816.1 per 100,000 population), Northwest Territories (1578.4 per 100,000 population) and Yukon (628.3 per 100,000 population)
- In 2020, the lowest rates of reported chlamydia cases were observed in Newfoundland and Labrador (151.4 per 100,000 population), Prince Edward Island (206.3 per 100,000 population), and New Brunswick (211.7 per 100,000 population)
- In 2020, the highest rates of reported gonorrhea cases were observed in Nunavut (2433.3 per 100,000 population), Northwest Territories (773.8 per 100,000 population) and Manitoba (245.2 per 100,000 population)
- In 2020, the lowest rates of reported gonorrhea cases were observed in Newfoundland and Labrador (1.7 per 100,000 population), New Brunswick (6.6 per 100,000 population), and Prince Edward Island (8.7 per 100,000 population)
- In 2020, the highest rates of reported infectious syphilis cases were observed in Nunavut (128.7 per 100,000 population), Manitoba (118.0 per 100,000 population), and Saskatchewan (78.3 per 100,000 population)
- In 2020, the lowest rates of reported infectious syphilis cases were observed in New Brunswick (1.8 per 100,000 population), Nova Scotia (2.8 per 100,000 population), and Newfoundland and Labrador (4.6 per 100,000 population). Case counts and rates in Prince Edward Island and Yukon were suppressed for having less than 5 cases
Proportion of reported cases of chlamydia, gonorrhea and infectious syphilis in 2020 by sex
- Among all reported chlamydia cases in 2020, females were the most affected and accounted for 59% of all reported chlamydia cases
- Among all reported gonorrhea cases in 2020, males were the most affected and accounted for 63% of all reported gonorrhea cases
- Among reported infectious syphilis cases in 2020, males were the most affected and accounted for 69% of all reported infectious syphilis cases
Proportion of reported cases of chlamydia, gonorrhea and infectious syphilis in 2020 by age group
- In 2020, 73% of all reported chlamydia cases, 51% of all reported gonorrhea cases and 38% of all reported infectious syphilis cases were among people younger than 30 years of age
- Among reported chlamydia cases, the most affected age group was those aged 15-24 years old, representing 53% of total chlamydia cases in 2020
- Among all reported gonorrhea cases, cases were relatively evenly distributed across the 15-24 (29%), 25-29 (22%), and 30–39 (30%) year-old age groups in 2020
- Among all reported infectious syphilis cases, the most affected age group was those older than 30 years old, representing 61% of total infectious syphilis cases in 2020
Appendix A: Data tables corresponding to STI figures
| Year | Chlamydia | Gonorrhea | Infectious syphilis | ||||||
|---|---|---|---|---|---|---|---|---|---|
| Male | Female | Total | Male | Female | Total | Male | Female | Total | |
| 2011 | 204.5 | 385.6 | 296.2 | 40.3 | 29.7 | 35.0 | 9.7 | 0.7 | 5.1 |
| 2012 | 216.2 | 390.4 | 304.3 | 42.8 | 32.6 | 37.7 | 11.3 | 0.6 | 5.9 |
| 2013 | 222.2 | 378.5 | 301.3 | 48.4 | 32.9 | 40.7 | 11.9 | 0.8 | 6.3 |
| 2014 | 232.1 | 384.8 | 309.4 | 59.1 | 33.1 | 46.0 | 12.7 | 0.9 | 6.8 |
| 2015 | 250.6 | 401.2 | 327.0 | 70.5 | 40.9 | 55.6 | 17.0 | 1.0 | 9.0 |
| 2016 | 263.1 | 408.8 | 337.0 | 84.7 | 47.1 | 65.9 | 19.9 | 1.7 | 10.8 |
| 2017 | 277.8 | 414.1 | 347.0 | 103.7 | 55.8 | 79.7 | 20.3 | 2.4 | 11.3 |
| 2018 | 296.8 | 424.1 | 361.6 | 124.4 | 63.7 | 94.1 | 27.2 | 6.9 | 17.1 |
| 2019 | 313.0 | 430.7 | 372.9 | 124.9 | 64.6 | 94.8 | 36.0 | 14.0 | 25.0 |
| 2020 | 229.1 | 326.7 | 278.9 | 102.4 | 59.5 | 81.1 | 34.3 | 14.9 | 24.6 |
| The 'total' rate includes all males, females and those who did not disclose their sex (unknown sex). | |||||||||
| PT | Chlamydia | Gonorrhea | Infectious syphilis | ||||||
|---|---|---|---|---|---|---|---|---|---|
| Male | Female | Total | Male | Female | Total | Male | Female | Total | |
| BC | 217.3 | 281.8 | 250.6 | 112.6 | 47.0 | 80.0 | 26.3 | 3.1 | 14.6 |
| AB | 260.8 | 378.5 | 319.5 | 126.0 | 95.3 | 110.8 | 63.8 | 49.8 | 56.9 |
| SK | 274.3 | 510.1 | 391.8 | 168.9 | 206.3 | 187.6 | 75.7 | 80.9 | 78.3 |
| MB | 360.7 | 618.7 | 490.4 | 216.0 | 274.2 | 245.2 | 119.5 | 116.5 | 118.0 |
| ON | 217.6 | 283.1 | 251.6 | 86.8 | 36.7 | 61.8 | 28.7 | 2.9 | 15.7 |
| QC | 216.4 | 321.1 | 269.6 | 97.5 | 33.6 | 65.8 | 21.9 | 3.0 | 12.5 |
| NB | 153.4 | 268.9 | 211.7 | 8.8 | 4.6 | 6.6 | 2.6 | NA | 1.8 |
| NS | 160.4 | 277.7 | 220.5 | 10.8 | 7.2 | 9.0 | 4.8 | NA | 2.8 |
| PEI | 148.0 | 261.8 | 206.3 | 11.4 | 6.1 | 8.7 | NA | NA | NA |
| NL | 108.4 | 193.4 | 151.4 | 2.7 | 0.8 | 1.7 | 7.7 | NA | 4.6 |
| YT | 501.4 | 759.3 | 628.3 | 51.5 | 38.7 | 45.2 | NA | NA | NA |
| NT | 1218.5 | 1958.7 | 1578.4 | 772.3 | 775.3 | 773.8 | 90.1 | 54.4 | 72.7 |
| NU | 2776.0 | 4892.8 | 3816.1 | 1969.9 | 2902.0 | 2433.3 | 95.7 | 163.3 | 128.7 |
| Canada | 229.1 | 326.7 | 278.9 | 102.4 | 59.5 | 81.1 | 34.3 | 14.9 | 24.6 |
| NA: Data suppressed as there were less than 5 cases reported The 'total' rate includes all males, females and those who did not disclose their sex (unknown sex). |
|||||||||
| Age group (years) | Chlamydia | Gonorrhea | Infectious syphilis | ||||||
|---|---|---|---|---|---|---|---|---|---|
| Male | Female | Total | Male | Female | Total | Male | Female | Total | |
| 15-24 | 41% | 61% | 53% | 21% | 41% | 29% | 12% | 33% | 19% |
| 25-29 | 23% | 19% | 20% | 22% | 21% | 22% | 18% | 23% | 19% |
| 30-39 | 23% | 14% | 18% | 33% | 25% | 30% | 33% | 31% | 33% |
| 40+ | 12% | 5% | 8% | 24% | 11% | 19% | 36% | 13% | 29% |
| The 'total' case count includes all males, females and those who did not disclose their sex (unknown sex). | |||||||||
| Male cases (n) | Proportion of male cases | Female cases (n) | Proportion of female cases | Total cases (n) | |
|---|---|---|---|---|---|
| Chlamydia | 43,233 | 41% | 62,494 | 59% | 105,982 |
| Gonorrhea | 19,331 | 63% | 11,388 | 37% | 30,833 |
| Infectious syphilis | 6,475 | 69% | 2,856 | 31% | 9,358 |
| The 'total' case count includes all males, females and those who did not disclose their sex (unknown sex). | |||||
Appendix B: List of supplementary tables and figures
Due to the impact of the COVID-19 pandemic on reported chlamydia, gonorrhea and infectious syphilis cases and rates, a 2020 STI in Canada surveillance report was not prepared by the Public Health Agency of Canada. However, the supplementary tables described below are available upon request via sti-hep-its@phac-aspc.gc.ca.
Tables
- Rates of reported chlamydia cases, by age group and province/territory, 2020
- Rates of reported gonorrhea cases, by age group and province/territory, 2020
- Rates of reported infectious syphilis cases, by age group and province/territory, 2020
- Rates of reported infectious syphilis cases, by sex and province/territory, 2020
- Rates of reported infectious syphilis cases in Canada per 100,000 overall, by age group, 2011-2020
- Rates of reported infectious syphilis cases in Canada, per 100,000 males, by age group, 2011-2020
- Rates of reported infectious syphilis cases in Canada, per 100,000 females, by age group, 2011-2020
- Number of cases and rates of congenital syphilis, rates of infectious syphilis among females aged 15-39 years, and rates of infectious syphilis among females, 2011-2020
- Surveillance data by province and territory, year, infection and sex, 2011-2020
- Overall population estimates of provinces and territories in Canada, by year, 2011-2020
- Male population estimates of provinces and territories in Canada, by year, 2011-2020
- Female population estimates of provinces and territories in Canada, by year, 2011-2020
Figures
- Percent change in rates of reported cases of STI, relative to reference year 2011, 2011-2020
- Percent change in male rates of reported cases of STI, relative to reference year 2011, 2011-2020
- Percent change in female rates of reported cases of STI, relative to reference year 2011, 2011-2020
- Proportion of total reported chlamydia cases, by sex and age group, 2020
- Proportion of total reported chlamydia cases, by sex and province/territory, 2020
- Proportion of total reported gonorrhea cases, by sex and age group, 2020
- Proportion of total reported gonorrhea cases, by sex and province/territory, 2020
- Proportion of total reported infectious syphilis cases, by sex and age group, 2020
- Number of cases of infectious syphilis, by province/territory, 2020
- Proportion of total reported infectious syphilis cases, by sex and province/territory, 2020
Notes
For more information, visit Sexual health
Data source: National annual STI rates were calculated using the number of chlamydia, gonorrhea and infectious syphilis cases from the Canadian Notifiable Disease Surveillance System as numerators and Statistics Canada April 2022 yearly population estimates as denominators.
Observed differences in the data published here and the data published in provincial and territorial surveillance products (such as variation in reporting of first-time diagnoses) may be due to reporting delays, differences in the date data were extracted from the provincial and territorial surveillance databases or other reporting variations. Where such differences are noted, it is recommended that data and results from provincial and territorial products be used.
References
- Footnote 1
-
Infectious syphilis includes the primary, secondary and early latent (less than one year after infection) stages of infection
- Footnote 2
-
Survey of the impact of COVID-19 on the ability to provide STBBI prevention, testing and treatment including harm reduction services in Canada. Public Health Agency of Canada, Centre for Communicable Diseases and Infection Control. 2021. Retrieved December 2022, from https://www.canada.ca/en/public-health/services/publications/diseases-conditions/survey-impact-covid-19-delivery-stbbi-prevention-testing-treatment.html
- Footnote 3
-
Thorington R, Sawatzky P, Lefebvre B, Diggle M, Hoang L, Patel S, Van Caessele P, Minion J, Garceau R, Matheson M, Haldane D, Gravel G, Mulvey MR, Martin I. Antimicrobial susceptibilities of Neisseria gonorrhoeae in Canada, 2020. Can Commun Dis Rep 2022;48(11/12):571–9. https://doi.org/10.14745/ccdr.v48i1112a10
- Footnote 4
-
Public Health Agency of Canada. Infectious syphilis and congenital syphilis in Canada, 2021. Can Commun Dis Rep 2022;48(11/12): 587. Retrieved February 2023, from https://www.canada.ca/en/public-health/services/reports-publications/canada-communicable-disease-report-ccdr/monthly-issue/2022-48/issue-11-12-november-december-2022/infectious-congenital-syphilis-canada-2021.html