
Report on the Enhanced Surveillance of Antimicrobial-Resistant Gonorrhea - Results from the 2014 Pilot

Download the alternative format
(PDF format, 730 KB, 35 pages)
Organization:
Public Health Agency of Canada
Date published: 2018-01-23
Table of contents
- Acknowledgements
- Executive Summary
- 1.0 Introduction
- 2.0 Methods
- 3.0 Results
- 4.0 Discussion
- References
- Appendix A
- Appendix B
Acknowledgements
The development of the Enhanced Surveillance of Antimicrobial-Resistant Gonorrhea (ESAG) pilot and the publication of this report would not have been possible without the collaboration of Alberta Health Services; Alberta Provincial Laboratory for Public Health; Manitoba Health, Seniors and Active Living; Cadham Provincial Laboratory; the Nova Scotia Health Authority (Central Zone); and Provincial Public Health Laboratory Network of Nova Scotia. The authors also gratefully acknowledge the contributions of sentinel sites in those jurisdictions.
This report was prepared by the Centre for Communicable Diseases and Infection Control and the National Microbiology Laboratory, Infectious Disease Prevention and Control Branch, Public Health Agency of Canada (PHAC).
Executive Summary
- Gonorrhea is the second most common bacterial sexually transmitted infection (STI) in Canada with over 16,000 cases annually. Antimicrobial resistance (AMR) in Neisseria gonorrhoeae (N. gonorrhoeae) is a serious threat to effective treatment of gonococcal infections.
- The pilot phase of the Enhanced Surveillance of Antimicrobial-Resistant Gonorrhea (ESAG) was launched by the Centre for Communicable Diseases and Infection Control and the National Microbiology Laboratory to improve the understanding of current levels and trends of AMR gonorrhea in Canada and to provide better evidence to inform the development of treatment guidelines and public health interventions to minimize the spread of antimicrobial resistant N. gonorrhoeae.
- In 2014, epidemiological and laboratory data were collected from sentinel sites in four jurisdictions: Calgary, Edmonton, Winnipeg and Halifax. Sentinel sites were selected by participating provincial/local health authorities and were sexual health or STI clinics or healthcare providers with the capacity to collect cultures for testing and provide enhanced epidemiological and clinical data.
- In 2014, ESAG captured 385 cultures from 334 cases. Fifteen percent (n=49/334) of these cases had multiple (two or three) isolates from different sites of infection. The majority of cases were male (86.2%, 288/334) and less than 40 years old (87%, 290/334). Two-thirds of cases (64.4%, 215/334) were among men who have sex with men (MSM). Almost all female cases reported male sexual partners.
- Isolates from female cases were predominantly cervical/vaginal (57.9%, 33/57). Isolates from non-MSM were almost exclusively urethral (98.5%, 66/67), whereas those from MSM were distributed between the rectum (39.1%, 99/253), urethra (32.0%, 81/253), and pharynx (28.9%, 73/253).
- In addition to the 334 participants on whom detailed epidemiological information was available, 125 susceptible cases who attended the participating centres in Alberta in the second half of the month were included in the denominator for resistance calculation (n=459). Overall, 3.5% (16/459) of isolates had decreased susceptibility to cefixime (MIC≥0.25 mg/L). 1.5% (7/459) of ESAG isolates had decreased susceptibility to ceftriaxone and 1.5% (7/459) were resistant to azithromycin. The different participating centres exhibited dissimilar rates of decreased susceptibility/resistance to cefixime, ceftriaxone, and azithromycin. The resistance rates for other antimicrobials such as penicillin, tetracycline, erythromycin, ciprofloxacin, and spectinomycin were 17.4%, 49.9%, 25.7%, 27.5%, and 0.0%, respectively, and were more evenly distributed across participating sites.
- Of the 334 isolates included in multi-antigen sequence typing analysis, 114 sequence types (STs) were identified. The three most prevalent STs were ST5985 at 12.6% (42/334), ST10129 at 6.0% (20/334), and ST11299 at 5.4% (18/334).
- Among MSM, 79% (112/142) of ano-genital infections were treated with the preferred treatment of ceftriaxone 250mg in combination with azithromycin 1g. Pharyngeal infections among MSM were given the highest proportion (94.5%, 69/73) of preferred treatment. Ano-genital infections among other adults were treated fairly consistently with a preferred treatment (80%, 83/104). The two preferred combination therapies were equally prescribed (n=39 for the ceftriaxone treatment, n=44 for the cefixime treatment).
1.0 Introduction
Gonorrhea is the second most common bacterial STI in Canada with over 16,000 cases reported annuallyReference 1. The causative organism, Neisseria gonorrhoeae, has long been known to quickly and efficiently acquire antimicrobial resistance (AMR) via various evolutionary adaptationsReference 2. Increases in the resistance to the cephalosporins and azithromycin prompted new recommendations for treatment of gonorrhea in the Canadian Guidelines on Sexually Transmitted Infections to combination therapy with 250 mg ceftriaxone injected intramuscularly (IM) and azithromycin 1 g orally (PO) as a first-line treatment for uncomplicated anogenital and pharyngeal infections in adultsReference 3. Drug resistance in N. gonorrhoeae was cited as an emerging "super bug" by the World Health Organization in 2012Reference 4 and in September 2013, it was described by the Director of the Centers for Disease Control and Prevention (CDC) as one of the three most critical public health threats to the United StatesReference 5. Management of antimicrobial resistance has been identified as a priority in PHAC's 2015-2016 Report on Plans and Priorities, Corporate Risk Profile, and PHAC's Operating Plan.
Antimicrobial resistance (AMR) testing is standard laboratory practice for all positive gonorrhea isolates tested by culture in Canada. However, the introduction of nucleic acid amplification testing (NAAT) for gonorrhea in 1997 has led to a decrease in the number of gonorrhea isolates available for AMR testing. From a public health perspective, NAAT is advantageous because it is less invasive (it can be performed on urine specimens) and leads to increasing the number of cases detected and treated. However, while testing practices may be enhanced, particularly amongst high-risk populations, the consequent decrease in the number of swabs collected for culture is a disadvantage because the number of isolates available for AMR testing is considerably reduced.
Antimicrobial resistance testing is an important component of gonococcal (GC) surveillance as it 1) allows for the identification and characterization of resistant isolates in circulation and 2) monitors changes in the proportion of isolates that are resistant, which is vital for informing clinical treatment guidelines. Currently, all ten provinces employ culture for a proportion of the total gonorrhea tests done in their jurisdictions (typically conducted by local/regional laboratories), but NAAT is the recommended testing method for diagnosis in some of these jurisdictions. Most jurisdictions with provincial laboratories that perform culture also perform AMR testing on all positive cultures. Resistant isolates, as well as all isolates from jurisdictions that do not do AMR testing, are sent from provincial laboratories to the National Microbiology Laboratory (NML), which performs a standard panel of AMR testing on the isolates. However, the jurisdictions determine which isolates are submitted to NML and the selection criteria are not always consistent, resulting in lack of representativeness.
The NML also performs N. gonorrhoeae multi-antigen sequence typing (NG-MAST) as a means to describe the circulating strains of gonorrhea across Canada. The only epidemiological data collected on these isolates are gender, age of patient, province and anatomic site of isolation.
Gonorrhea is a nationally notifiable disease; however, the amount and quality of information collected and reported to PHAC through routine surveillance is limited. Comprehensive national epidemiological data for resistant gonorrhea isolates are currently not available, limiting the ability to assess risk factors associated with AMR and guide treatment recommendations at a national level. There are also significant difficulties in deriving a valid denominator to estimate the prevalence and patterns of AMR in Canada. While it appears that antimicrobial resistance in N. gonorrhoeae is increasing in parts of the country, a national, standardized surveillance system does not currently exist to confirm these hypotheses.
The establishment of a pan-Canadian, standardized approach to surveillance, combining both epidemiologic and laboratory data, would provide better representation across the country and greater confidence in the estimation of the proportion of resistant isolates. Coupled with NG-MAST, it would also provide an opportunity to detect unusual clusters. Each of these enhancements in data quality would allow for better informed treatment guidelines and more timely cluster and outbreak response.
The Centre for Communicable Diseases and Infection Control (CCDIC), in partnership with the NML and three provinces, launched the pilot phase of the Enhanced Surveillance of Antimicrobial-Resistant Gonorrhea (ESAG) in 2013. Alberta, which already collected data relevant to GC-AMR, was the first participating jurisdiction. Winnipeg and the Capital District Health Authority in Nova Scotia (now the Nova Scotia Health Authority Central Zone), began collecting data in 2014. Other provinces and territories deferred the invitation to participate in ESAG pilot project.
1.1 Project Goal
The overall goal of this integrated epidemiology-laboratory surveillance system is to improve the understanding of current levels and trends of AMR gonorrhea in Canada and to provide better evidence to guide the development of treatment guidelines and public health interventions to minimize the spread of antimicrobial resistant N. gonorrhoeae. The pilot phase of ESAG aimed to determine the feasibility of implementing an integrated surveillance system that can monitor antimicrobial resistant N. gonorrhoeae. ESAG pilot data together with other data sources may also be used to inform treatment guidelines and public health practices in the provinces/territories.
1.2 Project Deliverables
The objectives of this surveillance system were:
- To increase the number of gonococcal cultures performed at participating sentinel sites in order to improve monitoring of gonorrhea AMR.
- To monitor antimicrobial susceptibilities of N. gonorrhoeae among newly diagnosed culture-confirmed gonorrhea cases and cases of treatment failureFootnote a.
- To collect additional epidemiological data (demographics and risk factors) on people who provided samples for a gonococcal culture, including newly diagnosed, culture-confirmed, gonorrhea cases and cases of treatment failure, to determine the risk factors for gonorrhea AMR in that population.
- To collect data on the drugs prescribed to treat gonorrhea.
- To identify the sequence types of circulating antimicrobial resistant N. gonorrhoeae via NG-MAST.
2.0 Methods
2.1 Data Collection
Data were based on extracts of eligible gonorrhea cases and their associated demographic, behavioural, and treatment data elements reported to public health officials on routine/enhanced case report forms from participating jurisdictions. These data were later linked to laboratory testing data from the NML, such as antimicrobial susceptibility and sequence typing data, described further below.
The data elements collected as part of epidemiological information included information on demographics (e.g. age, sex, site of infection, and province), sexual partner, risk behaviours, reasons for visit, and treatment.
Sentinel sites submitted isolates to provincial public health laboratories for antimicrobial susceptibility testing, which were then forwarded on to the NML where sequence typing and susceptibility testing, on an expanded panel of antimicrobials, were performed. Data for isolates that met the eligibility criteria were submitted to ESAG. For jurisdictions that rely on NML for their susceptibility testing, all isolates were sent to NML for testing.
Data were collected from sentinel sites in four jurisdictions: Calgary, Edmonton, Winnipeg and Halifax. Sentinel sites were selected by participating provincial/local health authorities and were sexual health or STI clinics or healthcare providers with the capacity to collect cultures for testing and provide enhanced epidemiological and clinical data. Where possible, the number of gonococcal cultures performed was increased in order to improve monitoring of antimicrobial-resistant gonorrhea.
Both epidemiological and laboratory data were entered or uploaded into a password-protected, web-accessible, jurisdictionally-filtered database hosted on the Canadian Network for Public Health Intelligence (CNPHI) platform. Necessary steps were taken to ensure accurate linkage of epidemiological data, entered by the sentinel sites, to laboratory results, entered by NML, in this database.
Case definitions
The national case definition for gonorrhea was used and consists of laboratory evidence of detection of Neisseria gonorrhoeae by culture or by nucleic acidReference 6.
In the absence of a pan-Canadian consensus on the definition of treatment failure, the case definition for treatment failure was the absence of sexual contact during the post-treatment period AND one of the following:
- gram negative intracellular diplococci at least 72 hours post treatment;
- Positive N. gonorrhoeae culture at least 72 hours post treatment; or
- Positive N. gonorrhoeae NAAT at least 2-3 weeks post treatmentReference 3.
An "ESAG case" refers to any patient, 16 years of age and older, from whom a specimen or all specimens collected within thirty days, met the national case definition of gonorrhea, i.e. was/were laboratory confirmed by culture collected within 30 days from the same patient, and met the following:
- resistance to at least one antibiotic, or
- decreased susceptibility to ceftriaxone or cefixime, or
- treatment failure
- isolate was susceptible to all antibiotics tested, from
- the first half of each month in Alberta
- the whole month for Winnipeg and Halifax where there were fewer cases.
2.2 Laboratory Methods
Antimicrobial susceptibility testing for isolates
Minimum inhibitory concentration (MIC), the minimum concentration of antibiotic that will inhibit the growth of the organism, was determined for ceftriaxone, cefixime, azithromycin, ciprofloxacin, erythromycin, penicillin, tetracycline and spectinomycin on all N. gonorrhoeae isolates using agar dilution. The interpretations of MIC were based on the Clinical and Laboratory Standards Institute (CLSI) breakpointsReference 7 except for: cefixime decreased susceptibility MIC≥0.25 mg/L; ceftriaxone decreased susceptibility MIC≥0.125 mg/LReference 4; and azithromycin resistance MIC≥2.0 mg/LReference 8. Refer to Appendix A and Appendix B for details.
Sequence typing for isolates
Sequence typing was determined using the N. gonorrhoeae multi-antigen sequence typing (NG-MAST) methodReference 9 that incorporates the amplification of the porin gene (por) and the transferrin-binding protein gene (tbpB). DNA sequences of both strands were edited, assembled and compared using DNAStar, Inc. software. The resulting sequences were submitted to the NG-MAST website to determine the sequence types (ST). Concatenated NG-MAST porB and tbpB sequences were aligned using ClustalWReference 10 and a maximum likelihood phylogenetic tree was generated using PhyMLReference 11 with parameters: "--quiet -b -4 -m GTR -s BEST". The phylogenetic tree was visualized using FigTreeReference 12 and phylogenetic clades were determined by cluster analysis using ClusterPickerReference 13 with the following settings: initial and main support thresholds = 0.9, genetic distance threshold = 3.5 and the large cluster threshold = 10.
2.3 Data analysis
Though ESAG was initiated in 2013, the analysis was limited to 2014 data when all four sites were active participants. Frequencies were calculated for cases with positive cultures. Negative cultures (such as those from a follow-up visit or test-of-cure) were excluded.
For analyses, only one culture per case was included. When more than one culture per case was submitted, the culture retained for analysis was based on a hierarchy of site of infection; the pharyngeal isolate was prioritized, followed by rectal, urethral, and cervical samples. This hierarchy was determined through consensus with ESAG sites and stakeholders. However, all cultures were retained for analysis when describing the sites of infection overall.
To improve data quality, a derived sexual behaviour variable was created to supplement the self-reported 'sex of sexual partner'. In addition to including males who self-reported sexual partner as male or both male and female, the derived "men who have sex with men (MSM)" variable includes males who did not provide information on the sex(es) of their sexual partner(s), but had a rectal infection. "Non-MSM" was defined as males who either only had female partners or males who did not report any male sexual partners and did not have a rectal infection. "Male Unknown" refers to males who did not provide sexual partner information, who also did not have a rectal isolate. Female and transgender cases were grouped together for antimicrobial susceptibility analysis due to there being only one transgender case, which had a vaginal site of infection.
The protocol stipulated collection of isolates susceptible to all antibiotics tested, from only the first half of each month in Alberta and it leads to biased estimates of the resistance pattern. In order to address this bias, the total number of susceptible isolates from Alberta was collected for the second half of the month and the denominator was suitably adjusted to derive the proportion of sample exhibiting decreased susceptibility/resistance. Since collection of other epidemiological information (such as demographic and sexual behaviours) on the persons having susceptible isolates and seen at the participating centres in Alberta during the second half was not a part of the original protocol, the results are not being presented in terms of resistance patterns according to sexual behaviours.
Figure 1 shows how the ESAG data were categorized to arrive at total number of cultures (including multiple isolates per case), and the total number of cases.
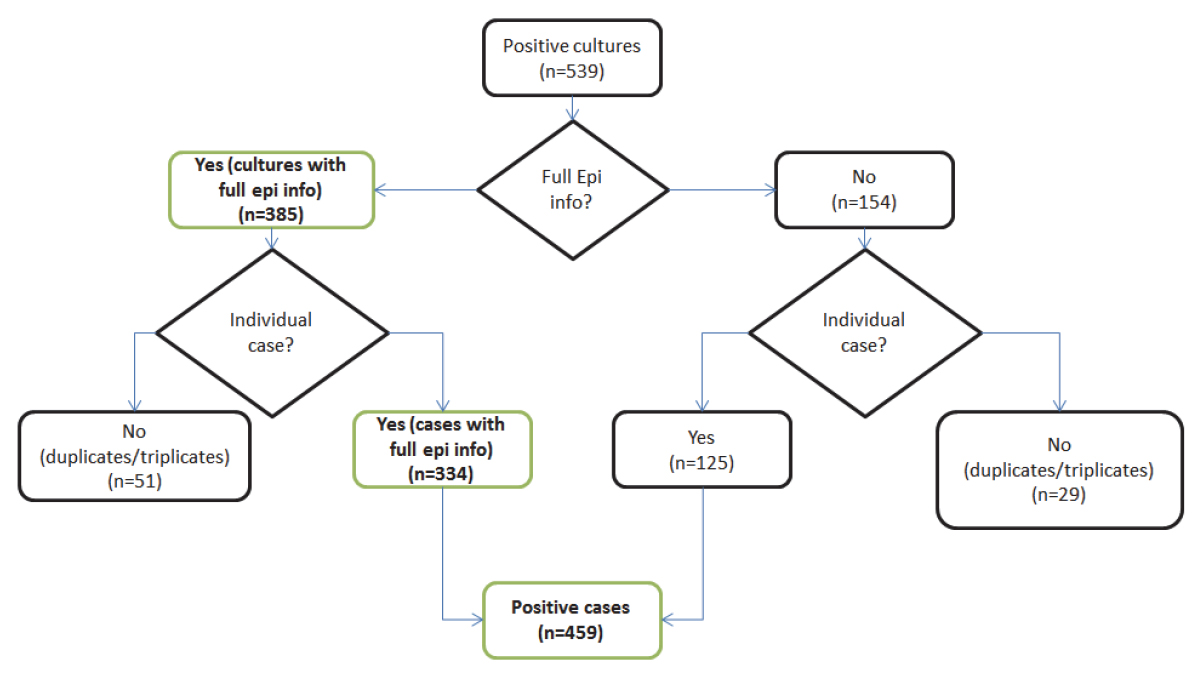
Figure 1 - Flowchart of N. gonorrhoeae isolates included in ESAG, 2014 - Text version
ESAG surveillance captured 539 N. gonorrhoeae positive cultures. 385 of these cultures were accompanied by full epidemiological information of their respective patients, while the other 154 cultures were missing this information. Of the 385 with full information, 334 were from unique patients, while 51 were second or third cultures taken from one patient. An additional 125 unique patients are included from the 154 cultures that did not have full information, giving a total of 459 positive cases in ESAG.
3.0 Results
3.1 Case characteristics
In 2014, ESAG captured 385 cultures from 334 cases. Fifteen percent (n=49) of these cases had multiple (two or three) isolates from different sites of infection. Across the four participating jurisdictions, the majority of cases were male, ranging from 76% in Winnipeg to 93% in Calgary (Table 1). The majority of cases were less than 40 years old (87%). The mean age among cases varied across jurisdictions: 31.8 years old for Calgary, 28.7 years old for Edmonton, 28.2 years old for Winnipeg, and 25.7 years old in Halifax. Also, female cases who accounted for just 13% of total (Table 1) were on average younger than their male counterpart (25.4 years old and 30.7 years old, respectively). Three participating sites provided ethnicity data (Table 1) and it appears that most cases were Caucasian as they accounted for over 64% (n=215).
| Characteristic | Calgary | Edmonton | Winnipeg | Halifax | Overall |
|---|---|---|---|---|---|
| Gender | |||||
| Male | 138 (93.2%) | 120 (81.1%) | 19 (76.0%) | 11 (84.6%) | 288 (86.2%) |
| Female | 9 (6.1%) | 28 (18.9%) | 6 (24%) | 2 (15.4%) | 46 (13.5%) |
| Transgender | 1 (0.7%) | 0 (0%) | 0 (0%) | 0 (0%) | 1 (0.3%) |
| Total | 148 (100%) | 148 (100%) | 25 (100%) | 13 (100%) | 334 (100%) |
| Age | |||||
| 16-19 years | 7 (4.7%) | 18 (12.2%) | 3 (12%) | 2 (15.4%) | 30 (9%) |
| 20-29 years | 65 (43.9%) | 72 (48.6%) | 11 (44%) | 8 (61.5%) | 156 (46.7%) |
| 30-39 years | 47 (31.8%) | 45 (30.4%) | 10 (40%) | 2 (15.4%) | 104 (31.1%) |
| 40-49 years | 18 (12.2%) | 7 (4.7%) | 1 (4 %) | 1 (7.7%) | 27 (8.1%) |
| 50-59 years | 10 (6.8%) | 5 (3.4%) | 0 (0%) | 0 (0%) | 15 (4.5%) |
| 60+ years | 1 (0.7%) | 1 (0.7%) | 0 (0%) | 0 (0%) | 2 (0.6%) |
| Total | 148 (100%) | 148 (100%) | 25 (100%) | 13 (100%) | 334 (100%) |
| Ethnicity | |||||
| First Nations | 2 (1.4%) | 15 (10.1%) | n/a | 0 (0 %) | 17 (5.1%) |
| Métis | 0 (0%) | 12 (8.1%) | n/a | 1 (7.7%) | 13 (3.9%) |
| Caucasian | 114 (77.0%) | 95 (64.2%) | n/a | 6 (46.2%) | 215 (64.4%) |
| Other | 25 (16.9%) | 25 (16.9%) | n/a | 2 (15.4%) | 53 (15.9%) |
| Unknown | 7 (4.7%) | 1 (0.7%) | 25 (100.0%) | 4 (30.8%) | 36 (10.8%) |
| Total | 148 (100%) | 148 (100%) | 25 (100%) | 13 (100%) | 334 (100%) |
Table 1 Notes
|
|||||
3.2 Visit Reason
Three of the four participating sites (Calgary, Edmonton, and Halifax) provided data on the reason for initial visits of reported cases to the sexual health or STI clinics participating in the study.
| Calgary | Edmonton | Winnipeg | Halifax | Overall | |
|---|---|---|---|---|---|
| MSM | |||||
| Signs/Symptoms | 38 (34.2%) | 54 (65.9%) | n/a | 7 (70.0%) | 99 (46.0%) |
| Case Contact | 19 (17.1%) | 10 (12.2%) | n/a | 2 (20.0%) | 31 (14.4%) |
| STI Screening | 27 (24.3%) | 14 (17.1%) | n/a | 1 (10.0%) | 42 (19.5%) |
| Unknown | 8 (7.2%) | 0 (0.0%) | 12 (100%) | 0 (0.0%) | 20 (9.3%) |
| OtherFootnote b | 19 (17.1%) | 4 (4.9%) | n/a | 0 (0.0%) | 23 (10.7%) |
| Subtotal | 111 (100%) | 82 (100%) | 0 (0%) | 10 (100%) | 215 (100%) |
| Non-MSM | |||||
| Signs/Symptoms | 19 (73.1%) | 31 (81.6%) | n/a | 0 (0.0%) | 50 (74.6%) |
| Case Contact | 4 (15.4%) | 5 (13.2%) | n/a | 0 (0.0%) | 9 (13.4%) |
| STI Screening | 0 (0.0%) | 0 (0.0%) | n/a | 0 (0.0%) | 0 (0.0%) |
| Unknown | 0 (0.0%) | 0 (0.0%) | 3 (100.0%) | 0 (0.0%) | 3 (4.5%) |
| Other | 3 (11.5%) | 2 (5.3%) | n/a | 0 (0.0%) | 5 (7.5%) |
| Subtotal | 26 (100%) | 38 (100%) | 3 (100%) | 0 (0.0%) | 67 (100%) |
| Female | |||||
| Signs/Symptoms | 1 (11.1%) | 11 (39.3%) | n/a | 1 (50.0%) | 13 (28.9%) |
| Case Contact | 2 (22.2%) | 9 (32.1%) | n/a | 0 (0.0%) | 11 (24.4%) |
| STI Screening | 3 (33.3%) | 3 (10.7%) | n/a | 0 (0.0%) | 6 (13.3%) |
| Unknown | 0 (0.0%) | 0 (0.0%) | 6 (100.0%) | 1 (50.0%) | 7 (15.6%) |
| Other | 3 (33.3%) | 5 (17.9%) | n/a | 0 (0.0%) | 8 (17.8%) |
| Subtotal | 9 (100%) | 28 (100%) | 6 (100%) | 2 (100%) | 45 (100%) |
| OverallFootnote c | |||||
| Signs/Symptoms | 59 (39.9%) | 96 (64.9%) | n/a | 9 (69.2%) | 164 (49.1%) |
| Case Contact | 25 (16.9%) | 24 (16.2%) | n/a | 2 (15.4%) | 51 (15.3%) |
| STI Screening | 31 (20.9%) | 17 (11.5%) | n/a | 1 (7.7%) | 49 (14.7%) |
| Unknown | 8 (5.4%) | 0 (0.0%) | 25 (100.0%) | 1 (7.7%) | 34 (10.2%) |
| Other | 25 (16.9%) | 11 (7.4%) | n/a | 0 (0.0%) | 36 (10.8%) |
| Grand Total | 148 (100%) | 148 (100%) | 25 (100%) | 13 (100%) | 334 (100%) |
Table 2 Notes
|
|||||
The most common reason for seeking care was signs or symptoms, which accounted for 49.1% (n=164), followed by case contact and STI screening, which represented 15.3% (n=51) and 14.1% (n=49), respectively (Table 2).
3.3 Risk behaviours
Two-thirds of male cases (64.4%) were among men who have sex with men. Almost all female cases reported male sexual partners (Table 3). Only six cases (1.8%) reported involvement in sex work. Travel information was not available for most cases and only three cases for whom data were available reported that their infection may have been travel-related (Table 3).
| Risk behaviours | Calgary | Edmonton | Winnipeg | Halifax | Overall |
|---|---|---|---|---|---|
| Sexual Related Behaviours | |||||
| Among Female/Transgender - Reporting male sexual partners | 9 (6.1%) | 28 (18.9%) | 6 (24 %) | 1 (7.7%) | 43 (12.9%) |
| Among Female/Transgender - OtherFootnote d | 1 (0.7%) | 0 (0.0%) | 0 (0.0%) | 1 (7.7%) | 2 (0.6%) |
| Among Male - Reporting to have sex with men (MSM) | 111 (75%) | 82 (55.4%) | 12 (48 %) | 10 (76.9%) | 215 (64.4%) |
| Among Male - Non-MSM | 26 (17.6%) | 38 (25.7%) | 3 (12%) | 0 (0%) | 67 (20.1%) |
| Among Male - UnknownFootnote e | 1 (0.7%) | 0 (0.0%) | 4 (16%) | 1 (7.7%) | 6 (1.8%) |
| Total | 148 (100%) | 148 (100%) | 25 (100%) | 13 (100%) | 334 (100%) |
| Sex work involvement | |||||
| Yes | 2 (1.4%) | 4 (2.7%) | 0 (0 %) | 0 (0%) | 6 (1.8%) |
| No | 146(98.6%) | 144 (97.3%) | 25 (100%) | 10 (76.9%) | 325 (97.3%) |
| Refused | 0 (0.0%) | 0 (0.0%) | 0 (0.0%) | 1 (7.7%) | 1 (0.3%) |
| Unknown | 0 (0.0%) | 0 (0.0%) | 0 (0.0%) | 2 (15.4%) | 2 (0.6%) |
| Total | 148 (100%) | 148 (100%) | 25 (100%) | 13 (100%) | 334 (100%) |
| Travel-related infection | |||||
| Yes | 0 (0.0%) | 0 (0.0%) | 1 (4%) | 2 (15.4%) | 3 (0.9%) |
| No | 0 (0.0%) | 0 (0.0%) | 24 (96%) | 8 (61.5%) | 32 (9.6%) |
| Refused | 0 (0.0%) | 0 (0.0%) | 0 (0.0%) | 1 (7.7%) | 1 (0.3%) |
| Unknown | 148 (100%) | 148 (100 %) | 0 (0.0%) | 2 (15.4%) | 298 (89.2%) |
| Total | 148 (100%) | 148 (100%) | 25 (100%) | 13 (100%) | 334 (100%) |
| HIV StatusFootnote f | |||||
| Yes | 2 (1.4%) | 4 (2.7%) | 1 (4.0%) | 1 (7.7%) | 8 (2.4%) |
| No | 115 (77.7%) | 117 (79.1%) | 11 (44.0%) | 8 (61.5%) | 251 (75.1%) |
| Refused to answer | 0 (0.0%) | 0 (0.0%) | 0 (0.0%) | 1 (7.7%) | 1 (0.3%) |
| Unknown | 31 (20.9%) | 27 (18.2%) | 13 (52.0%) | 3 (23.1%) | 74 (22.2%) |
| Total | 148 (100%) | 148 (100%) | 25 (100%) | 13 (100%) | 334 (100%) |
3.4 Sites of infection
In total, there were 385 isolates from 334 cases of culture-confirmed gonorrhea. Fifty-one isolates were either duplicates or triplicates, i.e., from multiple sites of infection. Isolates from female cases were predominantly cervical/vaginal (n=33; 57.9%). While those from non-MSM were almost exclusively urethral (Table 4), those from MSM were closely distributed (Table 2) between the rectum (n=99; 39.1%), urethra (n=81; 32.0%), and pharynx (n=73; 28.9%). Jurisdictional differences were less pronounced and could not be appropriately assessed given the small sample size (Table 4).
| Calgary | Edmonton | Winnipeg | Halifax | Overall | |
|---|---|---|---|---|---|
| MSM | |||||
| Rectum | 56 (41.8%) | 30 (31.3%) | 9 (75.0%) | 4 (36.4%) | 99 (39.1%) |
| Pharynx | 47 (35.1%) | 22 (22.9%) | 2 (16.7%) | 2 (18.2%) | 73 (28.9%) |
| Urethra | 31 (23.1%) | 44 (45.8%) | 1 (8.3%) | 5 (45.5%) | 81 (32%) |
| Total | 134 (100%) | 96 (100%) | 12 (100%) | 11 (100%) | 253 (100%) |
| Non-MSM | |||||
| Pharynx | 1 (3.8%) | 0 (0%) | 0 (0%) | 0 (0%) | 1 (1.5%) |
| Urethra | 25 (96.2%) | 38 (100 %) | 3 (100%) | 0 (0%) | 66 (98.5%) |
| Total | 26 (100%) | 38 (100%) | 3 (100%) | 0 (100%) | 67 (100%) |
| Female | |||||
| Cervix/vagina | 6 (37.5%) | 20 (60.6%) | 5 (83.3%) | 2 (100%) | 33 (57.9%) |
| Rectum | 6 (37.5%) | 4 (12.1%) | 1 (16.7%) | 0 (0%) | 11 (19.3%) |
| Pharynx | 4 (25%) | 9 (27.3%) | 0 (0 %) | 0 (0%) | 13 (22.8%) |
| Total | 16 (100%) | 33 (100%) | 6 (100%) | 2 (100%) | 57 (100%) |
| OverallFootnote g | |||||
| Cervix/vagina | 7 (3.9%) | 20 (12%) | 5 (20%) | 2 (14.3%) | 34 (8.8%) |
| Rectum | 63 (35.2%) | 34 (20.4%) | 10 (40%) | 4 (28.6%) | 111 (28.8%) |
| Pharynx | 53 (29.6%) | 31 (18.6%) | 2 (8%) | 2 (14.3%) | 88 (22.9%) |
| Urethra | 56 (31.3%) | 82 (49.1%) | 8 (32%) | 6 (42.9%) | 152 (39.5%) |
| Total | 179 (100%) | 167 (100%) | 25 (100%) | 14 (100%) | 385 (100%) |
3.5 Antimicrobial susceptibility
Cefixime
Overall, 3.5% (n=16) of isolates had decreased susceptibility to cefixime (MIC≥0.25 mg/L) from a minimum of 0.0% in Halifax (n=0) to a maximum of 4.5% (n=9) in Calgary (Table 5).
Ceftriaxone
Overall, 1.5% (n=7) of ESAG cases had decreased susceptibility to ceftriaxone. There were no cases with decreased susceptibility in Halifax (Table 5) and only one in Winnipeg (4.0%). In Calgary 2.5% demonstrated decreased susceptibility to ceftriaxone.
Azithromycin
Among ESAG cases, 1.5% were resistant to azithromycin. In Edmonton 2.7% of isolates were resistant to azithromycin as compared to Calgary where it was observed to be 0.5%. No azithromycin resistance was found in Halifax or Winnipeg (Table 5).
Penicillin
About 17.4% (n=80) of ESAG cases were resistant to penicillin, higher resistance to penicillin (Table 5) was observed in Halifax (38.5%) and Winnipeg (36.0%).
Tetracycline
About 50% (n=229) of ESAG cases were resistant to tetracycline. Higher resistance to tetracycline (Table 5) was observed in Halifax (69.2%) and Winnipeg (68.0%).
Erythromycin
About 25.7% (n=118) of the cases were resistant to erythromycin and higher resistance to tetracycline (Table 5) was observed in Halifax (61.5%) and Winnipeg (48.0%).
Ciprofloxacin
The prevalence of ciprofloxacin resistance was 27.5% (n=126). None of the cases from Halifax were resistant to ciprofloxacin (Table 5). Higher resistance to ciprofloxacin was observed in Winnipeg (44.0%; n=11) and Calgary (28.4%; n=57).
Spectinomycin
No resistance to spectinomycin was identified in any of the isolates submitted for this study (Table 5).
All isolates with decreased susceptibility to cefixime and/or ceftriaxone were also resistant to ciprofloxacin in ESAG. Of the 16 isolates with decreased susceptibility to cefixime, seven (43.8%) had decreased susceptibility to ceftriaxone. In addition to ciprofloxacin resistance, ten (62.5%) of the isolates were resistant to tetracycline, seven (43.8%) were resistant to penicillin and three (18.8%) were resistant to erythromycin.
| Calgary (n=201) |
Edmonton (n=220) |
Winnipeg (n=25) |
Halifax (n=13) |
Overall (n=459) |
||||||
|---|---|---|---|---|---|---|---|---|---|---|
| Freq. | % | Freq | % | Freq | % | Freq | % | Freq | % | |
| CefiximeDS | 9 | 4.5% | 6 | 2.7% | 1 | 4.0% | 0 | 0.0% | 16 | 3.5% |
| CeftriaxoneDS | 5 | 2.5% | 1 | 0.5% | 1 | 4.0% | 0 | 0.0% | 7 | 1.5% |
| AzithromycinR | 1 | 0.5% | 6 | 2.7% | 0 | 0.0% | 0 | 0.0% | 7 | 1.5% |
| PenicillinR | 41 | 20.4% | 25 | 11.4% | 9 | 36.0% | 5 | 38.5% | 80 | 17.4% |
| TetracyclineR | 105 | 52.2% | 98 | 44.5% | 17 | 68.0% | 9 | 69.2% | 229 | 49.9% |
| ErythromycinR | 57 | 28.4% | 41 | 18.6% | 12 | 48.0% | 8 | 61.5% | 118 | 25.7% |
| CiprofloxacinR | 57 | 28.4% | 58 | 26.4% | 11 | 44.0% | 0 | 0.0% | 126 | 27.5% |
| SpectinomycinR | 0 | 0.0% | 0 | 0.0% | 0 | 0.0% | 0 | 0.0% | 0 | 0.0% |
Table 5 Notes
| ||||||||||
| Calgary | Edmonton | Winnipeg | Halifax | Overall | |
|---|---|---|---|---|---|
| Susceptible to all selected antimicrobials | 80 (39.8%) | 112 (50.9%) | 8 (32.0%) | 3 (23.1%) | 203 (44.2%) |
| R/DS to 1 antimicrobial | 47 (23.4%) | 42 (19.1%) | 3 (12.0%) | 3 (23.1%) | 95 (20.7%) |
| R/DS to 2 or more antimicrobial | 74 (36.8%) | 66 (30.0%) | 14 (56.0%) | 7 (53.8%) | 161 (35.1%) |
| Total | 201 (100%) | 220 (100%) | 25 (100%) | 13 (100%) | 459 (100%) |
Table 6 Notes
|
|||||
Overall 44.2% of the isolates were susceptible to all antimicrobials, 20.7% demonstrated decreased susceptibility or resistance to one antimicrobial and 35.1% were susceptible to two or more antimicrobials. The proportion of isolates demonstrating decreased susceptibility or resistance to two or more antimicrobials varied across the participating jurisdictions from 30.0% in Edmonton to 56.0% in Winnipeg.
3.6 Antimicrobial characterizations
Tetracycline resistant N. gonorrhoeae with MICs ≥16 mg/L (high-level) and the 25.2Mdal plasmid are referred to as TRNG. There were 66 (n=66; 14.4%) TRNG isolates identified in this study. Of these 66, 52 (78.8%) were not resistant to any of the other antibiotics tested with the remaining 14 isolates being resistant to a combination of penicillin, erythromycin and ciprofloxacin. Six of these isolates were also penicillinase producing Neisseria gonorrhoeae (PPNG), with high-level resistance to penicillin. TRNG was identified in Calgary (n=37; 18.4%), Edmonton (n=25; 11.4%), Winnipeg (n=3; 12.0%) and Halifax (n=1; 7.7%).
Chromosomal mediated resistant Neisseria gonorrhoeae (CMRNG) and Probable CMRNG (refer to the definition in Appendix B) comprised 92 of the 459 ESAG isolates (20.0%). Of these, 32.6% (n=30) were resistant to penicillin, tetracycline and erythromycin alone; 55.4% (n=51) of the CMRNG were resistant to ciprofloxacin; 5.4% (n=5) of the CMRNG were ciprofloxacin resistant and had decreased susceptibility to cephalosporins; and 3.3% (n=3) of the CMRNG were resistant to ciprofloxacin and azithromycin.
| NG-MAST | Cluster | Total No. | Calgary | Edmonton | Manitoba | Halifax | MSM | Non-MSM | Susceptible | CMRNG | Probable CMRNG | CipR | Ce +/or Cx DS | TRNG | TetR | AziR | EryR | PPNG | PenR |
|---|---|---|---|---|---|---|---|---|---|---|---|---|---|---|---|---|---|---|---|
| ST9465 | n/a | 4 | 4 | 0 | 0 | 0 | Y | N | N | N | N | N | N | Y | N | N | Y | N | N |
| ST11302 | 1 | 1 | 0 | 1 | 0 | 0 | Y | N | Y | N | N | N | N | N | N | N | N | N | N |
| ST10129 | 1 | 20 | 9 | 11 | 0 | 0 | Y | N | Y | N | N | N | N | N | N | N | Y | N | N |
| ST8468 | 2 | 1 | 0 | 1 | 0 | 0 | Y | N | N | N | N | Y | N | N | Y | N | N | N | N |
| ST225 | 2 | 1 | 1 | 0 | 0 | 0 | Y | N | N | Y | N | Y | N | N | N | N | N | N | N |
| ST10866 | 2 | 1 | 1 | 0 | 0 | 0 | N | N | N | N | N | Y | N | N | N | N | N | N | N |
| ST2318 | 2 | 4 | 3 | 1 | 0 | 0 | Y | N | N | Y | Y | Y | N | N | N | N | N | N | N |
| ST11089 | 2 | 1 | 1 | 0 | 0 | 0 | Y | N | Y | N | N | N | N | N | N | N | N | N | N |
| ST11837 | 2 | 1 | 0 | 1 | 0 | 0 | Y | N | N | Y | N | Y | Y | N | N | N | N | N | N |
| ST11299 | 2 | 18 | 9 | 9 | 0 | 0 | Y | N | N | Y | N | Y | Y | N | N | N | N | N | N |
| ST8695 | 2 | 2 | 0 | 0 | 2 | 0 | Y | N | N | Y | N | Y | N | N | N | N | N | N | N |
| ST9523 | n/a | 1 | 1 | 0 | 0 | 0 | N | N | N | N | N | N | N | Y | N | N | N | Y | N |
| ST11859 | 3 | 1 | 1 | 0 | 0 | 0 | N | N | Y | N | N | N | N | N | N | N | N | N | N |
| ST4637 | 3 | 9 | 0 | 9 | 0 | 0 | N | N | Y | N | N | N | N | N | N | N | N | N | N |
| ST11472 | 3 | 1 | 0 | 1 | 0 | 0 | N | N | Y | N | N | N | N | N | N | N | N | N | N |
| ST1037 | 3 | 1 | 0 | 1 | 0 | 0 | N | N | Y | N | N | N | N | N | N | N | N | N | N |
| ST51 | 3 | 4 | 0 | 4 | 0 | 0 | N | N | Y | N | N | N | N | N | N | N | N | N | N |
| ST25 | 3 | 3 | 0 | 3 | 0 | 0 | N | N | Y | N | N | N | N | N | N | N | N | N | N |
| ST11698 | 3 | 1 | 0 | 1 | 0 | 0 | N | N | Y | N | N | N | N | N | N | N | N | N | N |
| ST11467 | 4 | 1 | 1 | 0 | 0 | 0 | N | N | N | N | N | Y | N | N | Y | N | N | N | N |
| ST9999 | 4 | 9 | 0 | 9 | 0 | 0 | N | N | N | N | Y | Y | N | N | Y | N | Y | N | N |
| ST10515 | 4 | 1 | 0 | 1 | 0 | 0 | N | N | N | N | N | N | N | N | Y | N | N | N | N |
| ST3307 | 5 | 1 | 0 | 0 | 1 | 0 | N | N | N | Y | N | Y | N | Y | N | N | N | N | N |
| ST8684 | 5 | 1 | 0 | 0 | 1 | 0 | Y | N | N | Y | N | Y | N | N | N | N | N | N | N |
| ST11095 | 6 | 1 | 1 | 0 | 0 | 0 | N | N | N | N | N | Y | N | Y | N | N | Y | Y | N |
| ST2083 | 6 | 1 | 0 | 1 | 0 | 0 | N | N | N | Y | N | Y | N | N | N | N | N | Y | N |
| ST11474 | 7 | 1 | 1 | 0 | 0 | 0 | N | N | N | Y | N | Y | N | N | N | N | N | N | N |
| ST7554 | 7 | 1 | 0 | 0 | 1 | 0 | N | N | N | N | N | Y | Y | N | Y | N | N | N | Y |
| ST11541 | 7 | 1 | 1 | 0 | 0 | 0 | N | N | N | N | Y | Y | Y | N | N | N | N | N | N |
| ST9551 | 7 | 11 | 7 | 4 | 0 | 0 | Y | N | N | N | Y | Y | Y | N | Y | N | N | N | N |
| ST10530 | 8 | 1 | 0 | 1 | 0 | 0 | N | N | Y | N | N | N | N | N | N | N | N | N | N |
| ST3654 | 8 | 2 | 0 | 2 | 0 | 0 | N | N | N | N | N | N | N | N | Y | N | N | N | Y |
| ST11838 | 8 | 1 | 1 | 0 | 0 | 0 | N | N | Y | N | N | N | N | N | N | N | N | N | N |
| ST8016 | n/a | 1 | 1 | 0 | 0 | 0 | Y | N | N | N | N | Y | N | N | Y | N | N | Y | N |
| ST10587 | n/a | 1 | 0 | 1 | 0 | 0 | Y | N | N | N | N | N | N | N | Y | N | N | N | N |
| ST9663 | n/a | 15 | 2 | 8 | 5 | 0 | Y | N | N | N | Y | Y | N | N | Y | N | Y | N | N |
| ST8442 | 15 | 2 | 2 | 0 | 0 | 0 | Y | N | Y | N | N | N | N | N | N | N | N | N | N |
| ST10941 | 15 | 1 | 1 | 0 | 0 | 0 | Y | N | N | N | N | N | N | N | Y | N | Y | N | N |
| ST5441 | 15 | 2 | 1 | 0 | 1 | 0 | Y | N | Y | N | N | N | N | N | N | N | Y | N | N |
| ST11840 | 13 | 1 | 1 | 0 | 0 | 0 | Y | N | N | N | N | Y | N | N | Y | N | Y | N | N |
| ST11025 | 13 | 1 | 1 | 0 | 0 | 0 | N | N | N | N | N | N | N | N | Y | N | N | N | N |
| ST6765 | n/a | 1 | 0 | 1 | 0 | 0 | Y | N | N | N | Y | N | N | N | N | Y | N | N | N |
| ST3935 | n/a | 3 | 2 | 1 | 0 | 0 | N | N | N | N | N | N | N | N | Y | N | Y | N | N |
| ST5366 | n/a | 2 | 0 | 2 | 0 | 0 | N | N | N | N | N | N | N | N | Y | N | Y | N | N |
| ST10132 | n/a | 8 | 4 | 4 | 0 | 0 | Y | N | N | N | Y | Y | N | N | Y | Y | N | N | N |
| ST1407 | 16 | 3 | 1 | 2 | 0 | 0 | Y | N | N | Y | N | Y | N | N | N | N | N | N | N |
| ST10451 | 16 | 1 | 0 | 1 | 0 | 0 | N | N | N | Y | N | Y | N | N | N | Y | N | N | N |
| ST8987 | 16 | 2 | 1 | 1 | 0 | 0 | Y | N | N | Y | N | Y | N | N | N | N | N | N | N |
| ST3149 | 16 | 1 | 0 | 1 | 0 | 0 | Y | N | N | N | N | Y | N | N | N | N | N | N | N |
| ST10586 | 16 | 1 | 0 | 1 | 0 | 0 | Y | N | N | N | Y | Y | N | N | N | N | N | N | N |
| ST4120 | 16 | 1 | 1 | 0 | 0 | 0 | Y | N | N | Y | N | Y | N | N | N | N | N | N | N |
| ST6899 | 16 | 1 | 1 | 0 | 0 | 0 | Y | N | N | Y | N | Y | N | N | N | N | N | N | N |
| ST11086 | n/a | 1 | 1 | 0 | 0 | 0 | Y | N | N | Y | N | Y | N | N | N | N | N | N | N |
| ST1195 | n/a | 3 | 2 | 1 | 0 | 0 | Y | N | N | N | N | N | N | N | Y | N | N | N | N |
| ST359 | 12 | 1 | 0 | 0 | 0 | 1 | Y | N | N | N | N | N | N | N | Y | N | N | N | N |
| ST10567 | 12 | 2 | 0 | 2 | 0 | 0 | Y | N | N | N | N | N | N | N | Y | Y | Y | N | N |
| ST9012 | 14 | 2 | 1 | 1 | 0 | 0 | Y | N | Y | N | N | N | N | N | Y | N | N | N | N |
| ST4684 | 14 | 4 | 2 | 0 | 0 | 2 | Y | N | N | N | Y | N | N | N | Y | N | Y | N | N |
| ST11839 | 14 | 1 | 0 | 1 | 0 | 0 | Y | N | Y | N | N | N | N | N | N | N | N | N | N |
| ST6955 | 14 | 1 | 0 | 0 | 1 | 0 | N | N | Y | N | N | N | N | N | N | N | N | N | N |
| ST2992 | 14 | 8 | 4 | 2 | 2 | 0 | Y | N | Y | N | N | N | N | N | Y | N | Y | N | N |
| ST11091 | 14 | 1 | 1 | 0 | 0 | 0 | N | N | N | N | N | Y | N | N | N | N | N | N | N |
| ST10531 | 14 | 3 | 0 | 3 | 0 | 0 | Y | N | N | N | N | N | N | Y | N | N | N | N | N |
| ST11303 | 17 | 1 | 0 | 1 | 0 | 0 | Y | N | N | N | N | Y | N | N | Y | N | Y | N | N |
| ST11087 | 17 | 5 | 0 | 5 | 0 | 0 | Y | N | N | N | N | Y | N | N | Y | N | Y | N | N |
| ST11093 | n/a | 1 | 1 | 0 | 0 | 0 | Y | N | N | N | N | N | N | N | Y | N | Y | N | N |
| ST11422 | 19 | 1 | 0 | 1 | 0 | 0 | Y | N | N | N | N | N | N | N | Y | N | N | N | N |
| ST11094 | 19 | 1 | 1 | 0 | 0 | 0 | N | N | N | N | N | N | N | Y | N | N | N | N | N |
| ST5444 | 21 | 2 | 2 | 0 | 0 | 0 | Y | N | N | N | N | N | N | N | Y | N | N | N | N |
| ST5268 | 21 | 2 | 2 | 0 | 0 | 0 | Y | N | N | Y | N | N | N | N | N | N | Y | Y | N |
| ST11466 | n/a | 1 | 1 | 0 | 0 | 0 | Y | N | N | N | N | N | N | N | Y | N | N | N | N |
| ST4186 | n/a | 1 | 1 | 0 | 0 | 0 | Y | N | Y | N | N | N | N | N | N | N | N | N | N |
| ST11088 | 23 | 1 | 1 | 0 | 0 | 0 | N | N | Y | N | N | N | N | N | N | N | N | N | N |
| ST11810 | 23 | 1 | 0 | 1 | 0 | 0 | Y | N | N | N | N | N | N | N | Y | N | N | N | N |
| ST7638 | 23 | 7 | 3 | 4 | 0 | 0 | N | N | Y | N | N | N | N | N | Y | N | N | N | N |
| ST8639 | 9 | 1 | 0 | 0 | 1 | 0 | Y | N | N | Y | N | Y | N | N | N | N | N | N | N |
| ST10865 | 9 | 1 | 1 | 0 | 0 | 0 | Y | N | N | N | Y | Y | N | N | N | N | N | N | N |
| ST2400 | 9 | 8 | 7 | 1 | 0 | 0 | Y | N | N | Y | Y | Y | N | N | Y | N | Y | N | N |
| ST10128 | 9 | 2 | 0 | 2 | 0 | 0 | Y | N | N | N | Y | Y | N | N | Y | Y | Y | N | N |
| ST11092 | 10 | 1 | 1 | 0 | 0 | 0 | N | N | N | N | N | Y | N | Y | N | N | N | Y | N |
| ST1739 | 10 | 1 | 1 | 0 | 0 | 0 | N | N | N | N | N | Y | N | N | Y | N | N | Y | N |
| ST185 | n/a | 1 | 0 | 1 | 0 | 0 | N | N | N | N | Y | N | N | N | N | N | N | N | N |
| ST5 | n/a | 2 | 1 | 0 | 1 | 0 | Y | N | N | Y | N | N | N | N | N | N | N | N | N |
| ST6734 | n/a | 4 | 3 | 1 | 0 | 0 | Y | N | N | N | N | Y | N | N | N | N | N | N | N |
| ST10421 | n/a | 1 | 1 | 0 | 0 | 0 | Y | N | N | N | N | Y | N | Y | N | N | N | N | N |
| ST7440 | 22 | 1 | 1 | 0 | 0 | 0 | Y | N | N | N | N | N | N | N | N | N | Y | N | N |
| ST11841 | 22 | 1 | 1 | 0 | 0 | 0 | Y | N | N | N | N | N | N | Y | N | N | N | N | N |
| ST11544 | 22 | 1 | 0 | 1 | 0 | 0 | Y | N | N | N | N | N | N | Y | N | N | N | N | N |
| ST5985 | 22 | 42 | 22 | 19 | 1 | 0 | Y | N | N | N | N | N | N | Y | N | N | N | N | N |
| ST10131 | 22 | 1 | 1 | 0 | 0 | 0 | Y | N | N | N | N | N | N | Y | N | N | N | N | N |
| ST11348 | 22 | 1 | 1 | 0 | 0 | 0 | Y | N | N | N | N | N | N | Y | N | N | N | N | N |
| ST9665 | 20 | 1 | 1 | 0 | 0 | 0 | Y | N | N | N | N | Y | N | Y | N | N | N | Y | N |
| ST11543 | 20 | 1 | 0 | 1 | 0 | 0 | Y | N | N | N | N | Y | N | Y | N | N | Y | N | N |
| ST10838 | 18 | 7 | 3 | 3 | 1 | 0 | N | N | Y | N | N | N | N | N | N | N | N | N | N |
| ST10589 | 18 | 1 | 0 | 1 | 0 | 0 | N | N | Y | N | N | N | N | N | N | N | N | N | N |
| ST3556 | 18 | 4 | 0 | 4 | 0 | 0 | Y | N | Y | N | N | Y | N | N | N | N | N | N | N |
| ST11542 | 18 | 1 | 0 | 1 | 0 | 0 | N | N | Y | N | N | N | N | N | N | N | N | N | N |
| ST8150 | 18 | 2 | 0 | 0 | 0 | 2 | N | N | Y | N | N | N | N | N | N | N | N | N | N |
| ST10516 | 18 | 1 | 0 | 0 | 0 | 1 | N | N | Y | N | N | N | N | N | N | N | N | N | N |
| ST10588 | 18 | 4 | 3 | 1 | 0 | 0 | N | N | Y | N | N | N | N | N | Y | N | N | N | N |
| ST2 | 18 | 2 | 1 | 1 | 0 | 0 | N | N | Y | N | N | N | N | N | Y | N | N | N | N |
| ST10593 | 11 | 3 | 0 | 0 | 0 | 3 | Y | N | N | Y | N | N | N | N | N | N | N | N | N |
| ST11337 | 11 | 3 | 0 | 0 | 0 | 3 | Y | N | N | Y | Y | N | N | N | N | N | N | N | N |
| ST5445 | 11 | 3 | 3 | 0 | 0 | 0 | Y | N | N | Y | N | N | N | N | N | N | N | N | N |
| ST1034 | 11 | 3 | 1 | 0 | 2 | 0 | Y | N | N | Y | N | N | N | N | N | N | N | N | N |
| ST9766 | 11 | 1 | 1 | 0 | 0 | 0 | N | N | N | N | Y | N | N | N | N | N | N | N | N |
| ST11760 | 11 | 1 | 0 | 0 | 0 | 1 | Y | N | N | N | N | N | N | Y | N | N | N | N | N |
| ST21 | 11 | 4 | 4 | 0 | 0 | 0 | Y | N | N | Y | N | N | N | N | N | N | N | N | N |
| ST8502 | 11 | 6 | 3 | 3 | 0 | 0 | Y | N | N | Y | N | N | N | N | N | N | N | N | N |
| ST9851 | 11 | 1 | 0 | 1 | 0 | 0 | Y | N | N | Y | N | N | N | N | N | N | N | N | N |
Figure 2 table notes
|
|||||||||||||||||||
3.7 Sequence Typing (ST)
NG-MAST of 334 isolates identified 114 sequence types, of which 96.5% (n=110) were subjected to cluster analysis, which revealed 23 clusters of two to 47 isolates (Figure 2) each. The three most prevalent sequence types were ST5985 at 9.2% (n=42) within Cluster 22, ST10129 at 4.4% (n=20) within Cluster 1, and ST11299 at 3.9% (n=18).
- Cluster 1 (n=21)consisted predominately of susceptible isolates with ST11302 and ST10129 as the two most (n=20) prevalent sequence types. Detailed analysis revealed that all these isolates were from MSM in Alberta.
- Cluster2 (n=29) had eight different sequence types, including ST11299 (n=18), the third most prevalent ST in this study. Isolates from Calgary, Edmonton and Winnipeg were identified in this cluster with 86.2% (n=25) from MSM. Most of the isolates in this cluster were CMRNG/CipR with three isolates also having decreased susceptibility to cephalosporins.
- Cluster 7 (n=14) had four different sequence types, including ST9551 (n=11). Isolates in this cluster were primarily from non-MSM in Alberta. All 14 isolates were resistant to ciprofloxacin with 13 of them also having decreased susceptibility to cephalosporins. Resistance to a combination of tetracycline, penicillin and erythromycin was found in nine of the isolates.
- Cluster 9 (n=12) consisted of four sequence types, including ST2400 (n=8), which was the most prevalent ST in Canada in 2014. All isolates in this cluster were from MSM from Alberta and Winnipeg and were primarily CMRNG/CipR or Probable CMRNG/CipR. The two isolates identified as ST10128 were also resistant to azithromycin.
- Cluster 11(n=25) had nine different sequence types and were found in all four jurisdictions, mostly from MSM, but with some non-MSM as well. All isolates except one were either CMRNG or Probable CMRNG. There was no ciprofloxacin resistance in this cluster.
- Cluster 16 (n=10) had seven sequence types, including ST1407 (an internationally recognized high-level cephalosporin resistant clone) and ST10451(third most prevalent across Canada in 2014). Isolates in this cluster were primarily CMRNG/CipR from MSM in Alberta.
- There were six sequence types inCluster22 (n=47) including ST5985(n=42), the most prevalent sequence type in this study and the second most prevalent in Canada in 2014 (14). All but one of the isolates in this cluster were TRNG from MSM patients from Alberta. The two sequence types of Cluster 20 (n=2) were closely related to those in Cluster 22. They were also from MSM and were TRNG, but they were both resistant to other antibiotics as well.
Four sequence types were not included in the cluster analysis because they were outliers. These were ST3613 (n=1), ST3671 (n=5), ST7414 (n=2) and ST5624 (n=1).
Geographical consideration
Clusters that were unique to Calgary include Cluster 10 (n=2), Cluster 13 (n=2) and Cluster 21 (n=4). There was only one cluster unique to Edmonton in this study, Cluster 17 (n=6), which had only two STs with isolates from MSM cases. Winnipeg had isolates in nine clusters (Figure 2). Cluster 5 consisted of two STs (ST3307 and ST8684), which were unique to Winnipeg in ESAG. There were no clusters that were unique to Halifax in this study.
3.8 Treatment
Treatment information was available for 72.8% (n=334) of the gonorrhoea positive patients included in the study. For the treatment of anogenital infections, participating ESAG sites prescribed the preferred treatment options as described in the Canadian Guidelines for Sexually Transmitted Infections (3) about 79.3% (n=151) of the time, compared to 90.9% (n=80) for pharyngeal infections (Table 7). There was no significant difference (p>0.05) in the proportions of MSM patients (79.8%) and non-MSM patients (79.8%) that received preferred treatment therapy. For pharyngeal infections, MSM patients were prescribed preferred treatment regimen (Table 7) most of the time (94.5%; n=69) compared (p<0.05) to non-MSM patients (73.3%; n=11).
| MSM patients | Non-MSMtable 7 note i patients | Overall | ||||
|---|---|---|---|---|---|---|
| Treatment | Cases | Treatment | Cases | |||
| Anogenital infectionstable 7 note h | Preferred therapy | Ceftriaxone 250mg + azithromycin 1g | 112 (45.5%) | Ceftriaxone 250mg + azithromycin 1g | 39 (15.9%) | 151 (61.4%) |
| Preferred therapy | n/a | 0 (0.0%) | Cefixime 800mg + azithromycin 1g | 44 (17.9%) | 44 (17.9%) | |
| Alternative therapy |
|
11 (4.5%) |
|
5 (2.0%) | 16 (6.5%) | |
| Other combination therapytable 7 note j | n/a | 11 (4.5%) | n/a | 10 (4.1%) | 21 (8.5%) | |
| Monotherapytable 7 note k | n/a | 5 (2.0%) | n/a | 2 (0.8%) | 7 (2.8%) | |
| No treatment information | n/a | 3 (1.2%) | n/a | 4 (1.6%) | 7 (2.8%) | |
| Subtotal | n/a | 142 (57.7%) | n/a | 104 (42.3%) | 246 (100%) | |
| Pharyngeal infections | Preferred therapy | Ceftriaxone 250mg + azithromycin 1g | 69 (78.4%) | Ceftriaxone 250mg + azithromycin 1g | 11 (12.5%) | 80 (90.9%) |
| Alternative therapy | n/a | 0 (0.0%) |
|
2 (2.3%) | 2 (2.3%) | |
| Other combination therapytable 7 note j | n/a | 2 (2.3%) | n/a | 1 (1.1%) | 3 (3.4%) | |
| Monotherapytable 7 note k | n/a | 1 (1.1%) | n/a | 0 (0.0%) | 1 (1.1%) | |
| No treatment information | n/a | 1 (1.1%) | n/a | 1 (1.1%) | 2 (2.3%) | |
| Subtotal | n/a | 73 (83.0%) | n/a | 15 (17.0%) | 88 (100%) | |
Table 7 Notes
|
||||||
4.0 Discussion
As a result of the ESAG initiative, partner laboratories submitted increased numbers of gonorrhea isolates to enable improved analysis and information. In 2013, there were 124 cultures from the two sites that were a part of ESAG. In 2014, these same two sites submitted 346 cultures, and two new sites began participation and submitted an additional 39 cultures. The likelihood that these cultures could have been captured by routine laboratory surveillance by NML cannot be ruled out; however, ESAG allows for capture of additional epidemiological information to better explain the results.
Over 80% of cases captured in ESAG were male. This is consistent with historical data, which show that in 2013, 60% of reported gonorrhea cases in Canada were among malesReference 1. This could suggest that males, especially men who have sex with men, were overrepresented in ESAG because MSM are more likely to be asked for a specimen for culture in accordance with the Canadian Guidelines on Sexually Transmitted Infections.
On average, female ESAG cases were younger than their male counterparts across all four jurisdictions. National rates of reported cases of gonorrhea in 2014 were higher among females than males in those less than 20 years of age; in contrast, among adults age 20 and older, males exhibited higher ratesReference 1. Although ESAG data seemed to follow these trends, the sample size did not allow for analyses by both age group and sex.
Approximately half of ESAG cases who provided specimens for culture sought health care due to symptoms, which would be consistent with the Canadian Guidelines on Sexually Transmitted Infections' recommendation for obtaining cultures from symptomatic MSM including the overwhelming majority of males who did not have sex with men. However, among MSM, approximately one third reported being a case contact or STI screening as the reason for their visit. The two most common reasons for females seeking treatment were the presence of symptoms and being a case contact; however, this varied across sentinel sites and because the number of female cases in ESAG was low, it was difficult to detect a consistent pattern.
The proportion of isolates with decreased susceptibility to cefixime in all ESAG jurisdictions combined was higher (3.5%) than the national proportion of 1.1%, while the proportion of isolates with decreased susceptibility to ceftriaxone in the combined ESAG jurisdictions was lower (1.5%) than the national proportion (2.7%). The percentage of azithromycin resistance in isolates from the combined ESAG jurisdictions was also lower (1.5%) than the national percentage (14) of azithromycin resistance (3.3%). The proportion of penicillin resistance in the combined ESAG jurisdictions (17.4%) was similar to the national proportion (18.2%). This trend was also found with tetracycline resistance where the overall ESAG jurisdictions percentage was 49.9% compared to the national percentage of 47.3%. Erythromycin resistance in the ESAG jurisdictions was slightly lower (25.7%) than nationally (32.0%). The percentage of isolates with resistance to ciprofloxacin was also slightly lower in the combined ESAG jurisdictions (27.5%) comparedReference 14 to the national percentage (34.0%). These trends could be explained by variability of decreased susceptibility/resistance among different provinces/territories in Canada, limited geographic representation in ESAG and information on ongoing basis and improved representation is needed to suggest any changes in treatment.
ST5985 was the most prevalent ST identified in ESAG at 12.0%. Nationally, ST5985 was first identified in Ontario in 2010, as reported in the National Surveillance of Antimicrobial Susceptibilities of Neisseria gonorrhoeae Annual Summary 2014Reference 14. It increased in prevalence from 0.6% in 2012 to 6.1% in 2013 and then to 14.0% (294/2,101) in 2014Reference 14. Over 99% of ST5985 isolates were TRNGs and national distribution was as follows: British Columbia, 60.2% (177/294); Ontario, 21.4% (63/294); Alberta, 14.6% (43/294); Saskatchewan 3.4%, (10/294); and Winnipeg 0.3% (1/294). Sexual behaviour information for the national data was not available, but 94.9% (279/294) of ST5985 were from males and 33.3% (98/294) were male rectal isolates.
Isolates of Cluster 7 are of interest due to their decreased susceptibility to cefixime and ceftriaxone, along with resistance to other antibiotics. The STs in this cluster were identified primarily in the Calgary and Edmonton sites and included both genders, primarily non-MSM, and an isolate from a case involved in sex work. Nationally, Cluster 7 isolates have been identified in Canada since 2013 with Alberta being the primary source of isolates in 2013 (57.1%, 4/7) and 2014 (87.7%, 13/15).
The majority of cases at the four participating sites were prescribed either preferred or alternative therapies as currently proposed by the Canadian Guidelines on Sexually Transmitted InfectionsReference 3. This high degree of consistency is likely due to the familiarity of the clinicians at STI clinics with the Canadian Guidelines on Sexually Transmitted Infections and may not necessarily be indicative of general practitioners' prescribing behaviours. General front line clinicians may also not have access to IM ceftriaxone and defer to the oral cefixime even in pharyngeal cases. Because dosage information was not available for some cases, it is possible that adherence to recommended therapies may have been even higher than presented at the ESAG sentinel sites. A large number of other combination therapies were comprised of cases where a preferred therapy appeared to be provided without dosage information, or in combination with another drug. No treatment failure cases were identified for the ESAG cases in 2014.
4.1 Limitations
Results from the ESAG pilot are not representative of all gonorrhea cases or culture-confirmed gonorrhea cases in Canada. Similarly, sentinel sites may not be representative of their jurisdiction. In Alberta, the two STI clinics in Edmonton and Calgary participated in ESAG. In Winnipeg, a physician from each of the five participating facilities was recruited to increase the number of cultures collected for gonorrhea; however, only three clinics provided positive cultures as part of ESAG. In Nova Scotia, three sentinel clinics participated in ESAG, but most cases came from one STI clinic. In addition to limited geographic representation, ESAG cases may be over-represented by men who have sex with men. Because the majority of cases in ESAG were from Alberta, any aggregated results should be interpreted with caution. Moreover, the small number of ESAG cases in Winnipeg and Halifax made some data difficult to interpret. The number of female cases was so small in some jurisdictions that not only were the data difficult to interpret, but some of these data would usually be suppressed due to small sample size.
The ESAG protocol stated that only half of the susceptible isolates from Alberta would be included in ESAG Alberta sites but additional request was made to collect a number of susceptible specimens collected during the second half of the month to facilitate resistance calculations. Additional data on selected demographic characteristics are being collected on susceptible specimens collected during second half of the month in Alberta and additional results will be presented in subsequent publications.
The completion rate of some variables was low and/or limited to certain sentinel sites and this is another reason these results would not likely reflect the overall Canadian context. In addition, some of the variables rely on self-reported data, which may not be accurate and could result in under- or over-reporting.
All of the isolates from ESAG cases were from swabs taken during initial visits. There were no follow-up visits among the 334 cases captured by ESAG. No known treatment failures were reported in any of the four participating jurisdictions. However, people may not have returned for test of cure or may not have returned to a participating clinic/physician for follow-up. Because detailed clinical information was not collected in ESAG, such as allergies or contraindications, it was not possible to definitively determine why the preferred or alternative treatment was not prescribed. Test of cures and treatment failures can be difficult to measure using surveillance data because they rely on the ability to detect negative results. Furthermore, people may not return to the same clinic for their test of cure, if they return at all.
4.2 Conclusion
Enhanced Surveillance of Antimicrobial-Resistant Gonorrhea (ESAG) has provided additional information to supplement the laboratory-based passive surveillance of antimicrobial resistant gonorrhea. The ESAG pilot has the potential to generate some useful integrated epidemiological and laboratory data describing the risk behaviours, clinical information, and antimicrobial susceptibility rates of gonococcal disease that would have otherwise not been available nationally. This pilot project determined that it is possible to conduct surveillance of GC-AMR at sentinel sites across Canada by integrating existing local/ provincial/ territorial surveillance. However, the number of sites able to collect such data remains limited and therefore the resulting improvement of the national representativeness of antimicrobial resistant gonorrhea surveillance also remains limited.
Pilot projects are not without their challenges, but they are important in determining the strengths and weaknesses of surveillance systems in order to refine the study design prior to further implementation. Potential areas of improvement were identified through the pilot and discussions with current and potential sentinel sites about these recommendations are underway. Jurisdictions across Canada have indicated the importance of having better data on antimicrobial resistant gonorrhea and the value of the Enhanced Surveillance of Antimicrobial-Resistant Gonorrhea. As Canada deals with increasing cases of gonorrhea and the continued emergence of drug resistance, additional ESAG sites would allow the collection of more representative data which in turn would be more useful for informing treatment guidelines, clinical practice, and public health interventions.
References
- Reference 1
-
Public Health Agency of Canada. Notifiable Diseases On-Line. Centre for Communicable Diseases and Infection Control, Infectious Disease Prevention and Control Branch, Public Health Agency of Canada; 2016.
- Reference 2
-
Barry PM, Klausner JD. The use of cephalosporins for gonorrhoea: The impending problem of resistance. Expert Opin Pharmacother 2009;10:555-577.
- Reference 3
-
Public Health Agency of Canada. Canadian Guidelines on Sexually Transmitted Infections, Gonococcal Infections: Revised July 2013. [cited 22 July 2014]. http://www.phac-aspc.gc.ca/std-mts/sti-its/index-eng.php.
- Reference 4
-
World Health Organization. Global action plan to control the spread and impact of antimicrobial resistance in Neisseria gonorrhoeae. [cited 12 June 2012]. http://www.who.int/reproductivehealth/publications/rtis/9789241503501/en/.
- Reference 5
-
Centers for Disease Control and Prevention. Antibiotic Resistance Threats in the United States, 2013.
- Reference 6
-
Public Health Agency of Canada. Case definitions for communicable diseases under national surveillance. Canada Communicable Disease Report 2009;3552: June 6, 2016.
- Reference 7
-
Clinical and Laboratory Standards Institute. Performance standards for antimicrobial susceptibility testing. Twenty-fifth informational supplement. CLSI document, approved Standard M100-S25. Wayne, PA: Clinical and Laboratory Standards Institute; 2015.
- Reference 8
-
Centers for Disease Control and Prevention. Sexually Transmitted Disease Surveillance 2007 Supplement, Gonococcal Isolate Surveillance Project (GISP) Annual Report 2007. Atlanta, GA. [cited 30 November 2010]. http://www.cdc.gov/std/gisp2007/gispsurvsupp2007short.pdf
- Reference 9
-
Martin IMC, Ison CA, Aanensen DM, Fenton KA, and Spratt BG. 2004. Rapid sequence-based identification of gonococcal transmission clusters in a large metropolitan area. J. Infect. Dis. 189: 1497-1505
- Reference 10
-
Larkin MA, Blackshields G, Brown NP, Chenna R, McGettigan PA, McWilliam H, Valentin F, Wallace IM, Wilm A, Lopez R, Thompson JD, Gibson TJ, Higgins DG. ClustalW and ClustalX version 2. Bioinformatics 2000;23(21):2947-2948.
- Reference 11
-
Guindon S, Dufayard, JF, Lefort V, Anisimova M, Hordijk W, Gascuel O. New algorithms and methods to estimate maximum-likelihood phylogenies: Assessing the performance of PhyML 3.0. Syst Biol 2010;59:307-321.
- Reference 12
-
Rambaut A. Molecular Evolution, phylogenetics and epidemiology. FigTree v1.4.2. 2014. http://tree.bio.ed.ac.uk/software/figtree/
- Reference 13
-
Ragonnet-Cronin M, Hodcroft E, Hué S, Fearnhill E, Delpech V, Brown AJL, Lycett S. 2013. Automated analysis of phylogenetic clusters. BMC Bioinformatics. 14:317.
- Reference 14
-
Public Health Agency of Canada, National Microbiology Laboratory. 2015. National Surveillance of Antimicrobial Susceptibilities of Neisseria gonorrhoeae Annual Summary 2014.
Appendix A
| Antibiotic | Recommended Testing Concentration Ranges (mg/L) | MIC Interpretive Standard (mg/L)Footnote l | Sources of Antibiotics | |||
|---|---|---|---|---|---|---|
| S | DS | I | R | |||
| Penicillin | 0.032 - 128.0 | ≤ 0.06 | n/a | 0.12 - 1.0 | ≥ 2.0 | Sigma |
| Tetracycline | 0.064 - 64.0 | ≤ 0.25 | n/a | 0.5 - 1.0 | ≥ 2.0 | Sigma |
| Erythromycin | 0.032 - 32.0 | ≤1.0 | n/a | n/a | ≥ 2.0 | Sigma |
| Spectinomycin | 4.0 - 256.0 | ≤ 32.0 | n/a | 64 | ≥ 128.0 | Sigma |
| Ciprofloxacin | 0.001 - 64.0 | ≤ 0.06 | n/a | 0.12 - 0.5 | ≥ 1.0 | Bayer Health Care |
| Ceftriaxone | 0.001 - 2.0 | n/a | ≥ 0.125 | n/a | n/a | Sigma |
| Cefixime | 0.002 - 2.0 | n/a | ≥ 0.25 | n/a | n/a | Sigma |
| Azithromycin | 0.016 - 32.0 | ≤ 1.0 | n/a | n/a | ≥ 2.0 | Pfizer |
| Ertapenem | 0.002 - 2.0 | Interpretive Standards Not Available | Interpretive Standards Not Available | Interpretive Standards Not Available | Interpretive Standards Not Available | Sequoia |
| Gentamicin | 0.5 - 128.0 | Interpretive Standards Not Available | Interpretive Standards Not Available | Interpretive Standards Not Available | Interpretive Standards Not Available | MP Biomedicals |
Appendix A Table Notes
|
||||||
Appendix B
| Characterization | Description | Definition |
|---|---|---|
| PPNG | Penicillinase Producing Neisseria gonorrhoeae | Pen MIC ≥ 2.0 mg/L, β-lactamase positive, β-lactamase plasmid (3.05, 3.2 or 4.5 Mdal plasmid) |
| TRNG | Tetracycline Resistant Neisseria gonorrhoeae | Tet MIC ≥ 16.0 mg/L, 25.2 Mdal plasmid, TetM PCR positive |
| CMRNG | Chromosomal Mediated Resistant Neisseria gonorrhoeae | Pen MIC ≥ 2.0 mg/L, Tet MIC ≥ 2.0 mg/L but ≤ 8.0 mg/L, and Ery MIC ≥ 2.0 mg/L |
| Probable CMRNG | Probable Chromosomal Mediated Resistant Neisseria gonorrhoeae | One of the MIC values of Pen, Tet, Ery = 1 mg/L, the other two ≥ 2.0 mg/L |
| PenR | Penicillin Resistant Neisseria gonorrhoeae | Pen MIC ≥ 2.0 mg/L, β-lactamase negative |
| TetR | Tetracycline Resistant Neisseria gonorrhoeae | Tet MIC ≥ 2.0 mg/L but ≤ 8.0 mg/L |
| EryR | Erythromycin Resistant Neisseria gonorrhoeae | Ery MIC ≥ 2.0 mg/L |
| CipR | Ciprofloxacin Resistant Neisseria gonorrhoeae | Cip MIC ≥ 1.0 mg/L |
| AziR | Azithromycin Resistant Neisseria gonorrhoeae | Az MIC ≥ 2.0 mg/L |
| SpecR | Spectinomycin Resistant Neisseria gonorrhoeae | Spec R ≥ 128 mg/L |
| CxDS | Neisseria gonorrhoeae with decreased susceptibility to Ceftriaxone | Cx MIC ≥ 0.125 mg/L |
| CeDS | Neisseria gonorrhoeae with decreased susceptibility to Cefixime | Ce MIC ≥ 0.25 mg/L |