
Hepatitis B in Canada: 2019 surveillance data
Tell us what you think
Help us improve our products, answer our quick survey.
Download the alternative format
(PDF format, 453 KB, 1 page)
Organization: Public Health Agency of Canada
Published: 2021-07-14
Hepatitis B:
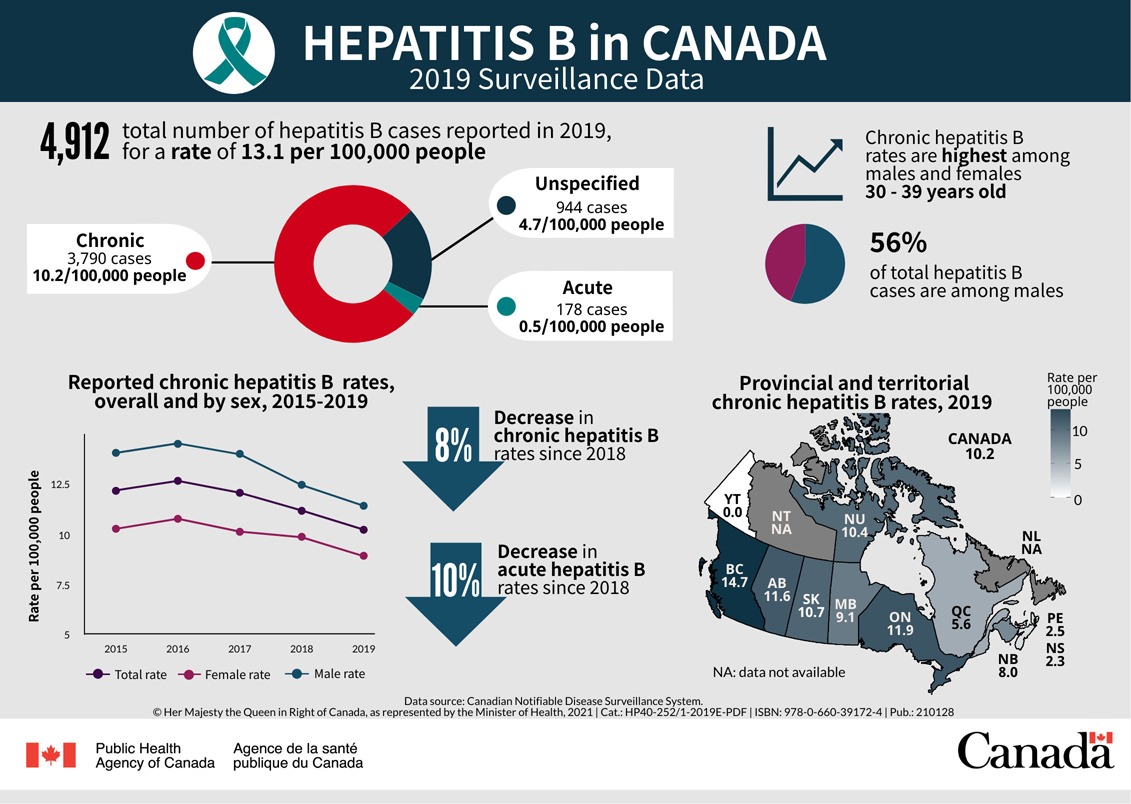
- In 2019, there were 4,912 hepatitis B cases reported for a rate of 13.1 per 100,000 people. Of these, there were:
- 3,790 chronic cases for a rate of 10.2 per 100,000 people
- 178 acute cases for a rate of 0.5 per 100,000 people
- 944 unspecified cases for a rate of 4.7 per 100,000 people
- From 2018 to 2019, the rate of acute hepatitis B decreased by 10%
- From 2018 to 2019, the rate of chronic hepatitis B decreased by 8%
- From 2016 to 2019, the total reported rates of chronic hepatitis B decreased
Hepatitis B by sex and age groups
- In 2019, 56% of reported hepatitis B cases were male
- In 2019, the rate of chronic hepatitis B among females was 8.9 per 100,000 females, and the rate among males was 11.4 per 100,000 males
- In 2019, among males, those aged 30 to 39 had the highest chronic hepatitis B rates
- In 2019, among females, those aged 30 to 39 had the highest chronic hepatitis B rates
- From 2015 to 2019, chronic hepatitis B rates were higher in males than females
- From 2016 to 2019, among males, the total reported rates of chronic hepatitis B decreased
- From 2016 to 2019, among females, the total reported rates of chronic hepatitis B decreased
- From 2018 to 2019, chronic hepatitis B rates decreased by 10% among females and 8% among males
Rate of chronic hepatitis B by province and territory
In 2019, the national rate of chronic hepatitis B was 10.2 per 100,000 people. Provinces and territories that had rates of chronic hepatitis B above the national rate included:
- British Columbia (14.7 per 100,000 people)
- Ontario (11.9 per 100,000 people)
- Alberta (11.6 per 100,000 people)
- Saskatchewan (10.7 per 100,000 people)
- Nunavut (10.4 per 100,000 people)
In 2019, provinces and territories with rates of chronic hepatitis B below the national rate of 10.2 per 100,000 included:
- Manitoba (9.1 per 100,000 people)
- New Brunswick (8.0 per 100,000 people)
- Quebec (5.6 per 100,000 people)
- Prince Edward Island (2.5 per 100,000 people)
- Nova Scotia (2.3 per 100,000 people)
- Yukon (0.0 per 100,000 people)
In 2019, chronic hepatitis B data was not available for Newfoundland and Labrador and the Northwest Territories.
Appendix A: Data tables corresponding to hepatitis B figures
| Hepatitis B infection status | Number of cases | Rate per 100,000 population |
|---|---|---|
| Total | 4,912 | 13.1 |
| Chronic | 3,790 | 10.2 |
| Acute | 178 | 0.5 |
| Unspecified | 944 | 4.7 |
| Year | Total rate per 100,000 population | Male rate per 100,000 population | Female rate per 100,000 population |
|---|---|---|---|
| 2015 | 12.2 | 14.0 | 10.3 |
| 2016 | 12.6 | 14.5 | 10.8 |
| 2017 | 12.1 | 14.0 | 10.1 |
| 2018 | 11.2 | 12.4 | 9.8 |
| 2019 | 10.2 | 11.4 | 8.9 |
| Jurisdiction | Rate per 100,000 population |
|---|---|
| Canada | 10.2 |
| British Columbia | 14.7 |
| Alberta | 11.6 |
| Saskatchewan | 10.7 |
| Manitoba | 9.1 |
| Ontario | 11.9 |
| Quebec | 5.6 |
| Newfoundland and Labrador | N/AFootnote * |
| Prince Edward Island | 2.5 |
| Nova Scotia | 2.3 |
| New Brunswick | 8.0 |
| Yukon | 0.0 |
| Northwest Territories | N/AFootnote * |
| Nunavut | 10.4 |
Footnotes
|
|