
Hepatitis C in Canada: 2021 surveillance data update
Download in PDF format
(320 KB, 1 page)
Organization: Public Health Agency of Canada
Type: Infographic
Date published: 2023-12-20
Impact of the COVID-19 pandemic on reported hepatitis C case counts and rates in 2020 and 2021
The COVID-19 pandemic affected the demand for and access to services related to sexually transmitted and blood-borne infections, including testing. This likely contributed to fewer reported cases of hepatitis C casesFootnote 1. As parts of the country experienced various levels of disruptions due to COVID-19 during 2020 and 2021, comparisons of hepatitis C case counts and rates between the provinces and territories may also be inaccurate.
Hepatitis C
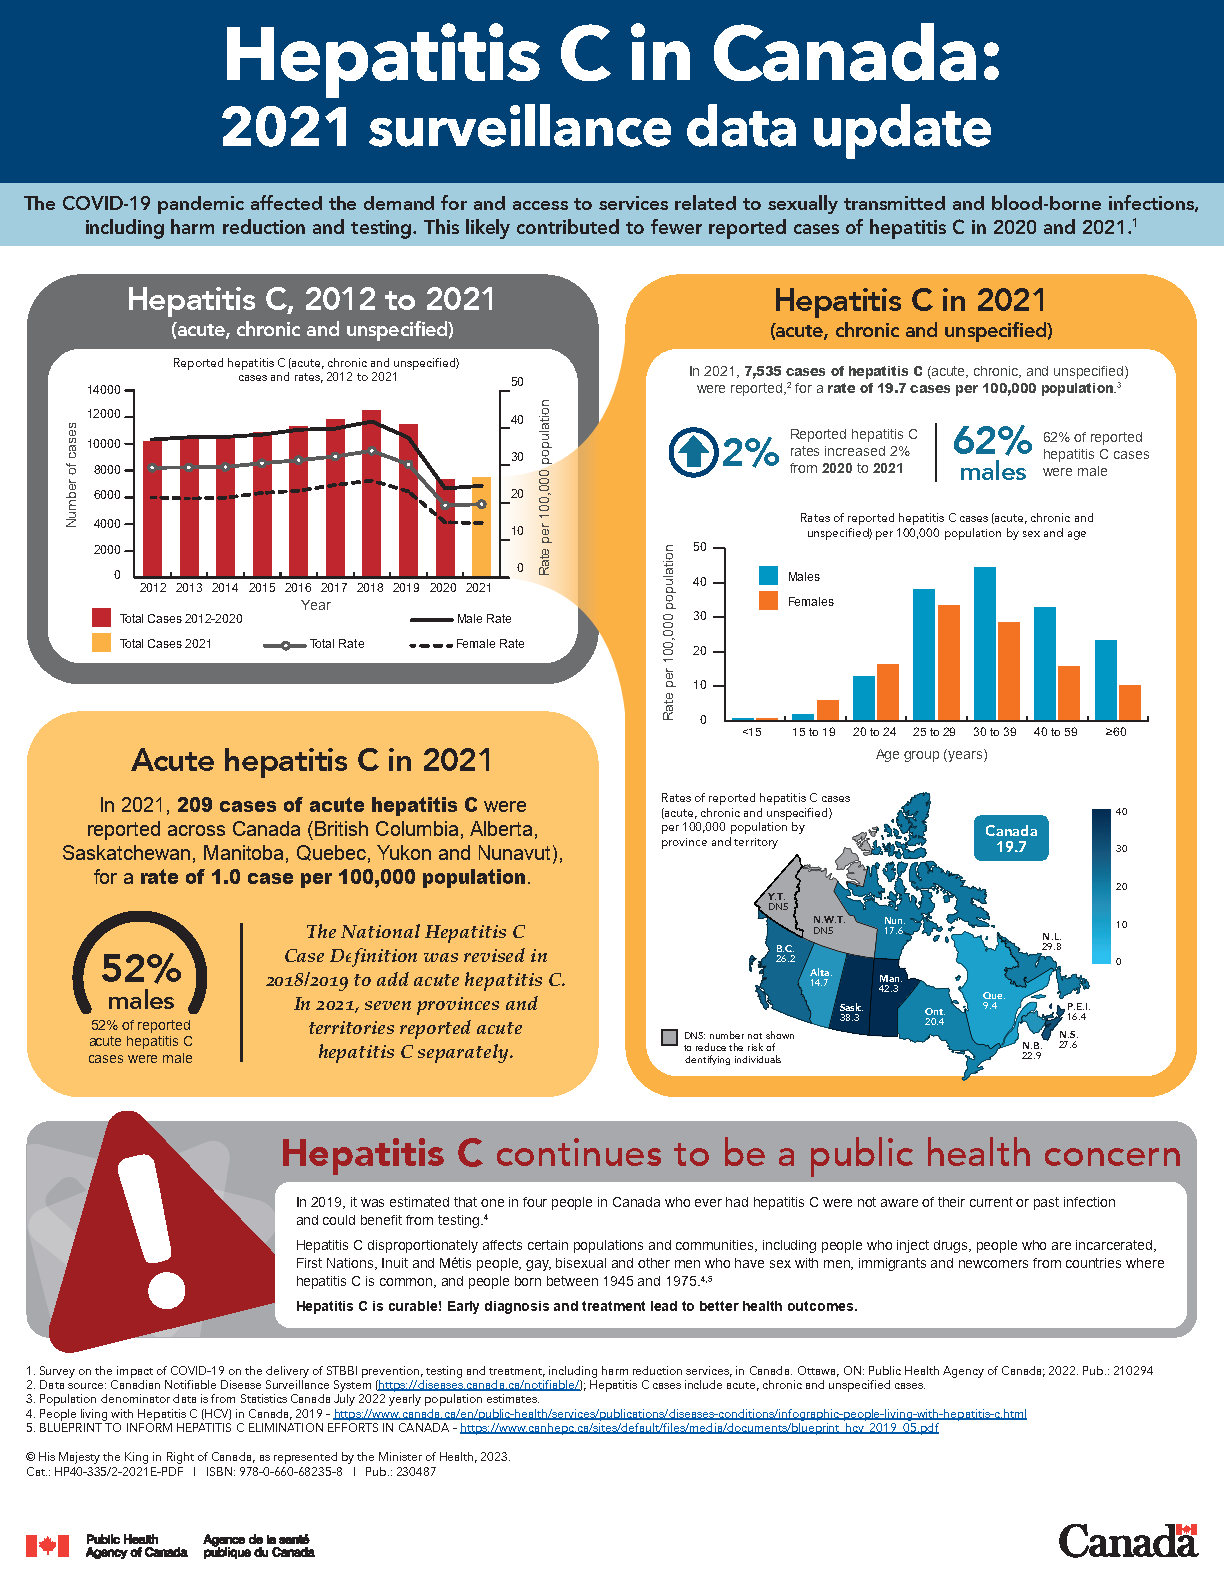
In 2021, 7,535 cases of hepatitis C (acute, chronic and unspecified combined) were reported from all 13 provinces and territories for a rate of 19.7 cases per 100,000 people living in Canada.
- In 2021 (Table 3),
- 209 reported acute cases from sevenFootnote 2 provinces and territories for a rate of 1.0 cases per 100,000 population
- 2,026 reported chronic cases from sixFootnote 3 provinces and territories for a rate of 16.5 cases per 100,000 population
- 5,300 reported unspecified cases from 11Footnote 4 provinces and territories for a rate of 16.1 cases per 100,000 population
Figure 1 shows the number and rates of reported hepatitis C from 2012 to 2021. The trends in this figure are described below:
- From 2012 to 2018, the total reported hepatitis C rates increased by 15.4%
- From 2018 to 2020, the total reported hepatitis C rates had a sharp decline of 42.8%
- From 2020 to 2021, the total reported hepatitis C rates increased slightly by 1.5%
Note: Hepatitis C reporting differed by province and territory from 2012 to 2021. See Table 6 for provincial and territorial hepatitis C reporting patterns.
Reported hepatitis C case counts and rates by age group and sex in Canada
Figure 1 and Table 1 show the number and rates of reported hepatitis C overall and by sex from 2012 to 2021. Table 2 summarizes the number of cases, rates and proportions of hepatitis C by age group and sex reported in 2021. The trends in this figure and in this table are described below:
- In 2021:
- males were overrepresented in all reported hepatitis C, making up 62.1% of all cases
- the rate of reported hepatitis C among males was 24.6 cases per 100,000 males, and the rate among females was 14.7 cases per 100,000 females
- among males, the age group of 30 to 39 years had the highest reported hepatitis C at 44.5 cases per 100,000 males. The largest proportion of cases was reported in the 40 to 59 age group (34.9%)
- among females, the age group of 25 to 29 years had the highest reported hepatitis C at 33.5 cases per 100,000 females. The largest proportion of reported cases was in the 40 to 59 age group (28.0%)
- From 2012 to 2021, rates of reported hepatitis C were higher among males than females
- Among males:
- from 2012 to 2018, the reported hepatitis C rate increased gradually
- from 2018 to 2019, the reported hepatitis C rate decreased by 10.3%
- from 2019 to 2020, the reported hepatitis C rate dropped by 36.2%
- from 2020 to 2021, the reported hepatitis C rate increased slightly
- Among females:
- from 2012 to 2014, the reported hepatitis C rate was stable
- from 2014 to 2018, the reported hepatitis C rate increased
- from 2018 to 2019, the reported hepatitis C rate decreased by 11.3%
- from 2019 to 2020, the reported hepatitis C rate dropped by 35.7%
- from 2020 to 2021, the reported hepatitis C rate was the lowest since 2012 and have remained stable
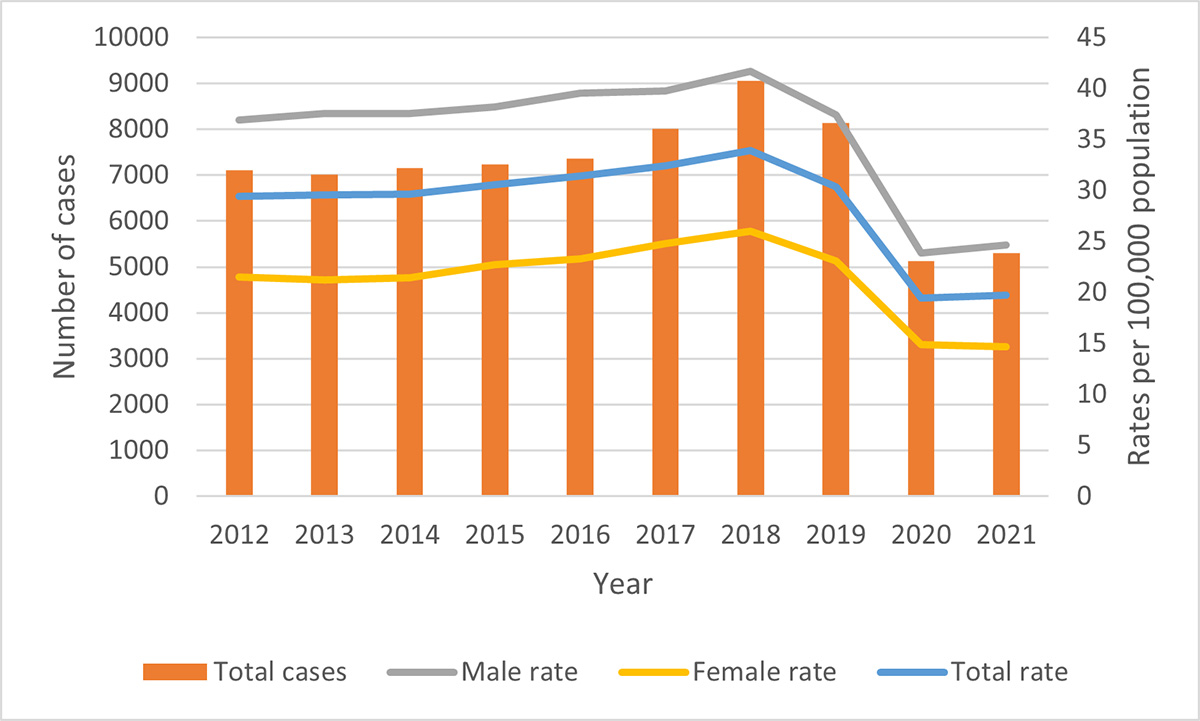
Figure 1 – Text description
| Year | Total cases | Male cases | Female cases | Total rate (per 100,000 population of Canada) |
Male rate (per 100,000 males) |
Female rate (per 100,000 females) |
|---|---|---|---|---|---|---|
| 2012 | 10,205 | 6,345 | 3,767 | 29.4 | 36.9 | 21.5 |
| 2013 | 10,366 | 6,527 | 3,751 | 29.5 | 37.5 | 21.2 |
| 2014 | 10,496 | 6,603 | 3,829 | 29.6 | 37.6 | 21.4 |
| 2015 | 10,920 | 6,767 | 4,088 | 30.6 | 38.2 | 22.7 |
| 2016 | 11,338 | 7,081 | 4,235 | 31.4 | 39.5 | 23.3 |
| 2017 | 11,837 | 7,215 | 4,565 | 32.4 | 39.8 | 24.8 |
| 2018 | 12,572 | 7,671 | 4,856 | 33.9 | 41.7 | 26.0 |
| 2019 | 11,400 | 6,988 | 4,368 | 30.3 | 37.4 | 23.1 |
| 2020 | 7,380 | 4,508 | 2,840 | 19.4 | 23.9 | 14.9 |
| 2021 | 7,535 | 4,683 | 2,825 | 19.7 | 24.6 | 14.7 |
|
National annual hepatitis C rates were calculated using the number of hepatitis C cases (including acute, chronic and unspecified) reported to the Canadian Notifiable Disease Surveillance System as numerators and Statistics Canada July 2022 yearly population estimates as denominators. The "total" case count and rate include all males, females and unspecified sex. Hepatitis C reporting differed by province and territory from 2012 to 2021 (see Table 6 for provincial and territorial hepatitis C reporting patterns). |
||||||
Figure 2 – Text description
| Age group (years) | Males | Females | Total | ||||||
|---|---|---|---|---|---|---|---|---|---|
| Cases (n) | Rate (per 100,000 males) | Proportion of all male cases | Cases (n) | Rate (per 100,000 females) | Proportion of all female cases | Cases (n) | Rate (per 100,000 population) | Proportion of all reported cases | |
| <15 | 21 | 0.7 | 0.4% | 24 | 0.8 | 0.8% | 45 | 0.7 | 0.6% |
| 15 to 19 | 20 | 1.9 | 0.4% | 59 | 5.9 | 2.1% | 79 | 3.8 | 1.0% |
| 20 to 24 | 165 | 12.9 | 3.5% | 191 | 16.3 | 6.8% | 359 | 14.7 | 4.8% |
| 25 to 29 | 520 | 38.1 | 11.1% | 426 | 33.5 | 15.1% | 951 | 36.1 | 12.6% |
| 30 to 39 | 1,206 | 44.5 | 25.8% | 758 | 28.6 | 26.8% | 1,970 | 36.8 | 26.1% |
| 40 to 59 | 1,636 | 32.9 | 34.9% | 792 | 15.7 | 28.0% | 2,434 | 24.3 | 32.3% |
| >60 | 1,065 | 23.4 | 22.7% | 524 | 10.2 | 18.5% | 1,593 | 16.4 | 21.1% |
|
National reported hepatitis C rates by age group and sex in 2021 were calculated using the number of hepatitis C cases reported to the Canadian Notifiable Disease Surveillance System as numerators and Statistics Canada July 2022, 2021 population estimates as denominators. The "total" case count and rate include all males, females and unspecified sex. There were 27 reported hepatitis C cases of unspecified sex reported in 2021. |
|||||||||
Reported hepatitis C case counts and rates by province and territory in Canada
In 2021, the national reported hepatitis C rate was 19.7 cases per 100,000 population. Provinces and territories that had rates of reported hepatitis C above the national rate included:
- Manitoba (42.3 cases per 100,000 population)
- Saskatchewan (38.3 cases per 100,000 population)
- Newfoundland and Labrador (29.8 cases per 100,000 population)Footnote 5
- Nova Scotia (27.6 cases per 100,000 population)Footnote 5
- British Columbia (26.2 cases per 100,000 population)
- New Brunswick (22.9 cases per 100,000 population)Footnote 5
- Ontario (20.4 cases per 100,000 population)
In 2021, provinces and territories with rates of reported hepatitis C below the national rate included:
- Nunavut (17.6 cases per 100,000 population)Footnote 5
- Prince Edward Island (16.4 cases per 100,000 population)Footnote 5
- Yukon (data not shown to reduce the risk of identifying individuals)Footnote 5
- Alberta (14.7 cases per 100,000 population)
- Quebec (9.4 cases per 100,000 population)
- Northwest Territories (data not shown to reduce the risk of identifying individuals)
Caution should be used when comparing rates across provinces and territories. Reported rates of hepatitis C may be inflated in provinces and territories with a relatively small population size. To contextualize rates, it is important to look at the case counts per province and territory (Table 4).
In 2021, Ontario had the greatest proportion of reported hepatitis C cases in Canada (3,019 cases; 40.0%), followed by British Columbia (1,363 cases; 18.1%) and Quebec (805 cases; 10.7%).
Reported acute hepatitis C case counts and rates in Canada
- In 2021:
- 209 cases of acute hepatitis C were reported by seven provinces and territories (British Columbia, Alberta, Saskatchewan, Manitoba, Quebec, Nunavut, and Yukon) for a rate of 1.0 case per 100,000 people living in CanadaFootnote 6
- the age group of 30 to 39 years had the highest reported acute hepatitis C rate at 2.3 cases per 100,000 population followed by the age group of 25 to 29 years at 2.1 cases per 100,000 population
- the largest proportion of reported acute hepatitis C cases was in the age group of 30 to 39 years (32.5%)
Reported acute hepatitis C case counts and rates by age group and sex group in Canada
- In 2021:
- 52.2% of reported acute hepatitis C cases were male
- the rate of reported acute hepatitis C among males was 1.0 cases per 100,000 males and among females was 0.9 cases per 100,000 female
- among males, the age group of 30 to 39 years had the highest reported acute hepatitis C rate at 2.1 cases per 100,000 males and the age group 40 to 59 reported the largest proportion (34.9%)
- among females, the age group of 30 to 39 years had the highest reported acute hepatitis C rate at 2.5 cases per 100,000 females, along with the largest proportion of cases (36.7%)
Hepatitis C public health messaging
Hepatitis C continues to be a public health concern
- In 2019, it was estimated that one in four people in Canada who ever had hepatitis C were not aware of their current or past infection and could benefit from testingFootnote 7
- Hepatitis C disproportionately affects certain populations and communities, including people who inject drugs, people who are incarcerated, First Nations, Inuit and Métis people, gay, bisexual and other men who have sex with men, immigrants and newcomers from countries where hepatitis C is common, and people born between 1945 and 1975Footnote 8
- Hepatitis C is curable
- Early diagnosis and treatment leads to better health outcomes
Appendix A: Data tables corresponding to described hepatitis C information
| Hepatitis C infection status | Number of cases | Rate per 100,000 population |
|---|---|---|
| AcuteFootnote 2 | 209 | 1.0 |
| ChronicFootnote 3 | 2,026 | 16.4 |
| UnspecifiedFootnote 4 | 5,300 | 16.1 |
| Total | 7,535 | 19.7 |
|
National rates of reported acute, chronic and unspecified hepatitis C were calculated using the number of acute, chronic and unspecified hepatitis C cases reported to the Canadian Notifiable Disease Surveillance System as numerators and Statistics Canada July 2022, 2021 population estimates as denominators. |
||
| Jurisdiction | Cases (n) | Rate (per 100,000 population) | Proportion of all reported hepatitis C cases |
|---|---|---|---|
| Canada | 7,535 | 19.7 | 100.0% |
| British Columbia | 1,363 | 26.2 | 18.1% |
| Alberta | 653 | 14.7 | 8.7% |
| Saskatchewan | 452 | 38.3 | 6.0% |
| Manitoba | 589 | 42.3 | 7.8% |
| Ontario | 3,019 | 20.4 | 40.1% |
| Quebec | 805 | 9.4 | 10.7% |
| New Brunswick | 181 | 22.9 | 2.4% |
| Nova Scotia | 274 | 27.6 | 3.6% |
| Newfoundland and Labrador | 155 | 29.8 | 2.1% |
| Prince Edward Island | 27 | 16.4 | 0.4% |
| Yukon | DNS | DNS | DNS |
| Northwest Territories | DNS | DNS | DNS |
| Nunavut | 7 | 17.6 | 0.1% |
|
Provincial and territorial 2021 hepatitis C rates were calculated using the number of hepatitis C cases reported to the Canadian Notifiable Disease Surveillance System as numerators and Statistics Canada July 2021 and 2022 population estimates as denominators. DNS: Data not shown to reduce the risk of identifying individuals |
|||
| Age group (years) | Males | Females | Total | ||||||
|---|---|---|---|---|---|---|---|---|---|
| Cases (n) | Rate (per 100,000 males) | Proportion of all male cases | Cases (n) | Rate (per 100,000 females) | Proportion of all female cases | Cases (n) | Rate (per 100,000 population) | Proportion of all reported cases | |
| <15 | 0 | 0 | 0% | 0 | 0 | 0% | 0 | 0 | 0% |
| 15 to 19 | 0 | 0 | 0% | 5 | 0.9 | 5.1% | 5 | 0.5 | 2.4% |
| 20 to 24 | 9 | 1.4 | 8.3% | 6 | 1.0 | 6.1% | 15 | 1.2 | 7.2% |
| 25 to 29 | 15 | 2.1 | 13.8% | 13 | 1.9 | 13.3% | 29 | 2.1 | 13.9% |
| 30 to 39 | 32 | 3.9 | 29.4% | 36 | 2.5 | 36.7% | 68 | 2.3 | 32.5% |
| 40 to 59 | 38 | 1.4 | 34.9% | 26 | 1.0 | 26.5% | 64 | 1.2 | 30.6% |
| >60 | 8 | 0.3 | 7.3% | 7 | 0.3 | 7.1% | 15 | 0.3 | 7.2% |
|
National acute hepatitis C age rates by sex and overall in 2021 were calculated using the number of acute hepatitis C cases reported to the Canadian Notifiable Disease Surveillance System as numerators and Statistics Canada July 2022, 2021 population estimates as denominators. The "total" case count and rate include all males, females and unspecified sex. There were two reported cases of hepatitis C unspecified sex reported in 2021. In 2021, seven provinces and territories (British Columbia, Alberta, Saskatchewan, Manitoba, Quebec, Nunavut, and Yukon) provided reported acute hepatitis C case data. |
|||||||||
| Jurisdiction | 2012 | 2013 | 2014 | 2015 | 2016 | 2017 | 2018 | 2019 | 2020 | 2021 |
|---|---|---|---|---|---|---|---|---|---|---|
| British Columbia | Acute and Chronic/UnspecifiedFootnote 9 | |||||||||
| Alberta | Acute, Chronic and Unspecified | |||||||||
| Saskatchewan | Unspecified | Acute, Chronic and Unspecified | ||||||||
| Manitoba | Unspecified | Acute, Chronic and Unspecified | ||||||||
| Ontario | Unspecified | |||||||||
| Quebec | Acute and Unspecified | |||||||||
| New Brunswick | Unspecified | |||||||||
| Nova Scotia | Unspecified | |||||||||
| Prince Edward Island | Unspecified | |||||||||
| Newfoundland and Labrador | Unspecified | |||||||||
| Yukon | Acute, Chronic and Unspecified | Acute and Chronic | Acute, Chronic and Unspecified | Acute and Chronic | ||||||
| Northwest Territories | Unspecified | |||||||||
| Nunavut | Unspecified | Acute, Chronic and Unspecified | ||||||||
Appendix B: List of supplementary tables
Due to the impact of the COVID-19 pandemic on the number of reported hepatitis C cases, a 2021 hepatitis C in Canada surveillance report was not prepared by the Public Health Agency of Canada. However, the supplementary tables described below are available upon request via sti-hep-its@phac-aspc.gc.ca.
- Table 1. Number of reported cases and rates of hepatitis C (per 100,000 population) in Canada, 2012 to 2021
- Figure 1. Reported hepatitis C annual rate change (%) by sex in Canada, 2012 to 2021
- Figure 2. Reported hepatitis C rates (per 100,000 population) by sex and age group (15 years and older) in Canada, 2012 to 2021
- Table 2. Reported hepatitis C rates (per 100,000 population) by sex and age group (15 years and older) in Canada, 2012 to 2021
- Figure 3. Reported hepatitis C rate change (%) by age group and sex in Canada, from 2020 to 2021
- Table 3. Number of reported cases and rates of hepatitis C (per 100,000 population) in 2020 and 2021 and reported hepatitis C rate change (%) from 2020 to 2021, by age group and sex in Canada
- Table 4. Number of reported hepatitis C cases by age group in Canada, 2012 to 2021
- Table 5. Reported rates of hepatitis C (per 100,000 population) by age group in Canada, 2012 to 2021
- Table 6. Number of reported hepatitis C cases among males by province or territory in Canada, 2012 to 2021
- Table 7. Reported hepatitis C rates (per 100,000 population) among males by province or territory in Canada, 2012 to 2021
- Table 8. Number of reported hepatitis C cases among females by province or territory in Canada, 2012 to 2021
- Table 9. Reported hepatitis C rates (per 100,000 population) among females by province or territory in Canada, 2012 to 2021
- Figure 4. Reported hepatitis C rate change (%) by province or territory in Canada, from 2020 to 2021
- Table 10. Number of reported cases and rates of hepatitis C (per 100,000 population) in 2020 and 2021 and reported hepatitis C rate change (%) from 2020 to 2021, by province or territory in Canada
- Figure 5. Reported hepatitis C rates by region, province, and territory in Canada, 2012 to 2021
- Table 11. Number of reported cases and rates of hepatitis C (per 100,000 population) in the western provinces of Canada, 2012 to 2021
- Table 12. Number of reported cases and rates of hepatitis C (per 100,000 population) in central Canada, 2012 to 2021
- Table 13. Number of reported cases and rates of hepatitis C (per 100,000 population) in the Atlantic region of Canada, 2012 to 2021
- Table 14. Number of reported cases and rates of hepatitis C (per 100,000 population) in the Northern Territories of Canada, 2012 to 2021
- Table 15. Number of reported hepatitis C cases and proportion (%) by age group (years) in Canada, 2012 to 2021
- Figure 6. Number of reported cases and rates of acute hepatitis C by age group (years) and sex in Canada, 2021
- Table 16. Number of reported cases and rates of acute hepatitis C (per 100,000 population) by age group (years) and sex in Canada, 2021
- Table 17. Number of reported cases and rates of acute hepatitis C (per 100,000 population) by province or territory in Canada, 2021
Notes
Observed differences in the data published here and the data published in provincial and territorial surveillance products may be due to reporting delays, differences in the date data were extracted from the provincial and territorial surveillance databases or other reporting variations. Where such differences are noted, it is recommended that data and results from provincial and territorial products be used. Also, percent changes in rates were calculated using non-rounded numbers.
Related links
Footnotes
- Footnote 1
-
Survey on the impact of COVID-19 on the delivery of STBBI prevention, testing and treatment, including harm reduction services, in Canada. Ottawa, ON: Public Health Agency of Canada; 2022. Pub.: 210294.
- Footnote 2
-
In 2021, seven provinces and territories (British Columbia, Alberta, Saskatchewan, Manitoba, Quebec, Nunavut, and Yukon) reported acute hepatitis C cases.
- Footnote 3
-
In 2021, six provinces and territories (British Columbia, Alberta, Saskatchewan, Manitoba, Nunavut, and Yukon) reported chronic hepatitis C cases.
- Footnote 4
-
In 2021, 11 provinces and territories (all but British Columbia and Yukon), reported unspecified hepatitis C cases.
- Footnote 5
-
Interpret rate with caution since it was calculated as the number of cases among a smaller population. In such instances, it is best to consider the number of cases reported for the jurisdiction.
- Footnote 6
-
The National Hepatitis C Case Definition was revised in 2018/2019 to add acute hepatitis C.
- Footnote 7
-
People living with Hepatitis C (HCV) in Canada, 2019. https://www.canada.ca/en/public-health/services/publications/diseases-conditions/infographic-people-living-with-hepatitis-c.html
- Footnote 8
-
Canadian Network on Hepatitis C. Blueprint to inform hepatitis C elimination efforts in Canada. Montreal, QC: CanHepC; 2019; (accessed in February 2023). https://www.canhepc.ca/sites/default/files/media/documents/blueprint_hcv_2019_05.pdf
- Footnote 9
-
British Columbia sends hepatitis C chronic and unspecified data together, as one category, to the Canadian Notifiable Disease Surveillance System. The Canadian Notifiable Disease Surveillance System (https://diseases.canada.ca/notifiable/) treats these cases as hepatitis C chronic cases.