
Survey on the impact of COVID-19 on the delivery of STBBI prevention, testing and treatment, including harm reduction services, in Canada
Download the alternative format
(746 KB, 24 pages)
Organization: Public Health Agency of Canada
Date published: 2022-03-03
Cat.: HP40-293/2021E-PDF
ISBN.: 978-0-660-40281-9
Pub.: 210294
Table of contents
- Introduction
- Methods
- Analysis
- Results
- Description of service provider organizations
- Changes in staffing levels
- Changes in referrals to other health and social services
- Remote services
- Changes in the demand for and the ability to provide sexually transmitted and blood-borne infection-related services
- Service delivery model changes
- Continuation and initiation of opioid agonist therapy
- Changes in drug use patterns, risk behaviours and drug use-related negative outcomes
- Discussion
- Strengths and limitations
- Conclusion
- References
Introduction
On January 25, 2020, Canada's first case of the coronavirus disease (COVID-19) was reported and in the subsequent weeks, single digit daily case counts continued until early March when numbers rose rapidly. On March 12, 2020, with 393 new daily cases and nearly 2000 total cases, the Canadian government along with provincial and territorial jurisdictions intensified public health mitigation efforts by announcing international border restrictions and widespread closures of non-essential businesses and schoolsFootnote 1 Footnote 2. At the time of writing, Canada experienced three distinct waves of the COVID-19 pandemic, the first peaking in mid-April 2020 and the second peaking in early January 2021 with a third wave starting early March 2021.
Since the start of the COVID-19 pandemic, unprecedented challenges in delivering primary health care including sexually transmitted and blood-borne infections (STBBI) prevention, testing and treatment services as well as harm reduction services, have been reported across the country. These disruptions may have had a greater impact on populations that are more at risk for STBBI and COVID-19, such as African, Caribbean and Black (ACB) people, Indigenous Peoples and people who use drugs living in CanadaFootnote 3. The Public Health Agency of Canada (PHAC) developed four national online surveys to better understand the impact of the COVID-19 pandemic on access to and delivery of STBBI prevention, testing, treatment, and harm reduction services, specifically for priority populations.
The first survey, the survey on the impact of COVID-19 on the delivery of STBBI prevention, testing and treatment including harm reduction services in Canada, was designed to gather information from STBBI service providers. It targeted community-based organizations and local public health units providing STBBI-related services in Canada and examined the impact of COVID-19 on their ability to provide STBBI-related services. This was followed by three planned surveys of priority populations: ACB people, Indigenous Peoples and people who use drugs or alcohol. The population-specific surveys aim to explore the impact of COVID-19 on access to STBBI-related services, as well as social and structural determinants of health that impact access to services, including mental health, family violence, stigma and discrimination, substance use, housing stability and food insecurity.
Assessments of STBBI service providers and priority populations provide the information needed for public health decision making around the provision of STBBI services in the context of resurgences of COVID-19 and/or the responses to future emerging pathogens. This report presents the national findings of the survey on the impact of COVID-19 on the delivery of STBBI prevention, testing and treatment including harm reduction services in Canada, conducted from November 7, 2020, to December 7, 2020.
Methods
Data source and survey design
The survey on the impact of COVID-19 on the delivery of STBBI prevention, testing and treatment including harm reduction services in Canada was a cross-sectional self-administered online survey. This survey method was selected due to various public health measures in place to reduce COVID-19 transmission. Conducting the survey online avoided the risk associated with close physical contact that could occur with face-to-face interviews. As well, the online survey method supported the collection of information from a large number of participants over a short period of time (i.e., a four week period).
Survey questions were developed along with input from select STBBI service providers to ensure survey questions were relevant and aligned with the objectives of the survey. The survey collected information on the types of STBBI services provided, and whether these services had to be stopped or reduced due to the COVID-19 pandemic. As well, information on challenges and innovative practices implemented as a result of COVID-19 were collected. Individuals completed the survey on behalf of their organization and no directly identifying information was captured.
Eligibility criteria and sampling method
The eligibility criteria included any organization that directly provided STBBI and/or harm reduction services in Canada. A convenience sampling method was employed. A list of stakeholders including provincial and territorial contacts, local public health and community-based organizations were contacted to distribute the survey link and participate as appropriate. National and regional STBBI organizations and other government departments were encouraged to promote the survey link to their networks of service providers. Service providers invited to participate were also encouraged to share the survey link with other known community-based organizations that provide STBBI services. The survey link was also distributed via PHAC social media channels (e.g., Twitter, LinkedIn) throughout the data collection period and social media were re-posted by key national stakeholders.
The survey protocol and questionnaire were approved by the Health Canada/PHAC Research Ethics Board. Due to the anonymous nature of this survey and an anticipated low participant burden, reimbursement was not offered for participation in this survey.
Analysis
Descriptive statistics were computed with SAS Enterprise Guide 7.1. Small cell counts were assessed to determine the risk of identifying individual participants, and were left in when it was determined that there was no risk of re-identification, as per PHAC's Directive for the Collection, Use and Dissemination of Information relating to Public Health (PHAC, 2013, unpublished document). Participants who responded with "don't know", "refused" or "not stated" were excluded from each individual analysis.
Results
Description of service provider organizations
In total, 416 service providers from across Canada participated in the survey from November 7 to December 7, 2020. Respondents were classified by the type of services they provided: STBBI prevention, testing and treatment services (82.7%); harm reduction services (68.8%); substance use and treatment services (28.9%); support and treatment for people living with HIV and/or hepatitis C (59.9%); and other unspecified types of STBBI prevention services (13.7%) (Table 1).
Almost half (46.9%) of the respondents worked in a community-based organization; just over one-quarter (26.9%) were part of a healthcare clinic or facility; and nearly one-fifth (19.0%) were part of a local public health unit. A smaller proportion (7.2%) worked in a pharmacy or another type of organization or setting.
Respondents were asked to identify the populations to whom their organization provided services. Most provided services for people who use drugs (84.9%), people living with HIV and/or hepatitis C and related conditions (80.8%), people experiencing homelessness (76.0%), and Indigenous Peoples (74.5%). Less than three-quarters provided services to gay and bisexual men (72.1%), transgender persons (68.8%), people engaged in the sale or purchase of sex (67.8%), people with experience in the prison environment (63.9%), African, Caribbean and Black people (55.5%) and people from countries where HIV, hepatitis B and C are endemic (53.6%). One-quarter of the service providers reported providing services to other unspecified populations (25.7%).
Just over half (53.9%) of the service providers were located in Ontario with smaller proportions located in Quebec (11.5%), Saskatchewan (8.4%), Manitoba (7.5%), the Atlantic provinces (7.2%), British Columbia (6.0%), Alberta (4.3%) and the Territories (1.2%). Nearly one-half (48.1%) of the service providers were located in a large urban centre with a population greater than 200,000 people while only 5.1% were located in rural areas with a population of less than 1,000. A small proportion (13.5%) identified as a service provider organization at the regional, provincial or national level. More than one-quarter of respondents (28.6%) reported an annual clientele base of 5,000 or more people with slightly smaller proportions reporting an annual clientele base between 2,000 and 4,999 people (17.3%); between 1,000 and 1,999 people (14.8%); between 500 and 999 people (21.4%); and less than 500 people (17.9%).
Regarding the respondent's primary role in their organization, 38.0% identified as a frontline healthcare professional (e.g., physician, nurse, etc.); 23.1% identified as a manager or program co-ordinator; 20.4% identified as the director of the organization; and 18.5% as a frontline non-healthcare service provider or another unspecified role. Three-quarters (77.2%) of the service providers reported that their organization received official designation as an essential service since the start of the COVID-19 pandemic, with just over half (51.2%) reporting that their organization received additional funding to support its response to the COVID-19 pandemic.
| Characteristic | n | TotalFootnote a | %Footnote b |
|---|---|---|---|
| Province or territory where organization is located | |||
| British Columbia | 25 | 416 | 6.0 |
| Alberta | 18 | 416 | 4.3 |
| Saskatchewan | 35 | 416 | 8.4 |
| Manitoba | 31 | 416 | 7.5 |
| Ontario | 224 | 416 | 53.9 |
| Quebec | 48 | 416 | 11.5 |
| Atlantic provincesFootnote c | 30 | 416 | 7.2 |
| TerritoriesFootnote d | 5 | 416 | 1.2 |
| Services provided by organizationFootnote e | |||
| STBBI prevention, testing or treatment servicesFootnote f | 344 | 416 | 82.7 |
| Harm reduction servicesFootnote g | 286 | 416 | 68.8 |
| Support and treatment for people living with HIV and/or hepatitis CFootnote h | 249 | 416 | 59.9 |
| Substance use and treatment servicesFootnote i | 120 | 416 | 28.9 |
| Other types of STBBI prevention services | 57 | 416 | 13.7 |
| Size of city or town where organization is located | |||
| Rural area (population less than 1,000) | 21 | 416 | 5.1 |
| Small city or town (population between 1,000 to 29,999) | 53 | 416 | 12.7 |
| Medium-sized city or town (population between 30,000 to 99,999) | 36 | 416 | 8.7 |
| Large urban centre (population between 100,000 to 199,999) | 50 | 416 | 12.0 |
| Large urban centre (population greater than 200,000) | 200 | 416 | 48.1 |
| Other: Organization is regional, provincial or national in scope | 56 | 416 | 13.5 |
| Size of annual clientele base | |||
| Less than 500 people | 65 | 364 | 17.9 |
| Between 500 and 999 people | 78 | 364 | 21.4 |
| Between 1,000 and 1,999 people | 54 | 364 | 14.8 |
| Between 2,000 and 4,999 people | 63 | 364 | 17.3 |
| 5,000 or more people | 104 | 364 | 28.6 |
| Respondent's primary role in organization | |||
| Frontline health care professional (e.g., physician, nurse) | 158 | 416 | 38.0 |
| Manager or Program co-ordinator | 96 | 416 | 23.1 |
| Director of organization | 85 | 416 | 20.4 |
| Other frontline service provider or non-health care professional | 77 | 416 | 18.5 |
| Organization type | |||
| Community-based organization | 195 | 416 | 46.9 |
| Local public health unit | 79 | 416 | 19.0 |
| Health care clinic or facility | 112 | 416 | 26.9 |
| Pharmacy or other type of organizationFootnote j | 30 | 416 | 7.2 |
| Populations servedFootnote k | |||
| People who use drugs | 353 | 416 | 84.9 |
| People living with HIV or hepatitis C and related conditions | 336 | 416 | 80.8 |
| People experiencing homelessness | 316 | 416 | 76.0 |
| Indigenous Peoples | 310 | 416 | 74.5 |
| Gay and bisexual men | 300 | 416 | 72.1 |
| Transgender persons | 286 | 416 | 68.8 |
| People engaged in the sale or purchase of sex | 282 | 416 | 67.8 |
| People with experience in the prison environment | 266 | 416 | 63.9 |
| African, Caribbean, and Black people | 231 | 416 | 55.5 |
| People from countries where HIV, hepatitis B and hepatitis C are endemic | 223 | 416 | 53.6 |
| Other populations | 107 | 416 | 25.7 |
| Organization received official designation as an essential service since the start of the COVID-19 pandemic | |||
| Yes | 321 | 416 | 77.2 |
| No | 47 | 416 | 11.3 |
| Don't know | 48 | 416 | 11.5 |
| Organization received additional funding to support its response to the COVID-19 pandemic | |||
| Yes | 213 | 416 | 51.2 |
| No | 97 | 416 | 23.3 |
| Don't know | 106 | 416 | 25.5 |
|
|||
Changes in staffing levels
Since the start of the COVID-19 pandemic, one-quarter of the service providers (24.8%) reported that staffing levels decreased and were still decreased at the time of the survey (Table 2). A slightly smaller proportion (16.5%) reported that staffing levels increased and were still increased at the time of the survey. Nearly one-third of the service providers (32.9%) reported no change in their organization's staffing levels and approximately one-fifth (22.7%) reported an initial decrease in staffing levels which were near or above pre-pandemic levels (i.e., prior to March 12, 2020 when public health mitigation measures were put in place in Canada) at the time of the survey. Service providers reported additional qualitative feedback about staffing levels indicating that service closures and/or a reduction in staffing levels occurred when staff were reassigned to support the COVID-19 response.
Changes in referrals to other health and social services
STBBI and harm reduction service providers were asked about changes in the number and types of referrals they made to other health and social services since the start of the COVID-19 pandemic. Just over one-third (34.8%) reported an increase in the number of referrals made while a smaller proportion (15.3%) reported a decrease in the number of referrals (Table 2). One-fifth (20.1%) reported an increase in the number of some referrals and a decrease in the number of other referrals, while 29.7% reported no change in the number of referrals made. The types of referred services most in demand were for mental health services (78.3%), food security (77.7%), housing and/or emergency shelters (75.0%), and other health (59.8%) and harm reduction services (58.2%) (Table 2).
The main reasons cited for decreased referrals included the unavailability of the referred services; reduced capacity to serve clients because of decreased hours of operation; decreased staff, or decreased funding to serve clients; and decreased client volumes with fewer clients to refer.
| Indicator | n | TotalFootnote a | %Footnote b |
|---|---|---|---|
| Change in staffing levels during the COVID-19 pandemic | |||
| Decreased, still decreased | 80 | 322 | 24.8 |
| Decreased, now near or above pre-COVID-19 levels | 73 | 322 | 22.7 |
| No change | 106 | 322 | 32.9 |
| Increased, still increased | 53 | 322 | 16.5 |
| Increased, now near or below pre-COVID-19 levels | 10 | 322 | 3.1 |
| Change in the number of referrals to other health and social servicesFootnote c | |||
| Decreased the number of referrals | 51 | 333 | 15.3 |
| No change | 99 | 333 | 29.7 |
| Increased the number of referrals | 116 | 333 | 34.8 |
| Increased some and decreased others | 67 | 333 | 20.1 |
| Types of referred services most in demandFootnote d | |||
| Mental health services | 144 | 184 | 78.3 |
| Food security | 143 | 184 | 77.7 |
| Housing and/or emergency shelters | 138 | 184 | 75.0 |
| Health services | 110 | 184 | 59.8 |
| Harm reduction services | 107 | 184 | 58.2 |
| Opioid agonist therapy | 43 | 184 | 23.4 |
| Other unspecified services | 25 | 184 | 13.6 |
|
|||
Remote services
Of all service providers, 80.7% provided remote services such as internet-based, telephone-based or video-based services since the start of the COVID-19 pandemic (Table 3). Of these, 20.2% created new remote services for the first time; 45.9% created new remote services in addition to pre-existing remote services; and 14.7% continued with their existing remote services without any new remote services.
| Indicator | n | TotalFootnote a | %Footnote b |
|---|---|---|---|
| Provision of remote servicesFootnote c | |||
| None prior or since the beginning of the COVID-19 pandemic | 63 | 327 | 19.3 |
| Continued with existing remote services without any new services | 48 | 327 | 14.7 |
| Created new remote services for the first time | 66 | 327 | 20.2 |
| Created new remote services in addition to pre-existing remote services | 150 | 327 | 45.9 |
|
|||
Changes in the demand for and the ability to provide sexually transmitted and blood-borne infection-related services
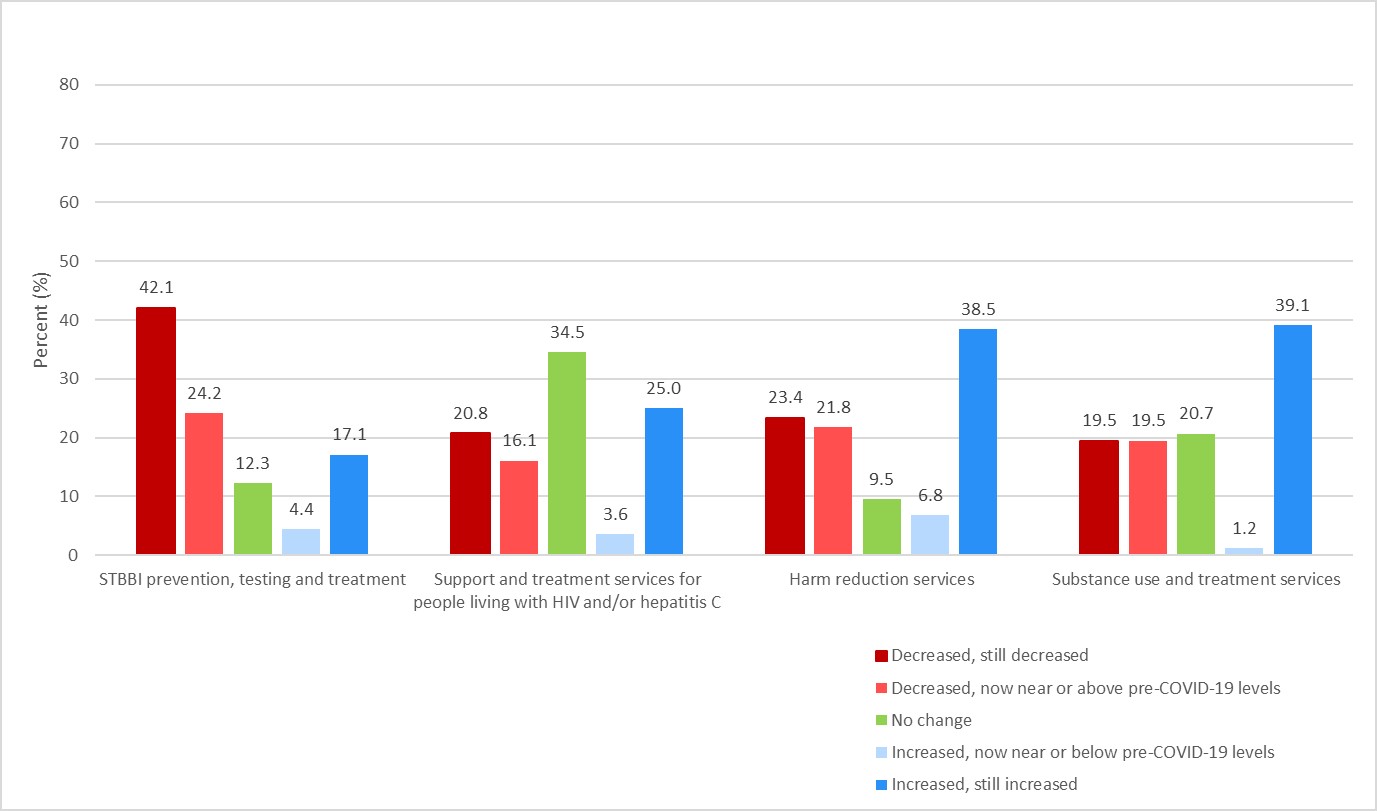
Figure 1: Text description
| Change category for each STBBI-related service | STBBI prevention, testing and treatment | Support and treatment services for people living with HIV and/or hepatitis C | Harm reduction services | Substance use and treatment services |
|---|---|---|---|---|
| Decreased, still decreased | 42.1% | 20.8% | 23.4% | 19.5% |
| Decreased, now near or above pre-COVID-19 levels | 24.2% | 16.1% | 21.8% | 19.5% |
| No change | 12.3% | 34.5% | 9.5% | 20.7% |
| Increased, now near or below pre-COVID-19 levels | 4.4% | 3.6% | 6.8% | 1.2% |
| Increased, still increased | 17.1% | 25.0% | 38.5% | 39.1% |
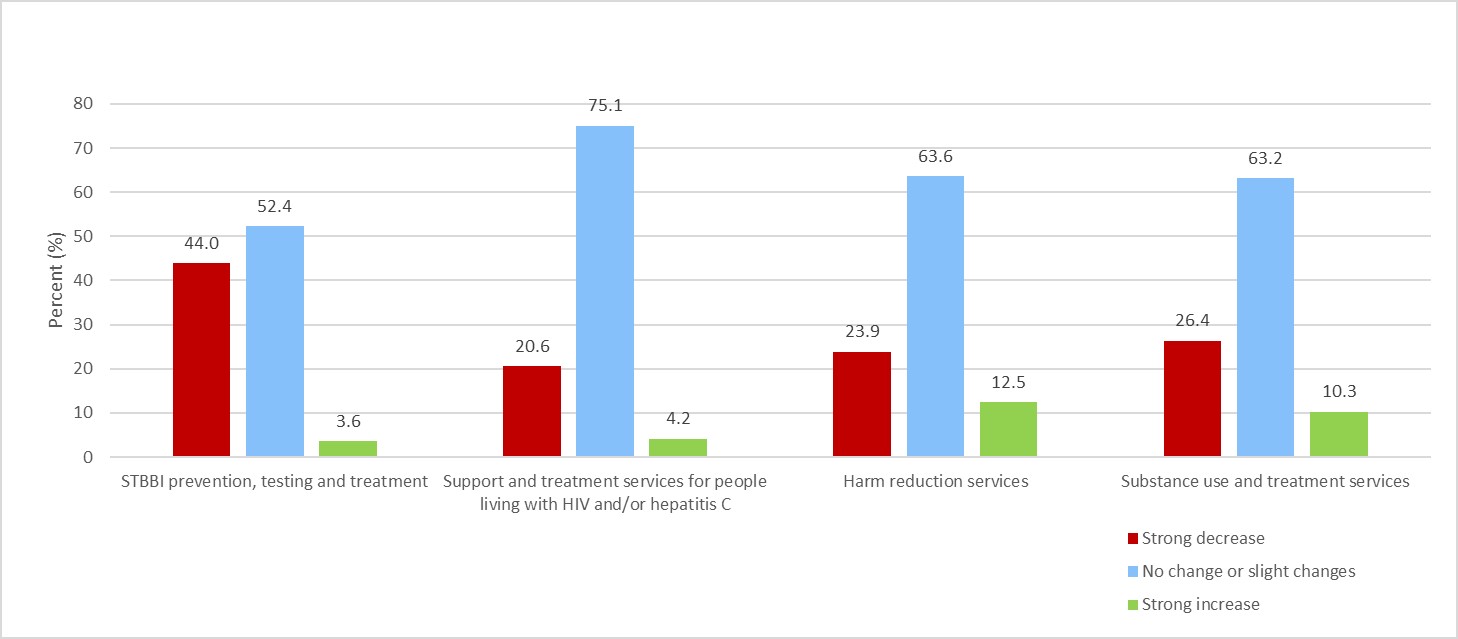
Figure 2: Text description
| Change category for each STBBI-related service | STBBI prevention, testing and treatment | Support and treatment services for people living with HIV and/or hepatitis C | Harm reduction services | Substance use and treatment services |
|---|---|---|---|---|
| Strong decrease | 44.0% | 20.6% | 23.9% | 26.4% |
| No change or slight changes | 52.4% | 75.1% | 63.6% | 63.2% |
| Strong increase | 3.6% | 4.2% | 12.5% | 10.3% |
STBBI prevention, testing and treatment services
STBBI prevention, testing and treatment services were provided by 82.7% of respondents (Table 1). Over two-thirds of respondents (66.3%) experienced a decrease in demand for STBBI prevention, testing and treatment services at some point since the beginning of the pandemic with 42.1% reporting that demand was still decreased at the time of the survey (Figure 1).
While over one-half (52.4%) reported no change or slight changes in the ability to provide services; over one-third (44.0%) reported a strong decrease in their ability to provide these services (Figure 2). Decreases were reported among almost one-half of those who provided services involving the development and/or dissemination of sexual health educational resources (47.2%) and those providing specific testing services, namely STI testing (45.1%), hepatitis C testing (43.7%) and HIV testing (43.9%) (Table 4).
| STBBI prevention, testing and treatment service | Stopped at some point in time | Decreased at some point in time | No change | Increased at some point in time | Service delivery model changed |
|---|---|---|---|---|---|
| HIV testing | 30.8% | 43.9% | 13.1% | 1.5% | 10.6% |
| Hepatitis C testing | 31.0% | 43.7% | 13.8% | 3.5% | 8.1% |
| Sexually transmitted infection testing | 31.1% | 45.1% | 8.8% | 5.2% | 9.8% |
| STBBI contact tracing and follow-up | 20.8% | 35.4% | 35.4% | 5.6% | 2.8% |
| Antiretroviral therapy (ART) and/or STBBI treatment | 13.9% | 34.0% | 43.8% | 3.5% | 4.9% |
| Pre-exposure prophylaxis (PrEP) and/or post-exposure prophylaxis (PEP) provision | 16.7% | 32.4% | 39.2% | 3.9% | 7.8% |
| Condom and/or dental dam provision | 16.6% | 41.5% | 34.1% | 5.5% | 2.3% |
| Mental health counselling | 15.5% | 35.2% | 16.2% | 26.8% | 6.3% |
| Indigenous health or healing practices | 16.9% | 37.1% | 28.1% | 15.7% | 2.3% |
| Peer training mentorship and support | 34.6% | 40.3% | 9.4% | 12.0% | 3.8% |
| Development and/or dissemination of sexual health educational resources | 24.1% | 47.2% | 21.3% | 5.6% | 1.9% |
| STBBI information and awareness including outreach | 33.2% | 43.9% | 10.8% | 9.4% | 2.8% |
Note: Proportions are presented as row percentages and were calculated from total counts for the corresponding indicator excluding "don't know", "refused" and "not stated" values. The sum of the row percentages may not equal 100% due to rounding, unless stated otherwise. |
|||||
Support and treatment for people living with HIV and/or hepatitis C
Support and treatment for people living with HIV and/or hepatitis C were provided by 59.9% of respondents (Table 1). Among those providing these services, 36.9% reported a decrease in demand at some point since the beginning of the COVID-19 pandemic, with 20.8% reporting that demand was still decreased at the time of the survey (Figure 1).
Three-quarters (75.1%) of providers reported no or only slight changes since the start of the COVID-19 pandemic in their ability to provide support and treatment services for people living with HIV and/or hepatitis C, while 20.6% reported a strong decrease (Figure 2). The proportion of service providers reporting these decreases ranged from 28.1% of those providing support groups to 57.4% of those providing Indigenous health or healing practice services (Table 5).
| HIV and/or hepatitis C support and treatment service | Stopped at some point in time | Decreased at some point in time | No change | Increased at some point in time | Service delivery model changed |
|---|---|---|---|---|---|
| Medical treatmentFootnote a | 12.1% | 51.8% | 22.9% | 3.6% | 9.6% |
| Viral load monitoring | 16.4% | 46.3% | 29.9% | 1.5% | 6.0% |
| Mental health counselling | 16.2% | 44.4% | 9.1% | 23.2% | 7.1% |
| Outreach support | 25.0% | 36.7% | 7.5% | 25.8% | 5.0% |
| STBBI testing | 34.8% | 40.2% | 15.2% | 0.0% | 9.8% |
| STBBI contact tracing and follow-up | 21.7% | 33.3% | 36.7% | 0.0% | 8.3% |
| Linkage to or provision of allied health care | 13.0% | 54.2% | 16.8% | 11.5% | 4.6% |
| Linkage to or provision of social support servicesFootnote b | 12.1% | 37.9% | 15.9% | 29.6% | 4.6% |
| Indigenous health or healing practices | 9.8% | 57.4% | 18.0% | 13.1% | 1.6% |
| Peer training, mentorship and support | 33.3% | 43.9% | 7.9% | 7.9% | 7.0% |
| Development and/or dissemination of sexual health educational resources | 23.3% | 45.8% | 16.7% | 9.2% | 5.0% |
| STBBI information and awareness including outreach | 27.1% | 41.8% | 16.4% | 9.0% | 5.7% |
| Support groups for people living with HIV and/or hepatitis C | 49.4% | 28.1% | 6.7% | 5.6% | 10.1% |
Note: Proportions are presented as row percentages and were calculated from total counts for the corresponding indicator excluding "don't know", "refused" and "not stated" values. The sum of the row percentages may not equal 100% due to rounding, unless stated otherwise.
|
|||||
Harm reduction services
Harm reduction services (e.g., needle and syringe distribution, on-site consumption, drug checking, naloxone training and provision, etc.) were provided by 68.8% of respondents (Table 1). Nearly one-half (45.3%) of harm reduction service providers experienced an increase in demand for their services at some point since the beginning of the pandemic with 38.5% reporting this demand was still increased at the time of the survey (Figure 1). A similar proportion (45.2%) experienced a decreased demand for services with 23.4% reporting demand was still decreased at the time of the survey.
Nearly two-thirds (63.6%) of harm reduction service providers reported no change or only slight changes in their ability to provide services since the beginning of the COVID-19 pandemic (Figure 2).
Some harm reduction service providers reported that specific services stopped at some point in time since the start of the pandemic. More than half (54.5%) of those who offered drop-in centres for people who use drugs and one-third of those who provided peer training (34.7%) or training to support the meaningful engagement of people who use drugs and their networks (37.8%) stopped services at some point since the start of the pandemic (Table 6).
| Harm reduction service | Stopped at some point in time | Decreased at some point in time | No change | Increased at some point in time | Service delivery model changed |
|---|---|---|---|---|---|
| Needle, syringe and/or inhalation equipment distribution programs | 10.7% | 26.2% | 15.1% | 27.2% | 20.9% |
| Drop-in centres for people who use drugs | 54.5% | 24.4% | 6.5% | 4.9% | 9.8% |
| Drug consumption rooms | 27.3% | 29.6% | 13.6% | 15.9% | 13.6% |
| Drug checking services | 22.8% | 19.3% | 40.4% | 15.8% | 1.8% |
| Delivery of safe drug supplies | 15.5% | 22.5% | 20.4% | 37.3% | 4.2% |
| Outreach services | 25.7% | 31.9% | 8.4% | 25.7% | 8.4% |
| Naloxone training and/or provision | 19.1% | 26.8% | 23.4% | 23.0% | 7.7% |
| Peer training, mentorship and support | 34.7% | 34.1% | 11.2% | 12.9% | 7.1% |
| Training to support the meaningful engagement of people who use drugs and their networks | 37.8% | 30.5% | 13.4% | 11.6% | 6.7% |
| Development and/or dissemination of drug use educational resources | 20.8% | 33.7% | 25.3% | 14.9% | 5.5% |
Note: Proportions are presented as row percentages and were calculated from total counts for the corresponding indicator excluding "don't know", "refused" and "not stated" values. The sum of the row percentages may not equal 100% due to rounding, unless stated otherwise. |
|||||
Substance use and treatment services
Substance use and treatment services (i.e., counselling, opioid agonist therapy, inpatient services, etc.) were provided by 28.9% of respondents (Table 1). Since the beginning of the pandemic, 40.3% of substance use and treatment service providers experienced an increase in demand for their services with 39.1% reporting this demand was still increased at the time of the survey (Figure 1). A similar proportion of substance use and treatment service providers (39.0%) also experienced a decreased demand for services since the beginning of the COVID-19 pandemic with 19.5% reporting demand was still decreased at the time of the survey.
Nearly two-thirds (63.2%) of respondents who delivered substance use and treatment services reported no change or only slight changes in their ability to provide services since the start of the pandemic (Figure 2).
Some respondents who delivered substance use and treatment services reported that specific services stopped at some point in time since the beginning of the pandemic. More than half (53.3%) of those who provided substance use and treatment in hospital-based residential settings and nearly one-half of those who provided substance use and treatment in primary outpatient mental health care centres (47.6%) or in correctional settings (47.1%) stopped services at any point since the beginning of the pandemic (Table 7).
| Substance use and treatment service | Stopped at some point in time | Decreased at some point in time | No change | Increased at some point in time | Service delivery model changed |
|---|---|---|---|---|---|
| Outpatient mental health counselling and psychosocial treatment | 25.4% | 46.3% | 7.5% | 9.0% | 11.9% |
| Opioid agonist therapy in specialized outpatient treatment centres | 15.4% | 34.6% | 26.9% | 19.2% | 3.9% |
| Opioid agonist therapy in non-specialized outpatient treatment centresFootnote a | 24.3% | 27.0% | 21.6% | 18.9% | 8.1% |
| Substance treatment in primary health care settingsFootnote a | 15.9% | 29.6% | 20.5% | 27.3% | 6.8% |
| Substance treatment in primary outpatient mental health care centres | 47.6% | 33.3% | 14.3% | 4.8% | 0.0% |
| Substance treatment in hospital-based residential settingsFootnote b | 53.3% | 26.7% | 20.0% | 0.0% | 0.0% |
| Substance treatment in non-hospital based residential settingsFootnote c | 42.9% | 33.3% | 14.3% | 4.8% | 4.8% |
| Substance treatment in correctional settings | 47.1% | 29.4% | 23.5% | 0.0% | 0.0% |
| Indigenous health or healing practices | 27.3% | 40.9% | 20.5% | 9.1% | 2.3% |
| Overdose prevention and response | 17.1% | 25.7% | 22.9% | 30.0% | 4.3% |
Note: Proportions are presented as row percentages and were calculated from total counts for the corresponding indicator excluding "don't know", "refused" and "not stated" values. The sum of the row percentages may not equal 100% due to rounding, unless stated otherwise.
|
|||||
Service delivery model changes
Service providers identified service delivery model changes where new approaches or adaptations were made since the start of the pandemic.
STBBI prevention, testing, treatment and support and treatment for people living with HIV and/or hepatitis C
- New remote services (i.e., telephone or virtual format including provision of information and educational materials)
- Mobile outreach for HIV, hepatitis C and other STI testing services
- Mailed clients laboratory requisitions, clients picking up self testing kits or medication
- Outreach methods (including a focus on newly diagnosed individuals with HIV/AIDS and individuals lost during follow-up)
Harm reduction services delivery model innovations (needle, syringe and/or inhalation equipment distribution programs)
- Addition of staff to distribute supplies
- New needle distribution program site created
- Delivery through partner organizations including establishing an integrated multidisciplinary care hub for people experiencing homelessness and street-involved populations
- Service hours increased to 24/7 availability
- Increased number of harm reduction kits
- Delivery of supplies by outreach including mobile vehicle and home delivery
- Self-serve pick-up and drop-off at service windows or curbside depots
- Encouraged clients to pick up bulk quantities of supplies
- Supplies distributed via secure lockers accessed by clients
- Remote services offered (i.e., telephone and virtual support and information)
Drug consumption rooms
- New harm reduction prevention centre created
- Provided pre-packaged gear
Drop-in centres for people who use drugs
- New 24/7 integrated care hub with drop-in services
- Remote services offered (i.e., telephone and virtual support and information)
- Delivery of services by outreach
- Coordination of services with other agencies
Drug checking services and delivery of safe drug supplies
- Pilot take-home fentanyl test strip program
- Delivery of services by outreach
- Drug checking at main harm reduction site
- Increased safe drug supply distribution via pharmacies
Outreach services
- Online format developed
- Mobile harm reduction outreach van
- Indigenous Peoples focused outreach
- New mobile food support unit and delivery of medical supplies and groceries
- New peer support programs offered
- Naloxone provision 24/7 through integrated care hub
- Increased one-on-one engagement
- Essential supply delivery
- Support for encampments
- COVID-19 testing for people experiencing homelessness or living in encampments
Naloxone training and/or provision
- New naloxone training and/or provision offered
- Online format developed
- Delivery of naloxone by outreach
- Staff providing training and debriefing outside with clients
Peer training, engagement of people who use drugs, and educational resources
- New peer training offered
- Small group or one-on-one format
- Online format developed
- Delivery of services by outreach
Substance use and treatment services
- New remote services (i.e., telephone or virtual support)
- Delivery of services by mobile outreach and piloting a safer supply program that included prescribing hydromorphone
Continuation and initiation of opioid agonist therapy
Among service providers who offered opioid agonist therapy (OAT), almost one-half (45.5%) reported that most clients were still able to receive OAT as before the beginning of the COVID-19 pandemic; however, nearly one-third (27.3%) reported either all clients or that only a few clients were still able to receive OAT as before (Figure 3).
Regarding the initiation of OAT, a different pattern appeared. Just over one-quarter (26.7%) of service providers who offered OAT reported that most clients were still able to initiate OAT as before with a larger proportion (46.7%) reporting that only a few clients were still able to initiate OAT. Smaller proportions reported that all clients were still able to initiate or that no clients were able to initiate OAT (16.7% and 10.0%, respectively) since the start of the pandemic.
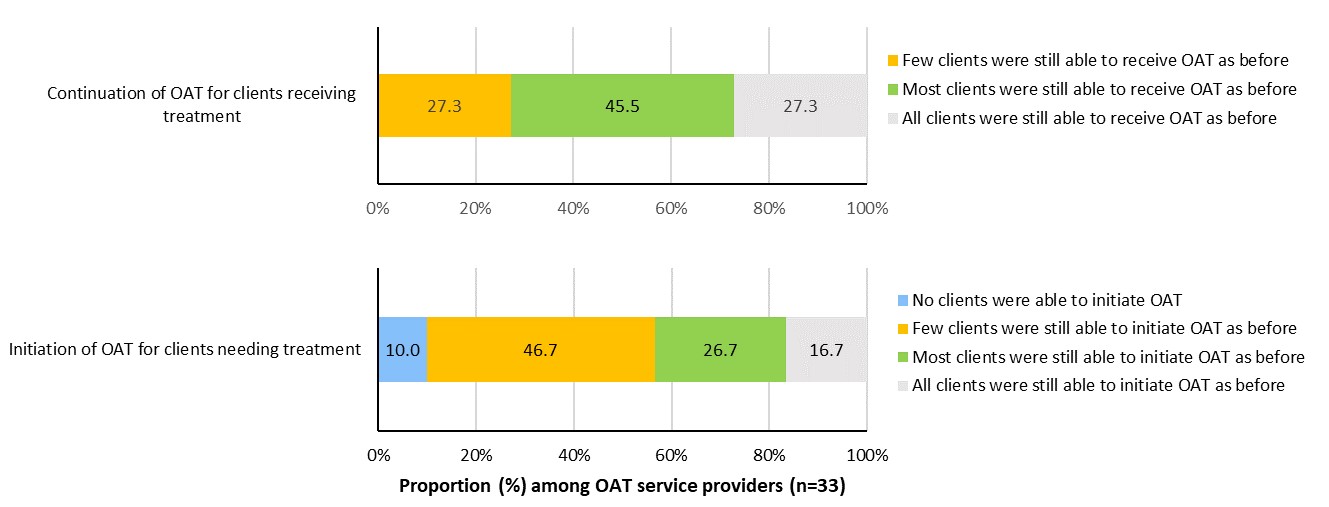
Figure 3: Text description
| OAT service | There were no clients able to receive or initiate OAT as before | Few clients were still able to receive or initiate OAT as before | Most clients were still able to receive or initiate OAT as before | All clients were still able to receive or initiate OAT as before |
|---|---|---|---|---|
| Continuation of OAT for clients receiving treatment | - | 27.3% | 45.5% | 27.3% |
| Initiation of OAT for clients needing treatment | 10.0% | 46.7% | 26.7% | 16.7% |
Changes in drug use patterns, risk behaviours and drug use-related negative outcomes
Harm reduction, substance use and treatment service providers reported a number of changes in drug use patterns and drug use-related risk behaviours among their clients since the beginning of the COVID-19 pandemic. More frequent overall drug use was noted with specific increases in the use of crystal methamphetamine, fentanyl, heroin and other opioids. Additional observations included concerns that clients were going through more drug use supplies because they were using more often and people were trying new or different substances if their substance of choice was not available due to changes in the local drug supply. Other changes to drug use patterns since the beginning of the COVID-19 pandemic included increased drug contamination and increased drug cost.
Drug use-related risk behaviours were reported such as people using alone due to isolation and/or the inability to visit others, putting people at risk for overdose and/or overdose mortality. When access to clean drug use supplies was limited, reuse of one's own and/or sharing someone else's used drug equipment were reported. Some service providers also noted that there was more use of drugs in public spaces and that some clients were switching from injection drug use to inhalation drug use.
Since the beginning of the COVID-19 pandemic, nearly two-thirds (64.5%) of harm reduction, substance use and treatment service providers reported a strong increase in the number of drug use-related negative outcomes including overdoses and over one-quarter reported a slight increase (26.9%) (Table 9).
| Indicator | n | TotalFootnote a | % |
|---|---|---|---|
| Changes in the number of drug use-related negative outcomes including overdosesFootnote b | |||
| Strong or slight decrease | 5 | 186 | 2.7 |
| No change | 11 | 186 | 5.9 |
| Slight increase | 50 | 186 | 26.9 |
| Strong increase | 120 | 186 | 64.5 |
|
|||
Discussion
The national findings of the survey on the impact of COVID-19 on the delivery of STBBI prevention, testing and treatment including harm reduction services in Canada, 2020 present the experiences of STBBI service providers who, since the beginning of the COVID-19 pandemic, encountered both unique and common challenges delivering services under new and extraordinary circumstances. This survey, although using a convenience sampling approach, captured a cross-section of organizations – including a variety of organizational types (i.e., public health units, community-based non-profit organizations), organizations serving different key populations (i.e., 2SLGBTQ+ community, people who use drugs), and located across every province and territory including remote, rural and urban communities of varying sizes. The results provide important insights on the impact of the COVID-19 pandemic on health and social service availability, peer support programming, and innovations in service delivery.
Reductions to health and social services
The COVID-19 pandemic introduced many unintended consequences on the access to, delivery of, and demand for STBBI prevention, testing, treatment and harm reduction services. This occurred despite a large proportion of service provider organizations designated as essential services and over half receiving additional funding to support the pandemic response. Staffing level fluctuations reported in the survey may reflect the different experiences of COVID-19 across the country over the course of the pandemic. Observed staffing reductions may have been associated with the deployment of staff to support the local pandemic response as needed.
Service reductions and closures affected the delivery of STBBI prevention, testing and treatment services including the support and treatment for people living with HIV and/or hepatitis C. Further to the decrease in ability to provide testing services as reported in this survey, a reduced number of STBBI testing requests were submitted to the National Microbiology Laboratory has been noted (A. Meyers, personal communication, July 9, 2021), and syphilis outbreaksFootnote 4 continued across multiple regions. The decreased ability to provide STBBI-related services negatively impacts key populations disproportionately affected by STBBI, and could impact Canada’s progress toward achieving global targets and meeting the strategic goals of the Pan-Canadian STBBI Framework for ActionFootnote 5. In addition, reduced testing will affect reported STBBI trends in 2020-2021. It will be difficult to determine the true impact of the COVID-19 pandemic on rates of STBBI in Canada until STBBI testing returns to or surpasses pre-pandemic testing levels. Lastly, people who have acquired new STBBI during this period and receive new diagnoses will require supportive services including treatment and care.
It will be difficult to determine the true impact of the COVID-19 pandemic on rates of STBBI in Canada until STBBI testing returns to or surpasses pre-pandemic testing levels.
Challenges in the ability to refer clients to other health and social services such as food security, housing and/or emergency shelters, health and mental health services and harm reduction services, despite the increase in demand for these referrals, are another indication of the broad negative impact of COVID-19 on the daily lives of key populations. The burden of the pandemic, particularly for some populations also impacted by STBBI, further illustrates the critical role that community-based organizations play in helping people navigate structural and systemic challenges and the importance of these organizations in providing a lifeline to people in need.
Reductions to peer support programming
Peer support groups, along with peer training and mentorship, provide support for people living with HIV and/or hepatitis C and play an important role in supporting the mental health and wellbeing of clients. These services are recognized as foundational to enable STBBI prevention, testing & treatment, and providing linkage to ongoing care and support. Closures and reductions of these services, along with higher levels of people experiencing mental health issues such as anxiety and depression since the beginning of the COVID-19 pandemicFootnote 6 Footnote 7, signal a gap that will benefit from support in the post-pandemic recovery.
Service delivery innovations
Harm reduction services are a key intervention to reducing exposure to STBBI. Although some harm reduction, substance use and treatment service providers did not experience a significant reduction in their ability to deliver their services, many stopped or decreased services at some point in time since the beginning of the COVID-19 pandemic. Complicating this was the increased demand for services, particularly among those who delivered safe supplies of drugs or needle, syringe and/or inhalation equipment distribution programs, outreach services, and naloxone training and/or provision. Combined with the increase in opioid-related and stimulant-related harms (i.e., poisonings and toxicity deaths)Footnote 8 Footnote 9 Footnote 10 Footnote 11 reported through the pandemic, the survey results highlight the vulnerability of this population and suggests the need for stabilization of services in the sector.
Service providers demonstrated resilience and innovation by developing new service delivery models including new remote services that met the challenges created by the COVID-19 pandemic.
Service providers demonstrated resilience and innovation by developing new service delivery models including new remote services that met the challenges created by the COVID-19 pandemic. New approaches to service delivery were reported across the country including: mobile outreach for HIV, hepatitis C and other STI testing services; COVID-19 testing for people experiencing homelessness or living in encampments; delivery of harm reduction supplies by outreach including mobile vehicle and home delivery; and self-serve pick-up and drop-off of harm reduction supplies at service windows or curbside depots. Lessons learned from these innovations should be harnessed and shared to ensure accessibility of services continues beyond the pandemic.
Strengths and limitations
These survey findings provide a snapshot contextualizing STBBI-related service delivery during the beginning of the COVID-19 pandemic. Due to the nature of convenience sampling used in this survey, it is not possible to generalize the findings to all STBBI service providers in Canada. However, given the urgent need for this information to inform public health decision making, as well as the challenges of using probability based sampling to reach service providers, an online survey was selected as the most appropriate sampling method. These findings were based on self-reported data and it is possible that certain responses were over- or underrepresented.
Conclusion
In spite of the unprecedented public health measures in place across the country to mitigate COVID-19 transmission that affected the ability of service providers to support their communities, the survey findings show the remarkable resiliency and innovation that STBBI-related and harm reduction service providers demonstrated during the early days of the COVID-19 pandemic through their ability to respond to the needs of their clients. Through new remote service delivery models that met the challenges created by the pandemic, organizations provided a lifeline of support services to those vulnerable to exposure to both STBBI and COVID-19 infections. These findings substantiate the importance of supporting access to these services especially when public health restrictions are in place. The survey results will support a more comprehensive understanding of the impact of the COVID-19 pandemic in Canada and be used to inform policy and programs that support the health of Canadians who were unintentionally affected by the public health measures to address COVID-19 in Canada.
These findings substantiate the importance of supporting access to these services especially when public health restrictions are in place.
References
- Footnote 1
-
Public Health Agency of Canada [Internet]. Coronavirus disease 2019 (COVID-19): COVID-19 daily epidemiology update. Epidemic curve; [cited 2021 March 8]. Available from: https://health-infobase.canada.ca/covid-19/epidemiological-summary-covid-19-cases.html#a4
- Footnote 2
-
Public Health Agency of Canada COVID-19 Surveillance and Epidemiology Team. A retrospective analysis of the start of the COVID-19 epidemic in Canada, January 15-March 12, 2020. Can Commun Dis Rep [Internet]. 2020;46(7/8):236-41. Available from: https://doi.org/10.14745/ccdr.v46i78a04
- Footnote 3
-
Public Health Agency of Canada [Internet]. From risk to resilience: An equity approach to COVID-19 - Chief public health officer of Canada's report on the state of public health in Canada 2020. 2020 Oct. 86 p. Available from: https://www.canada.ca/en/public-health/corporate/publications/chief-public-health-officer-reports-state-public-health-canada/from-risk-resilience-equity-approach-covid-19.html#f5
- Footnote 4
-
Public Health Agency of Canada [Internet]. Syphilis. 2021 June. Available from: https://www.canada.ca/en/public-health/services/diseases/syphilis.html
- Footnote 5
-
Public Health Agency of Canada [Internet]. A Pan-Canadian Framework for Action. 2018 June. 25 p. Available from: https://www.canada.ca/content/dam/phac-aspc/documents/services/infectious-diseases/sexual-health-sexually-transmitted-infections/reports-publications/sexually-transmitted-blood-borne-infections-action-framework/sexually-transmitted-blood-borne-infections-action-framework.pdf
- Footnote 6
-
Centre for Addiction and Mental Health & Delvinia [Internet]. Anxiety patterns in Canadians mirror progression of pandemic; National survey series by CAMH and Delvinia tracked 2020 pandemic mental health and substance use. [2021 April 19]. Available from: https://www.camh.ca/en/camh-news-and-stories/anxiety-patterns-in-canadians-mirror-progression-of-pandemic
- Footnote 7
-
IPSOS [Internet]. COVID continues to take heavy toll on Canadians' mental health. Toronto (ON). 2021. 4 p. Available from: https://www.ipsos.com/sites/default/files/ct/news/documents/2021-02/mental_health-factum-2021-02-20-v1.pdf
- Footnote 8
-
Canadian Institute for Health Information [Internet]. Unintended consequences of COVID-19: Impact on harms caused by substance use. 2021. 20 p. Available from: https://www.cihi.ca/en/unintended-consequences-of-covid-19-impact-on-harms-caused-by-substance-use?utm_source=phac&utm_medium=site-infographic-wider-impacts-of-covid-19-en%20&utm_campaign=unintended-consequences-of-covid-19-may-2020&utm_content=harms-caused-by-substance-use-en
- Footnote 9
-
Public Health Agency of Canada [Internet]. Joint statement from the co-chairs of the special advisory committee on the epidemic of opioid overdoses - latest national data on the overdose crisis; 2021 Mar 24. Available from:
https://www.canada.ca/en/public-health/news/2021/03/joint-statement-from-the-co-chairs-of-the-special-advisory-committee-on-the-epidemic-of-opioid-overdoses--latest-national-data-on-the-overdose-crisis.html - Footnote 10
-
Public Health Agency of Canada [Internet]. Sentinel surveillance of substance-related poisonings in Canada: Spotlight on methamphetamine; 2021 Mar 26 [2021 April 19]. Available from: https://health-infobase.canada.ca/datalab/substance-related-poisonings-methamphetamine-blog.html?utm_source=Bnews&utm_medium=email&utm_campaign=launch_methamphetamine_data_blog_March_2021_ENG
- Footnote 11
-
Ontario Drug Policy Research Network, Office of the Chief Coroner for Ontario/Ontario Forensic Pathology Service, Ontario Agency for Health Protection and Promotion (Public Health Ontario), Centre on Drug Policy Evaluation. Preliminary patterns in circumstances surrounding opioid-related deaths in Ontario during the COVID-19 pandemic. Toronto, ON: Ontario Drug Policy Research Network; 2020. 24 p. Available from: https://www.publichealthontario.ca/-/media/documents/o/2020/opioid-mortality-covid-surveillance-report.pdf?la=en