West Nile virus and other mosquito-borne diseases surveillance report: Annual edition (2018)
Download the alternative format
(PDF format, 1.9 MB, 11 pages)
Organization: Public Health Agency of Canada
Date published: 2020-04-03
Related topics
On this page
- Surveillance highlights
- Introduction
- Methods
- West Nile virus
- Mosquito, wild bird and equine epidemiology
- California serogroup viruses
- Eastern equine encephalitis virus
- Discussion
- Public health conclusions
- Acknowledgements
- References
Surveillance highlights
West Nile virus
- A total of 432 human cases of West Nile virus (WNV) were reported to the Public Health Agency of Canada (PHAC). Of these, 55% (238) were reported as WNV neurological syndrome.
- Twenty-nine (29) deaths associated with WNV were reported.
- A higher number of WNV-positive birds, mosquitoes and horses were observed, when compared to the previous five years.
Eastern equine encephalitis virus
- Thirteen horses tested positive for EEEV virus but no human cases were reported.
California serogroup viruses
- A total of 72 human cases of California serogroup viruses were detected by the National Microbiology Laboratory (PHAC-NML).
Introduction
Zoonotic diseases are infectious diseases caused by bacteria, viruses and parasites that spread between animals and humans. West Nile virus (WNV) continues to be the leading cause of domestically acquired mosquito-borne disease in Canada. West Nile virus circulates between avian hosts and competent mosquito vectors. Mosquitoes may then infect a broad-range of dead-end hosts (i.e., not able to transmit the disease further) including humans, horses, other mammals, and amphibians. As a result, surveillance efforts of mosquito-borne diseases require a One Health approach that recognizes the health of humans is interconnected to animals and the environment. In addition to describing the human health burden of WNV, this report will demonstrate the efforts made to strengthen animal health surveillance in collaboration with multi-disciplinary health partners with the goal of achieving optimal human health outcomes.
Methods
Human cases of WNV in Canada are reported voluntarily to the Public Health Agency of Canada (PHAC) by provincial/territorial health ministries/agencies and Canadian Blood Services (CBS)/Héma-Québec, via the Canadian WNV Surveillance Program. Across Canada, human cases are classified using the national surveillance case definition. Further information about the WNV case definition can be found on Canada.ca.
In addition, non-human data on early indicators of WNV activity in Canada are collected. Information on WNV-positive dead wild birds are provided by the Canadian Wildlife Health Cooperative (CWHC ), as well as some provinces that also provide this data. The Canadian Food Inspection Agency (CFIA) collects data on WNV-positive horses. Mosquito pool surveillance data is collected and provided by participating provinces (Saskatchewan, Manitoba, Ontario, and Québec).
Other mosquito-borne diseases, such as California serogroup viruses (CSGV) (e.g., Jamestown Canyon virus, snowshoe hare virus, La Crosse virus) and eastern equine encephalitis virus (EEEV), are known to be present in Canada. Testing for these viruses is conducted by the National Microbiology Laboratory (NML-PHAC), when requested on patient samples. Contrary to WNV, which has an established surveillance system, there is no formal surveillance system for CSGV or EEEV. As a result, there is no national case definition for CSGV. Human cases may indicate acute infection, past exposure or cross-reactivity with other flaviviruses, such as Japanese encephalitis, Zika, dengue, and yellow fever.
This report is based on the latest data provided to PHAC for the 2018 transmission season (data extraction: 2019-08-12). Data are subject to change as new information is received. Furthermore, data collection methods and case definitions may vary within Canada.
West Nile virus
Human epidemiology
A total of 432 WNV human cases were reported to PHAC during the 2018 season. The cases were reported across six provinces including Québec (n=206), Ontario (n=139), Manitoba (n=34), Saskatchewan (n=3), Alberta (n=49), and Prince Edward Island (n=1). The majority of cases were geographically distributed in the southern regions of these provinces (Figure 1). Approximately 4% of the cases reported to PHAC (n=18) were associated with travel outside of the reporting province, some of which were associated with travel outside of Canada. Travel history is not always provided and therefore reported cases may not represent location of acquisition, which is of note, particularly in regions where WNV is not endemic.
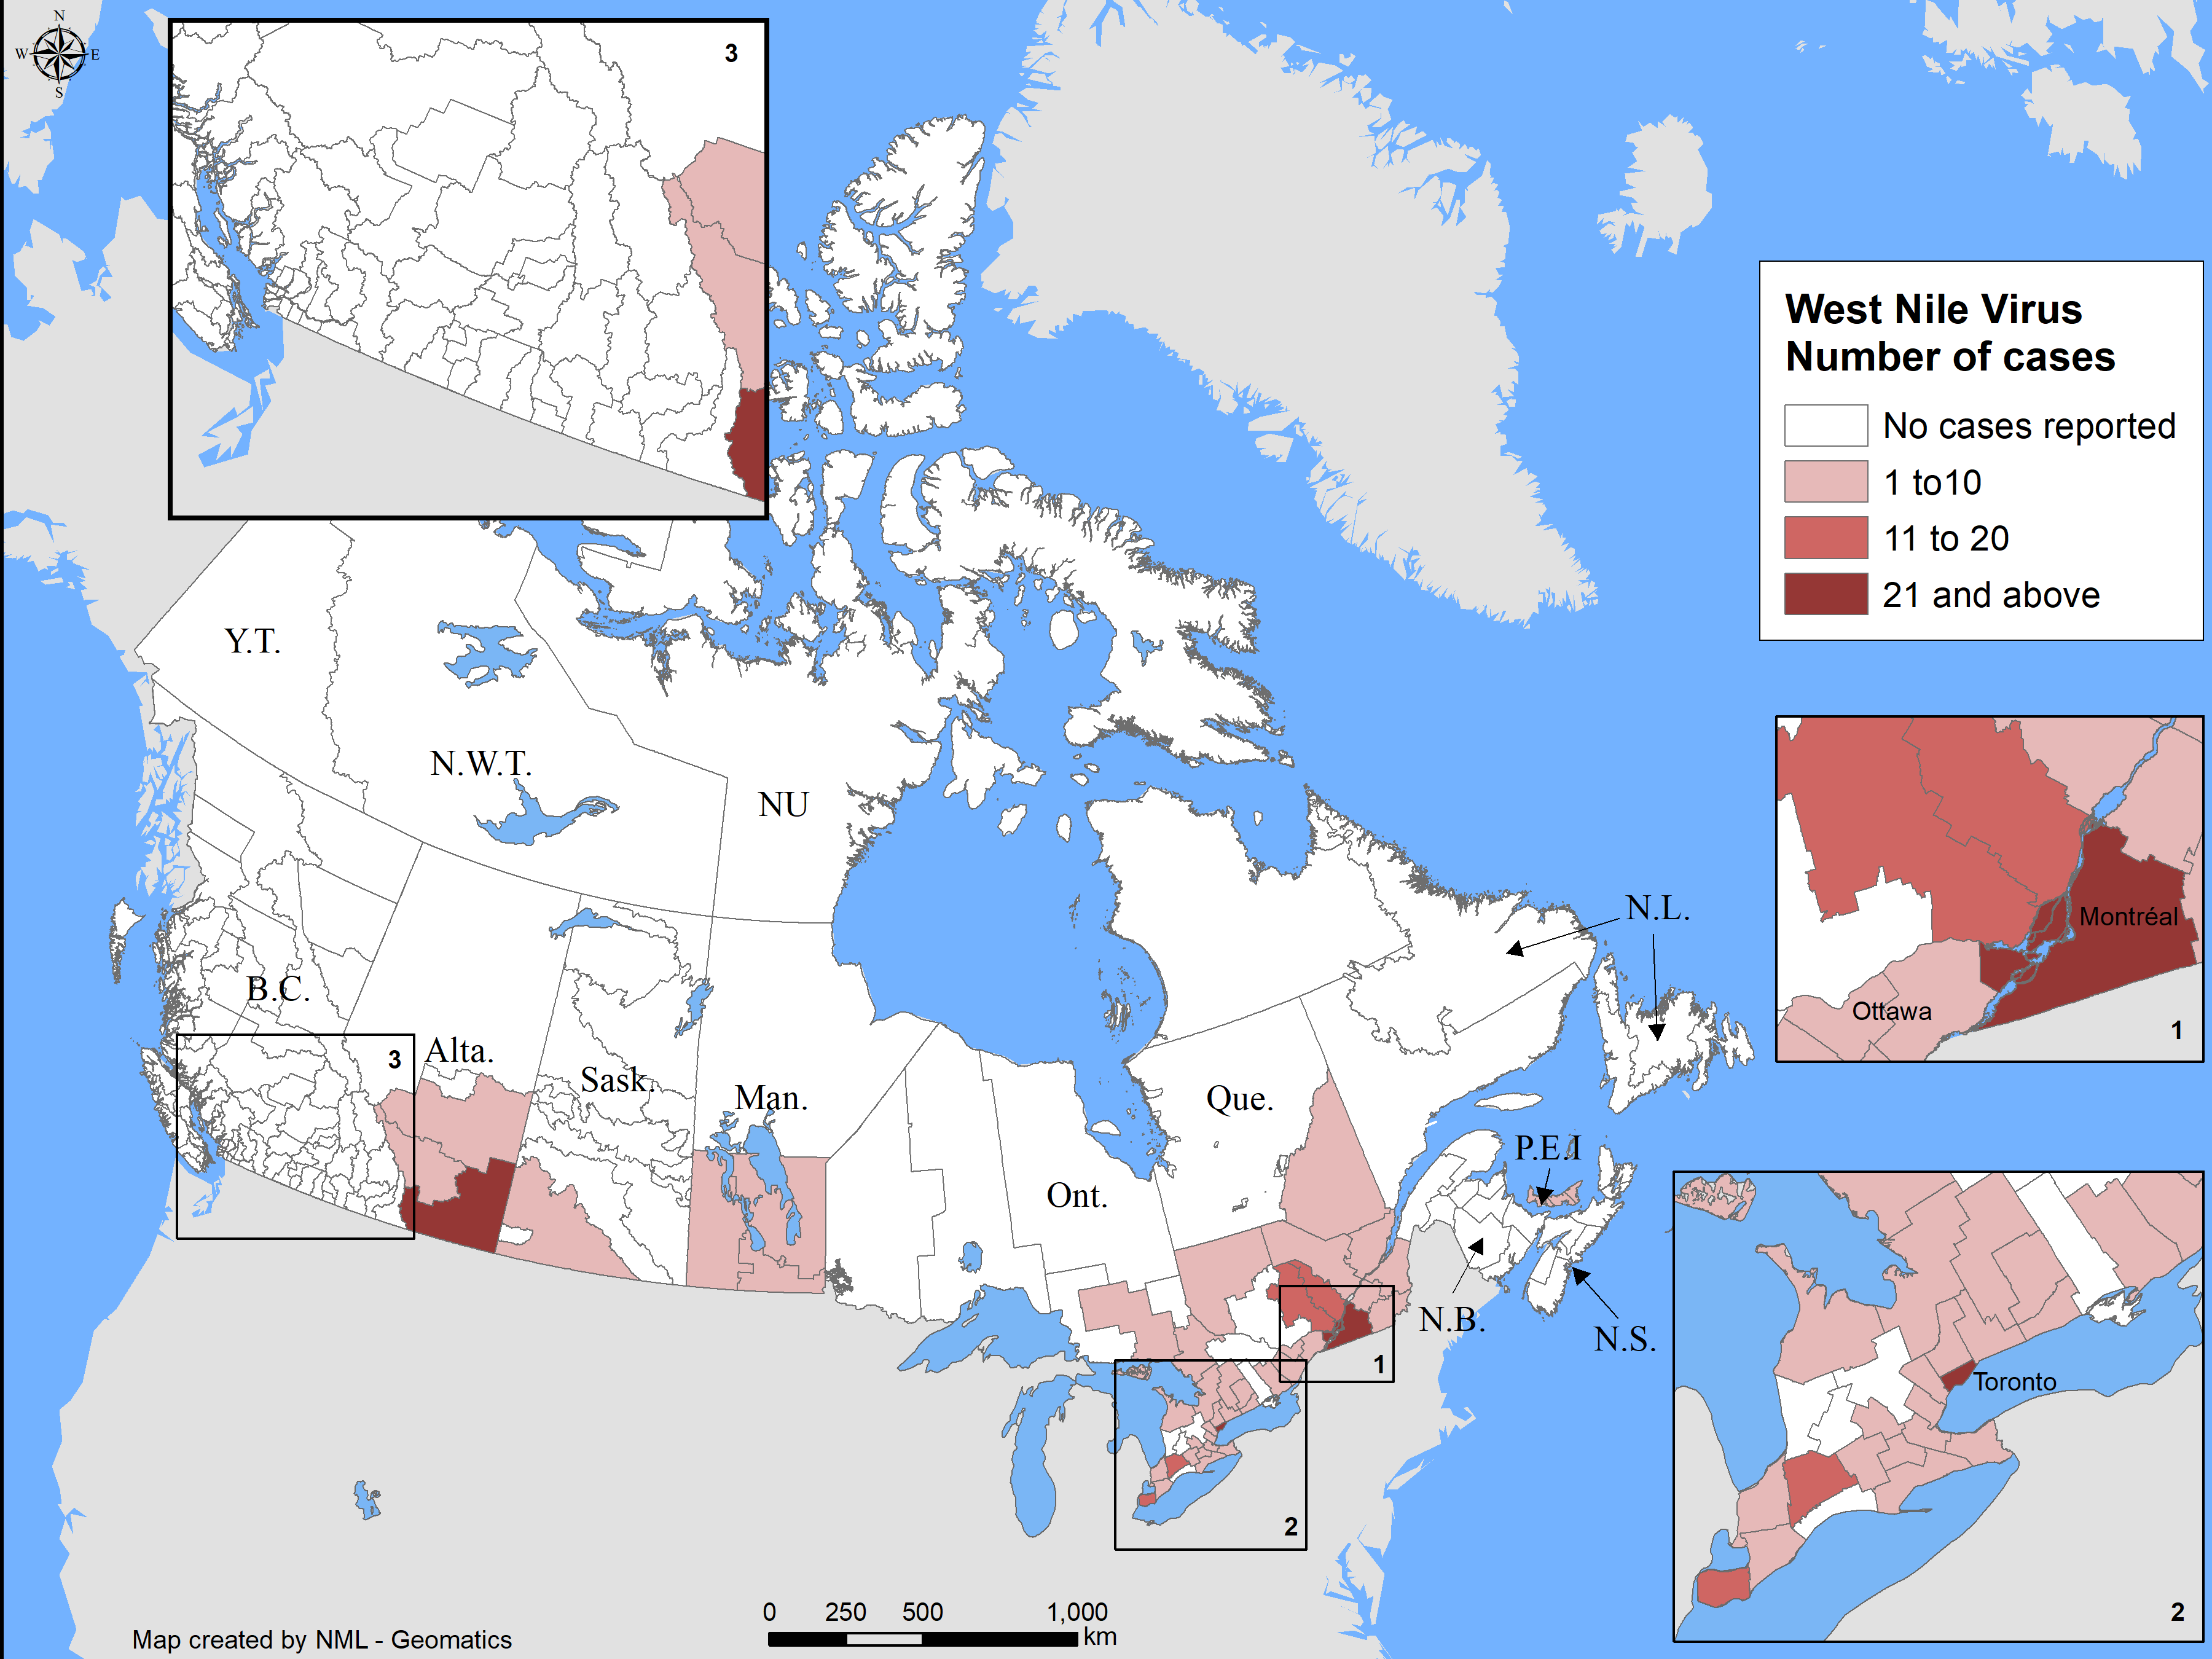
Figure 1 - Text Equivalent
| Province/Territory | Human Infections (n) |
|---|---|
| Alberta | 49 |
| Saskatchewan | 3 |
| Manitoba | 34 |
| Ontario | 139 |
| Québec | 206 |
| Prince Edward Island | 1 |
| Canada | 432 |
In Canada, the earliest WNV human case in 2018 occurred with an onset date between April 22-28, 2018 in Québec (surveillance week 17). A peak number of cases (approximately 50%) were reported with episode dates between August 12 to September 1, 2018, corresponding with surveillance weeks 34 and 35 (Figure 2). The time period of the peak is consistent with previous seasons (Figure 3). However, acquisition of infection would be earlier as individuals bitten by a WNV-infected mosquito develop symptoms 2 to 14 days later. In addition, when episode dates rely on diagnosis date, laboratory sample date or reporting date (when symptom onset dates are otherwise absent), this further increases the time interval from infection acquisition to the recorded episode date.
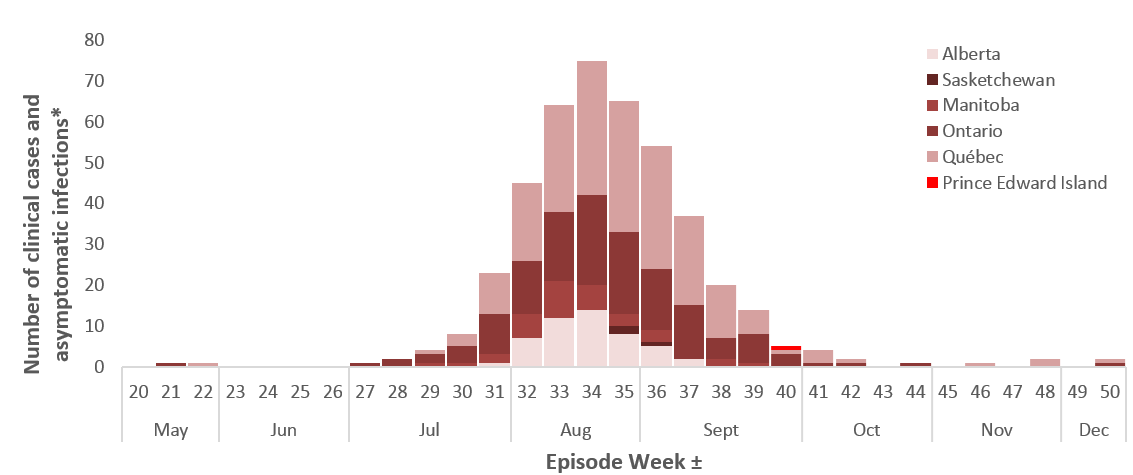
Figure 2 - Text Equivalent
| Episode (surveillance) WeekFootnote ± | Province | ||||||
|---|---|---|---|---|---|---|---|
| Ontario | Québec | Alberta | Manitoba | SaskatchewanFootnote * | Prince Edward Island | ||
| May | 20 | 0 | 0 | 0 | 0 | 0 | 0 |
| 21 | 1 | 0 | 0 | 0 | 0 | 0 | |
| 22 | 0 | 1 | 0 | 0 | 0 | 0 | |
| June | 23 | 0 | 0 | 0 | 0 | 0 | 0 |
| 24 | 0 | 0 | 0 | 0 | 0 | 0 | |
| 25 | 0 | 0 | 0 | 0 | 0 | 0 | |
| 26 | 0 | 0 | 0 | 0 | 0 | 0 | |
| July | 27 | 1 | 0 | 0 | 0 | 0 | 0 |
| 28 | 2 | 0 | 0 | 0 | 0 | 0 | |
| 29 | 2 | 1 | 0 | 1 | 0 | 0 | |
| 30 | 4 | 3 | 0 | 1 | 0 | 0 | |
| 31 | 10 | 10 | 1 | 2 | 0 | 0 | |
| August | 32 | 13 | 19 | 7 | 6 | 0 | 0 |
| 33 | 17 | 26 | 12 | 9 | 0 | 0 | |
| 34 | 22 | 33 | 14 | 6 | 0 | 0 | |
| 35 | 20 | 32 | 8 | 3 | 2 | 0 | |
| September | 36 | 15 | 30 | 5 | 3 | 1 | 0 |
| 37 | 13 | 22 | 2 | 0 | 0 | 0 | |
| 38 | 5 | 13 | 0 | 2 | 0 | 0 | |
| 39 | 7 | 6 | 0 | 1 | 0 | 0 | |
| 40 | 3 | 1 | 0 | 0 | 0 | 1 | |
| October | 41 | 1 | 3 | 0 | 0 | 0 | 0 |
| 42 | 1 | 1 | 0 | 0 | 0 | 0 | |
| 43 | 0 | 0 | 0 | 0 | 0 | 0 | |
| 44 | 1 | 0 | 0 | 0 | 0 | 0 | |
| November | 45 | 0 | 0 | 0 | 0 | 0 | 0 |
| 46 | 0 | 1 | 0 | 0 | 0 | 0 | |
| 47 | 0 | 0 | 0 | 0 | 0 | 0 | |
| 48 | 0 | 2 | 0 | 0 | 0 | 0 | |
| December | 49 | 0 | 0 | 0 | 0 | 0 | 0 |
| 50 | 1 | 1 | 0 | 0 | 0 | 0 | |
| Total | 139 | 205 | 49 | 34 | 3 | 1 | |
|
|||||||
The number of human cases observed in 2018 represents the highest number of cases reported in each of the preceding five seasons (2013 – 2017) (Figure 3). Compared with 2017 there was a 2.1 fold increase in the number of human cases reported to PHAC for 2018. The largest increase was observed in Québec (7.6-fold), followed by Alberta (7.1-fold), and Manitoba (6.8-fold). In both Ontario and Saskatchewan, the number of cases was similar between 2017 and 2018.
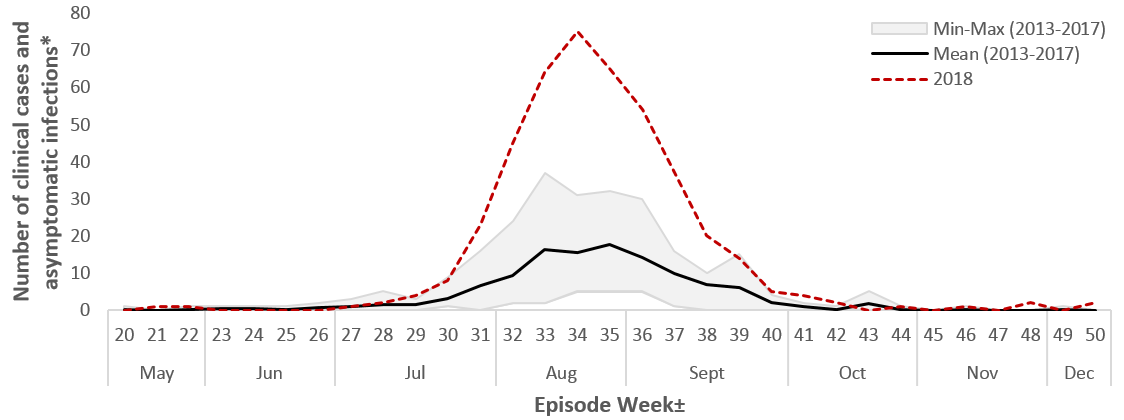
Figure 3 - Text Equivalent
| Episode (surveillance) WeekFootnote ± | Mean (2013-2017) | Min-Max (2013-2017) | 2018 | |
|---|---|---|---|---|
| May | 20 | 0.2 | 1 | 0 |
| 21 | 0 | 0 | 1 | |
| 22 | 0 | 1 | 1 | |
| June | 23 | 0 | 1 | 0 |
| 24 | 0 | 1 | 0 | |
| 25 | 0 | 1 | 0 | |
| 26 | 1 | 2 | 0 | |
| July | 27 | 1 | 3 | 1 |
| 28 | 2 | 5 | 2 | |
| 29 | 1 | 3 | 4 | |
| 30 | 3 | 3 | 8 | |
| 31 | 7 | 16 | 23 | |
| August | 32 | 9.4 | 22 | 45 |
| 33 | 16 | 35 | 64 | |
| 34 | 15 | 26 | 75 | |
| 35 | 18 | 27 | 65 | |
| September | 36 | 14.2 | 25 | 54 |
| 37 | 9.8 | 15 | 37 | |
| 38 | 6.8 | 10 | 20 | |
| 39 | 6 | 15 | 14 | |
| 40 | 2 | 4 | 5 | |
| October | 41 | 1 | 2 | 4 |
| 42 | 0 | 1 | 2 | |
| 43 | 2 | 5 | 0 | |
| 44 | 0.2 | 1 | 1 | |
| November | 45 | 0 | 0 | 0 |
| 46 | 0 | 1 | 1 | |
| 47 | 0 | 0 | 0 | |
| 48 | 0 | 0 | 2 | |
| December | 49 | 0.2 | 1 | 0 |
| 50 | 0 | 0 | 2 | |
|
||||
Of the 432 cases (both confirmed and probable), 55% (n=238) were classified as WNV neurological syndrome, 31% (n=132) as non-neurological syndrome, 8% (n=34) as unclassified/unspecified, and 6% (n=28) as asymptomatic. Among these cases, 29 WNV-associated deaths were reported in Canada, 93% of which were classified as neurological syndrome.
| Province | Clinical cases | Asymptomatic infections Footnote 1 | Total | Rate (per 100,000) Footnote 2 | ||
|---|---|---|---|---|---|---|
| Neurological | Non-neurological | Unclassified/Unspecified | ||||
| Alberta | 7 | 37 | 0 | 5 | 49 | 1.17 |
| Saskatchewan Footnote 3 | 3 | - | - | 0 | 3 | 0.26 |
| Manitoba | 14 | 18 | 0 | 2 | 34 | 1.78 |
| Ontario | 60 | 38 | 30 | 11 | 139 | 0.97 |
| Quebec | 154 | 39 | 3 | 10 | 206 | 2.47 |
| Prince Edward Island | 0 | 0 | 1 | 0 | 1 | 0.65 |
| Canada | 238 [55%] | 132 [31%] | 34 [8%] | 28 [6%] | 432 [100%] | 1.17 |
|
||||||
In 2018, the incidence rate of reported cases (clinical and asymptomatic) increased with age, and was higher for males than females in those ≥ 50 years of age. For both sexes, the age group with the highest rate was those age 70 years or older (Figure 4).
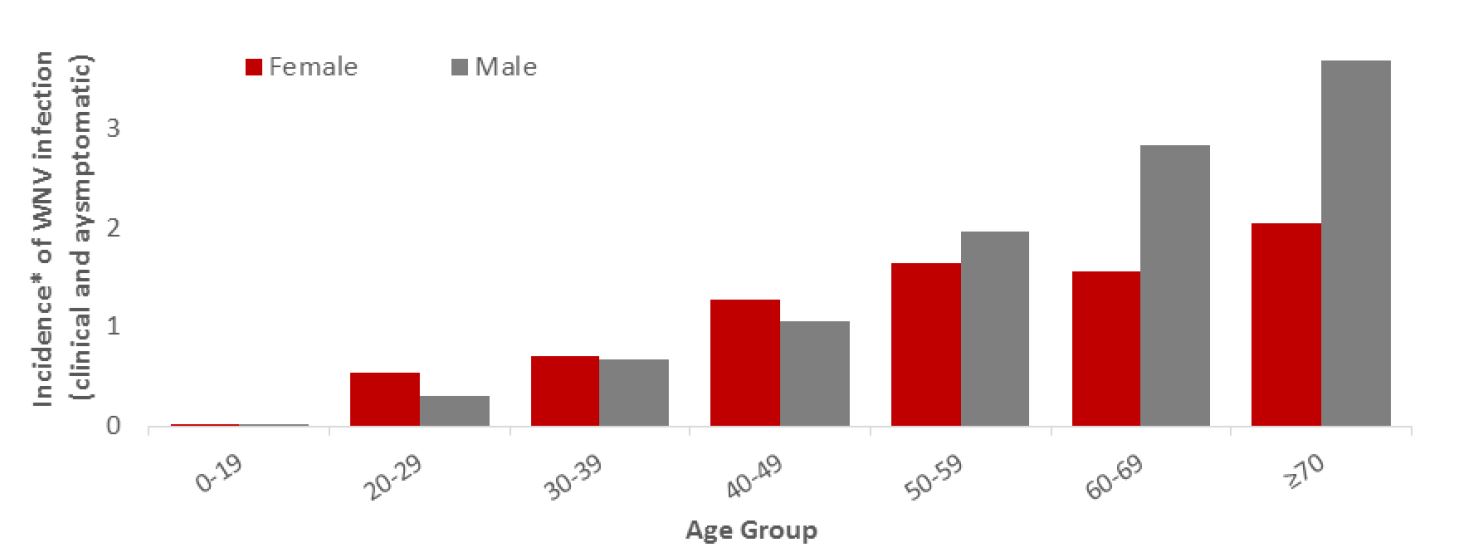
Figure 4 - Text Equivalent
| Age group | Female incidence rate | Male incidence rate | |||||
|---|---|---|---|---|---|---|---|
| 0-19 | 0.03 | 0.02 | |||||
| 20-29 | 0.54 | 0.31 | |||||
| 30-39 | 0.71 | 0.67 | |||||
| 40-49 | 1.29 | 1.05 | |||||
| 50-59 | 1.65 | 1.97 | |||||
| 60-69 | 1.57 | 2.82 | |||||
| ≥70 | 2.05 | 3.68 | |||||
|
|||||||
Mosquito, wild bird and equine epidemiology
During the 2018 transmission season, 19,114 mosquito pools were tested for WNV in four provinces: Québec (n=1,769), Ontario (n=14,648), Manitoba (n=1,924), and Saskatchewan (n=773). Of these, 571 (3.0%) tested positive for WNV: 46 in Québec, 305 in Ontario, 168 in Manitoba, and 52 in Saskatchewan (Table 2). In 2018, the percent of mosquito pools positive for WNV infection was highest in Manitoba (8.7%) and Saskatchewan (6.7%). Similar to human cases, percent positivity for tested mosquitoes was highest in 2018 (3.0%), compared to the average of the previous five years (1.9%) (Figure 5).
The CWHC tested 323 dead wild birds for WNV. Of these, 170 (53%) were positive for WNV across nine provinces (Table 3, Figure 5). Overall, WNV activity was detected in dead wild birds from June to late October in Canada. West Nile virus positive birds were identified in a greater number of provinces than previously observed in the last decade, including three Maritime Provinces.
The CFIA was notified of 123 cases of WNV in domestic horses in the following six provinces: British Columbia (n=1), Alberta (n=72), Saskatchewan (n=32), Manitoba (n=5), Ontario (n=11) and Québec (n=2) (Table 3). This is the highest number observed in Canada since 2003 (Figure 5).
| Province | Positive pools | Total pools tested | Percent positive |
|---|---|---|---|
| Saskatchewan | 52 | 773 | 6.7 % |
| Manitoba | 168 | 1,924 | 8.7 % |
| Ontario | 305 | 14,648 | 2.1 % |
| Québec | 46 | 1,769 | 2.6 % |
| Total | 571 | 19,114 | 3.0 % |
|
|||
| Province | No. of positive birds [%] | No. of positive horses [%] |
|---|---|---|
| British Columbia | 3 [2%] | 1 [<1%] |
| Alberta | 1 [<1%] | 72 [59%] |
| Saskatchewan | 5 [3%] | 32 [26%] |
| Manitoba | 36 [21%] | 5 [4%] |
| Ontario | 41 [24%] | 11 [9%] |
| Québec | 73 [43%] | 2 [<1%] |
| New Brunswick | 3 [2%] | 0 [0%] |
| Nova Scotia | 3 [2%] | 0 [0%] |
| Prince Edward Island | 5 [3%] | 0 [0%] |
| Total | 170 [100%] | 123 [100%] |
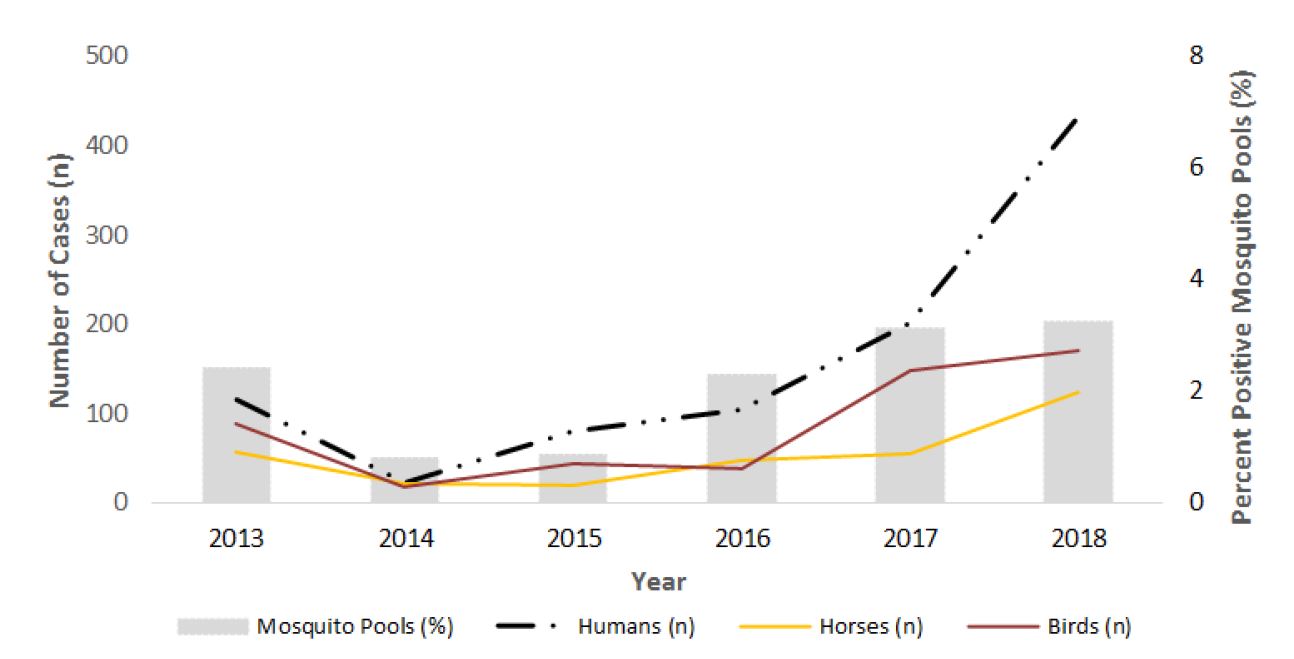
Figure 5 - Text Equivalent
| Year | 2013 | 2014 | 2015 | 2016 | 2017 | 2018 |
|---|---|---|---|---|---|---|
| Humans (n) | 115 | 21 | 80 | 104 | 200 | 432 |
| Horses (n) | 56 | 21 | 19 | 46 | 54 | 123 |
| Birds (n) | 87 | 18 | 44 | 37 | 147 | 169 |
| Positive mosquito pools (%) | 2.4 | 0.8 | 0.86 | 2.28 | 3.13 | 3.25 |
California serogroup viruses
The NML detected 72 cases California serogroup (CSG) viruses in seven provinces during the 2018 season (Table 4). Of these, the majority (67%) were further characterized as Jamestown Canyon virus (JCV), 11% were snowshoe hare virus and the remainder (22%) were unclassified. In 2017, a total of 122 cases of CSGV were identified, 73% which were identified as JCV.
| Province | No. of human cases [%] |
|---|---|
| Alberta | 1 [1%] |
| Saskatchewan | 5 [7%] |
| Manitoba | 3 [4%] |
| Ontario | 10 [14%] |
| Québec | 45 [63%] |
| Nova Scotia | 3 [4%] |
| New Brunswick | 5 [7%] |
| Canada | 72 [100%] |
Eastern equine encephalitis virus
In 2018, the CFIA reported 13 horses testing positive for the EEEV. No human cases of EEEV were reported in Canada.
The last report of an EEEV human case occurred in Ontario in 2016.
Discussion
In 2018, 432 WNV human cases were reported to PHAC, the highest yearly total since 2007. Furthermore, 29 WNV-associated deaths occurred in Canada in 2018 which is higher than the yearly average of four in the preceding five years (2013 – 2017). The high number of WNV human cases in 2018 may be attributed to several factors, including favourable weather conditions (temperature and precipitation) affecting mosquito abundance and activity, the immunological status of the wild bird populations that are the natural animal hosts of WNV, and human exposure to WNV-infected mosquito bites. Another significant result to note is the widespread impact of WNV infection in birds and horses across multiple jurisdictions. The detection of WNV-positive birds in the Maritime Provinces for the first time is particularly noteworthy.
A large number of WNV infections were also seen in jurisdictions outside of Canada. The United States Centers for Disease Control and Prevention (CDC) reported a total of 2,647 cases of WNV infection in humans in 2018, the highest number of WNV infections in humans reported since 2012Footnote 1. Similarly, the European Centre for Disease Control (ECDC) reported an unusually large number of WNV infections in humans in 2018, noting a 3.4- fold increase, compared to the previous 2017 season (n=1,240)Footnote 2. According to the ECDC, this suggests a high level of virus circulation in affected countriesFootnote 2.
The overall rate of reported WNV cases in humans during the 2018 season was 1.17 per 100,000 in Canada. Québec and Manitoba experienced the highest rates of WNV infection in Canada. However, due to possible variability in surveillance and reporting of human cases, we cannot conclude that risk of WNV is lower in other provinces. Underreporting is common with WNV, as many cases are asymptomatic, and would not be captured within the WNV passive surveillance system. Published literature reports indicate that for every case of WNV neurological syndrome that occurs, there may be as many as 150 WNV infections in humansFootnote 3,Footnote 4,Footnote 5. With 238 WNV neurological cases in 2018, this estimate would amount to approximately 35,700 WNV infections in humans for 2018.
In Canada, fewer CSGV cases were reported in 2018, compared to 2017, despite the increase in the number of WNV cases observed in 2018. However, some of the mosquito species that are competent vectors for CSGV are different from those for WNV, and may have responded differently to the weather in 2018. California serogroup viruses may be under-detected in Canada as there is no formal surveillance system in place to monitor, track and report cases, and the decrease in cases from 2017 to 2018 may reflect variations in data collection and testing practices.
Public health conclusions
West Nile virus continues to be the leading cause of domestically acquired mosquito-borne illness and death in Canadians. The use of multi-species surveillance for WNV and other mosquito-borne diseases (MBD) is desirable to i) assess risk to the public; ii) provide the data that will support development of disease forecasting; and iii) provide understanding of disease transmission needed to predict future trajectories of these diseases, all of which ultimately inform public health action for prevention.
As there is no specific treatment or vaccine for WNV, patients are treated for their symptoms. Advanced age is one of the most important risk factors for severe neurological disease after infection with WNVFootnote 6. In some cases, patients who develop severe neurological illness demonstrate slow recovery and significant long-term sequelae (e.g., muscle weakness, fatigue, headache, and effects on cognitive function)Footnote 6. Further collaboration with surveillance partners and healthcare practitioners to determine long-term health impacts of WNV and other MBD in patients is needed.
Because of the serious and sometimes fatal consequences of WNV infection and lack of treatment, it is important to focus on prevention strategies. The best way to avoid becoming infected with WNV and other MBD is to prevent mosquito bites, by covering exposed skin, using insect repellent and/or other forms of mosquito control. Refer to West Nile virus for more information on populations-at-risk, symptoms and treatment.
Acknowledgements
The Public Health Agency of Canada would like to acknowledge the provincial and territorial WNV and other mosquito-borne disease programs, Canadian Blood Services (CBS)/Héma-Québec, the Canadian Wildlife Health Cooperative (CWHC), and the Canadian Food Inspection Agency (CFIA) for their participation to the Canadian WNV Surveillance Program.
References
- Footnote 1
-
Center for Disease Control. Final Cumulative Maps & Data for 1999-2017 [Internet]. 13 June 2019 [cited 09 August 2019]. Available from: https://www.cdc.gov/westnile/statsmaps/cumMapsData.html
- Footnote 2
-
European Centre for Disease Prevention and Control. Unusual large number of West Nile virus infections in the EU/EEA and EU neighbouring countries [Internet]. 31 August 2018 [cited 28 May 2019]. Available from: https://ecdc.europa.eu/en/news-events/unusual-large-number-west-nile-virus-infections-eueea-and-eu-neighbouring-countries
- Footnote 3
-
Zheng, H., Drebot, M. A., & Coulthart, M. B. (2014). West Nile virus in Canada: ever-changing, but here to stay. Canada communicable disease report = Releve des maladies transmissibles au Canada, 40(10), 173-177.
- Footnote 4
-
Busch MP, Wright DJ, Custer B, et al. West Nile virus infections projected from blood donor screening data, United States, 2003. Emerg Infect Dis. 2006;12:395-402.
- Footnote 5
-
Carson PJ, Borchardt SM, Custer B, et al. Neuroinvasive disease and West Nile virus infection, North Dakota, USA, 1999-2008. Emerg Infect Dis. 2012;18:684-6.
- Footnote 6
-
Drebot MA, Lindsay R, Barker IK, et al. West Nile virus surveillance and diagnostics: A Canadian perspective. Can J Infect Dis. 2003; 14(2):105-114.