
West Nile Virus and Other Mosquito-Borne Diseases National Surveillance Report - June 25 to July 1, 2017 (Week 26)
Alternative Formats
Related Topics
West Nile virus
Canada
Humans
As of surveillance week 26, ending on July 1, 2017, the Public Health Agency of Canada (PHAC) has not been informed of any human cases of West Nile virus by provinces and territories since the beginning of the 2017 season in Canada.
Mosquitoes
In week 26 there have been 5 positive tests of West Nile Virus, 3 from Ontario (Peel Regional (1), Toronto (1), and Windsor-Essex County (1)), and 2 from Manitoba (Winnipeg (1), Southern (1)). As of initial surveillance, PHAC has received 2,284 mosquito pools data tested for West Nile virus in Canada. All were reported in Ontario and Manitoba.
Birds
The Canadian Wildlife Health Cooperative has tested 6 dead birds for West Nile virus: one in Saskatchewan, four in Ontario, and one in Quebec. Of these, three were positive for WNV and all were reported in Campbellsville, Ontario.
Domestic Animals
The Canadian Food Inspection Agency has not reported any domestic animals tested positive for West Nile virus since the beginning of the 2017 season.
United States and U.S. territories
As of July 1, 2017, there are no human cases of West Nile virus in the United States and U.S territories, reported by the Centers for Disease Control and Prevention.
Detailed information can be accessed via the CDC web site.
Europe and Neighbouring Countries
As of July 1, 2017, there are no human cases of West Nile virus reported in the European Union and neighbouring countries.
Detailed information can be accessed via the ECDC web site.
Other Mosquito-borne Diseases
Canada
Eastern Equine Encephalitis virus:
No human cases of eastern equine encephalitis virus have been reported to the Public Health Agency of Canada since the 2017 season.
California Serogroup virus:
During surveillance week 26, no human cases/exposures of California serogroup virus were diagnosed by the National Microbiology Laboratory in the Public Health Agency of Canada.
Since January 1, 2017, 9 human cases of laboratory-confirmed cases/exposures of California serogroup virus were diagnosed by the National Microbiology Laboratory in Canada: Alberta (2), Saskatchewan (1), and Quebec (6). Of these cases, four were further classified as Jamestown Canyon virus and the rest as unknown.
Figure 1: Geographic distribution of West Nile virus human clinical cases in Canada, as of July 1, 2017
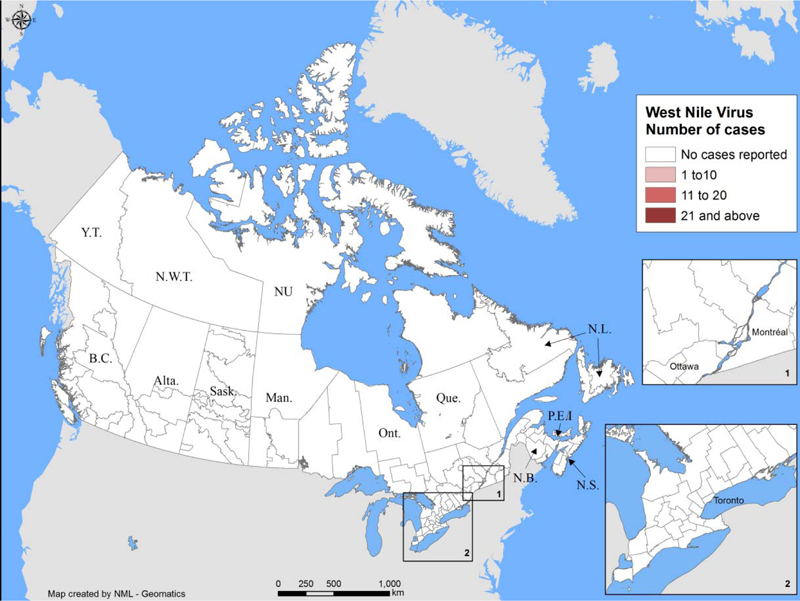
Figure 1: Text Equivalent
Map showing geographic distribution of human clinical cases of WNV in Canada.
As of surveillance week 26, ending July 1, 2017, there are no human clinical cases of WNV in Canada.
FIGURE 2: West Nile virus human clinical cases and asymptomatic infections by province/ territory and by report week, as of July 1, 2017
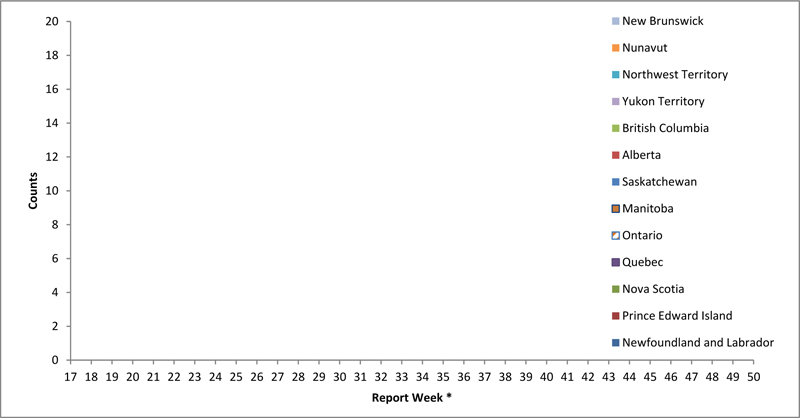
*West Nile virus clinical cases and asymptomatic infections are grouped by report week, based on episode date. Episode date could include one of the following: onset date, diagnosis date, lab sample date or reporting date.
Figure 2: Text Equivalent
As of week 26, ending July 1, 2017, there are no West Nile virus human clinical cases and asymptomatic infections in Canada.
| Week 26: June 25 to July 1, 2017 | ||||||
|---|---|---|---|---|---|---|
| West Nile virus neurological syndrome | West Nile virus non-neurological syndrome | Unclassified/ unspecified |
Total clinical cases | Number of travel-related cases | West Nile virus asymptomatic infection | |
| Newfoundland and Labrador | 0 | 0 | 0 | 0 | 0 | 0 |
| Prince Edward Island | 0 | 0 | 0 | 0 | 0 | 0 |
| Nova Scotia | 0 | 0 | 0 | 0 | 0 | 0 |
| New Brunswick | 0 | 0 | 0 | 0 | 0 | 0 |
| Quebec | 0 | 0 | 0 | 0 | 0 | 0 |
| Ontario | 0 | 0 | 0 | 0 | 0 | 0 |
| Manitoba | 0 | 0 | 0 | 0 | 0 | 0 |
| Saskatchewan | 0 | 0 | 0 | 0 | 0 | 0 |
| Alberta | 0 | 0 | 0 | 0 | 0 | 0 |
| British Columbia | 0 | 0 | 0 | 0 | 0 | 0 |
| Yukon Territory | 0 | 0 | 0 | 0 | 0 | 0 |
| Northwest Territory | 0 | 0 | 0 | 0 | 0 | 0 |
| Nunavut | 0 | 0 | 0 | 0 | 0 | 0 |
FIGURE 3: West Nile virus human clinical cases and asymptomatic infections by report week for selected years, in Canada
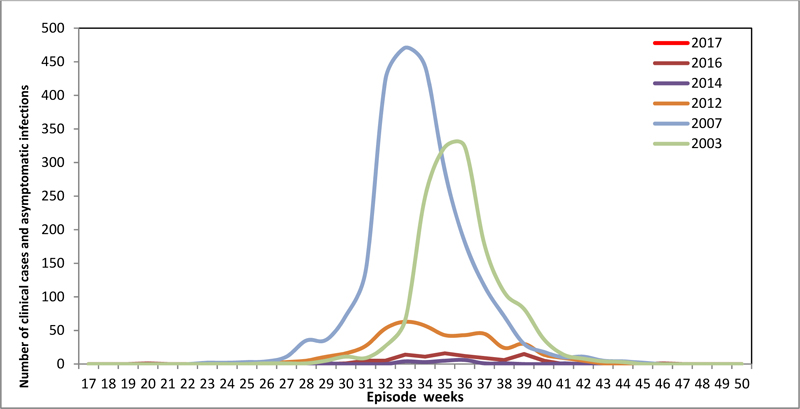
Figure 3: Text Equivalent
| Report Week | |||||||||||||||||||||||||||||||||||
|---|---|---|---|---|---|---|---|---|---|---|---|---|---|---|---|---|---|---|---|---|---|---|---|---|---|---|---|---|---|---|---|---|---|---|---|
| 17 | 18 | 19 | 20 | 21 | 22 | 23 | 24 | 25 | 26 | 27 | 28 | 29 | 30 | 31 | 32 | 33 | 34 | 35 | 36 | 37 | 38 | 39 | 40 | 41 | 42 | 43 | 44 | 45 | 46 | 47 | 48 | 49 | 50 | Total | |
| 2017 | 0 | 0 | 0 | 0 | 0 | 0 | 0 | 0 | 0 | 0 | |||||||||||||||||||||||||
| 2016 | 0 | 0 | 0 | 0 | 0 | 0 | 0 | 0 | 0 | 0 | 0 | ||||||||||||||||||||||||
| 2015 | 0 | 0 | 0 | 0 | 0 | 0 | 0 | 0 | 0 | 0 | 0 | 1 | 1 | 2 | 1 | 0 | 2 | 7 | 4 | 8 | 9 | 11 | 4 | 8 | 11 | 8 | 4 | 0 | 1 | 0 | 0 | 0 | 0 | 0 | 82 |
| 2013 | 0 | 0 | 0 | 0 | 0 | 1 | 1 | 0 | 0 | 0 | 1 | 2 | 2 | 5 | 5 | 6 | 9 | 10 | 21 | 16 | 14 | 12 | 7 | 2 | 1 | 0 | 1 | 1 | 0 | 0 | 0 | 0 | 0 | 1 | 118 |
| 2012 | 0 | 0 | 0 | 0 | 0 | 0 | 1 | 0 | 0 | 0 | 3 | 5 | 11 | 16 | 27 | 53 | 63 | 57 | 43 | 43 | 45 | 24 | 30 | 14 | 9 | 5 | 1 | 0 | 0 | 0 | 0 | 0 | 0 | 0 | 450 |
| 2007 | 0 | 0 | 0 | 0 | 0 | 0 | 2 | 2 | 3 | 4 | 11 | 35 | 36 | 72 | 139 | 424 | 471 | 443 | 287 | 182 | 116 | 71 | 30 | 18 | 10 | 11 | 5 | 4 | 2 | 0 | 0 | 0 | 0 | 0 | 2378 |
| Week 26: June 25 to July 1, 2017 | ||||||
|---|---|---|---|---|---|---|
| West Nile virus neurological syndrome | West Nile virus non-neurological syndrome | Unclassified/ unspecified |
Total clinical casestable 1 Footnote 1 | Number of travel-related casestable 1 Footnote 2 | West Nile virus asymptomatic infectiontable 1 Footnote 3 | |
| Newfoundland and Labrador | 0 | 0 | 0 | 0 | 0 | 0 |
| Prince Edward Island | 0 | 0 | 0 | 0 | 0 | 0 |
| Nova Scotia | 0 | 0 | 0 | 0 | 0 | 0 |
| New Brunswick | 0 | 0 | 0 | 0 | 0 | 0 |
| Quebec | 0 | 0 | 0 | 0 | 0 | 0 |
| Ontario | 0 | 0 | 0 | 0 | 0 | 0 |
| Manitoba | 0 | 0 | 0 | 0 | 0 | 0 |
| Saskatchewan | 0 | 0 | 0 | 0 | 0 | 0 |
| Alberta | 0 | 0 | 0 | 0 | 0 | 0 |
| British Columbia | 0 | 0 | 0 | 0 | 0 | 0 |
| Yukon Territory | 0 | 0 | 0 | 0 | 0 | 0 |
| Northwest Territory | 0 | 0 | 0 | 0 | 0 | 0 |
| Nunavut | 0 | 0 | 0 | 0 | 0 | 0 |
| Total | 0 | 0 | 0 | 0 | 0 | 0 |
| Year to date: January 1 to July 1, 2017 | ||||||
| Newfoundland and Labrador | 0 | 0 | 0 | 0 | 0 | 0 |
| Prince Edward Island | 0 | 0 | 0 | 0 | 0 | 0 |
| Nova Scotia | 0 | 0 | 0 | 0 | 0 | 0 |
| New Brunswick | 0 | 0 | 0 | 0 | 0 | 0 |
| Quebec | 0 | 0 | 0 | 0 | 0 | 0 |
| Ontario | 0 | 0 | 0 | 0 | 0 | 0 |
| Manitoba | 0 | 0 | 0 | 0 | 0 | 0 |
| Saskatchewan | 0 | 0 | 0 | 0 | 0 | 0 |
| Alberta | 0 | 0 | 0 | 0 | 0 | 0 |
| British Columbia | 0 | 0 | 0 | 0 | 0 | 0 |
| Yukon Territory | 0 | 0 | 0 | 0 | 0 | 0 |
| Northwest Territory | 0 | 0 | 0 | 0 | 0 | 0 |
| Nunavut | 0 | 0 | 0 | 0 | 0 | 0 |
| Total | 0 | 0 | 0 | 0 | 0 | 0 |
Table 1 Footnotes
|
||||||
| Province | Year to date: January 1 to July 1, 2017 | ||
|---|---|---|---|
| Number of positive mosquito pools | Number of mosquito pools tested | Percentage of positive mosquito pools (%) | |
| Quebec | - | - | - |
| Ontario | 3 | 2160 | 0.14 |
| Manitoba | 2 | 124 | 1.6 |
| Saskatchewan | - | - | - |
| Alberta | - | - | - |
| British Columbia | - | - | - |
| Newfoundland and Labrador | - | - | - |
| Prince Edward Island | - | - | - |
| Nova Scotia | - | - | - |
| New Brunswick | - | - | - |
| Yukon Territory | - | - | - |
| Northwest Territory | - | - | - |
| Nunavut | - | - | - |
| Total | 5 | 2284 | .30 |
| Province / Territory | Report week of 2017 | |||||||||||||||||||||
|---|---|---|---|---|---|---|---|---|---|---|---|---|---|---|---|---|---|---|---|---|---|---|
| 19 | 20 | 21 | 22 | 23 | 24 | 25 | 26 | 27 | 28 | 29 | 30 | 31 | 32 | 33 | 34 | 35 | 36 | 37 | 38 | 39 | 40 | |
| Newfoundland and Labrador | 0 | 0 | 0 | 0 | 0 | 0 | 0 | 0 | ||||||||||||||
| Prince Edward Island | 0 | 0 | 0 | 0 | 0 | 0 | 0 | 0 | ||||||||||||||
| New Brunswick | 0 | 0 | 0 | 0 | 0 | 0 | 0 | 0 | ||||||||||||||
| Nova Scotia | 0 | 0 | 0 | 0 | 0 | 0 | 0 | 0 | ||||||||||||||
| Quebec | 0 | 0 | 0 | 0 | 0 | 0 | 0 | 0 | ||||||||||||||
| Ontario | 13 | 15 | 43 | 84 | 194 | 299 | 718 | 794 | ||||||||||||||
| Manitoba | 0 | 0 | 0 | 0 | 15 | 45 | 48 | 16 | ||||||||||||||
| Saskatchewan | 0 | 0 | 0 | 0 | 0 | 0 | 0 | 0 | ||||||||||||||
| Alberta | 0 | 0 | 0 | 0 | 0 | 0 | 0 | 0 | ||||||||||||||
| British Columbia | 0 | 0 | 0 | 0 | 0 | 0 | 0 | 0 | ||||||||||||||
| Yukon Territory | 0 | 0 | 0 | 0 | 0 | 0 | 0 | 0 | ||||||||||||||
| Northwest Territory | 0 | 0 | 0 | 0 | 0 | 0 | 0 | 0 | ||||||||||||||
| Nunavut | 0 | 0 | 0 | 0 | 0 | 0 | 0 | 0 | ||||||||||||||
| Total | 13 | 15 | 43 | 84 | 209 | 344 | 766 | 810 | ||||||||||||||
table 3 Footnotes
|
||||||||||||||||||||||
Figure 4: Reported number of dead birds tested positive for West Nile virus by province/ territory and by report week, 2017 season in Canada
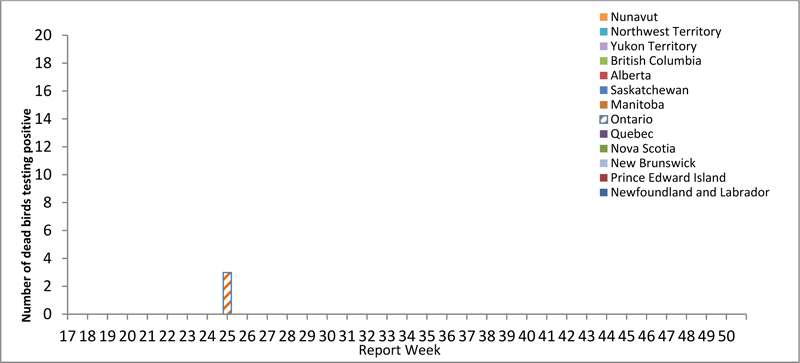
Figure 4: Text Equivalent
As of week 26, ending July 1 in 2017, there are 3 West Nile virus cases in birds, in Canada.
| Report Weeks of 2017 | |||||||||||||||||||||||||||||||||||
|---|---|---|---|---|---|---|---|---|---|---|---|---|---|---|---|---|---|---|---|---|---|---|---|---|---|---|---|---|---|---|---|---|---|---|---|
| 17 | 18 | 19 | 20 | 21 | 22 | 23 | 24 | 25 | 26 | 27 | 28 | 29 | 30 | 31 | 32 | 33 | 34 | 35 | 36 | 37 | 38 | 39 | 40 | 41 | 42 | 43 | 44 | 45 | 46 | 47 | 48 | 49 | 50 | Total | |
| Newfoundland and Labrador | 0 | 0 | 0 | 0 | 0 | 0 | 0 | 0 | 0 | 0 | 0 | ||||||||||||||||||||||||
| Prince Edward Island | 0 | 0 | 0 | 0 | 0 | 0 | 0 | 0 | 0 | 0 | 0 | ||||||||||||||||||||||||
| New Brunswick | 0 | 0 | 0 | 0 | 0 | 0 | 0 | 0 | 0 | 0 | 0 | ||||||||||||||||||||||||
| Nova Scotia | 0 | 0 | 0 | 0 | 0 | 0 | 0 | 0 | 0 | 0 | 0 | ||||||||||||||||||||||||
| Quebec | 0 | 0 | 0 | 0 | 0 | 0 | 0 | 0 | 0 | 0 | 0 | ||||||||||||||||||||||||
| Ontario | 0 | 0 | 0 | 0 | 0 | 0 | 0 | 0 | 3 | 0 | 3 | ||||||||||||||||||||||||
| Manitoba | 0 | 0 | 0 | 0 | 0 | 0 | 0 | 0 | 0 | 0 | 0 | ||||||||||||||||||||||||
| Saskatchewan | 0 | 0 | 0 | 0 | 0 | 0 | 0 | 0 | 0 | 0 | 0 | ||||||||||||||||||||||||
| Alberta | 0 | 0 | 0 | 0 | 0 | 0 | 0 | 0 | 0 | 0 | 0 | ||||||||||||||||||||||||
| British Columbia | 0 | 0 | 0 | 0 | 0 | 0 | 0 | 0 | 0 | 0 | 0 | ||||||||||||||||||||||||
| Yukon Territory | 0 | 0 | 0 | 0 | 0 | 0 | 0 | 0 | 0 | 0 | 0 | ||||||||||||||||||||||||
| Northwest Territory | 0 | 0 | 0 | 0 | 0 | 0 | 0 | 0 | 0 | 0 | 0 | ||||||||||||||||||||||||
| Nunavut | 0 | 0 | 0 | 0 | 0 | 0 | 0 | 0 | 0 | 0 | 0 | ||||||||||||||||||||||||
| Total | 0 | 0 | 0 | 0 | 0 | 0 | 0 | 0 | 3 | 0 | |||||||||||||||||||||||||
Figure 5: Percentage of dead birds tested positive for West Nile virus by report week in 2012, 2015, 2016, 2017 and number of dead birds tested positive, by report week, 2017, in CanadaFootnote 2
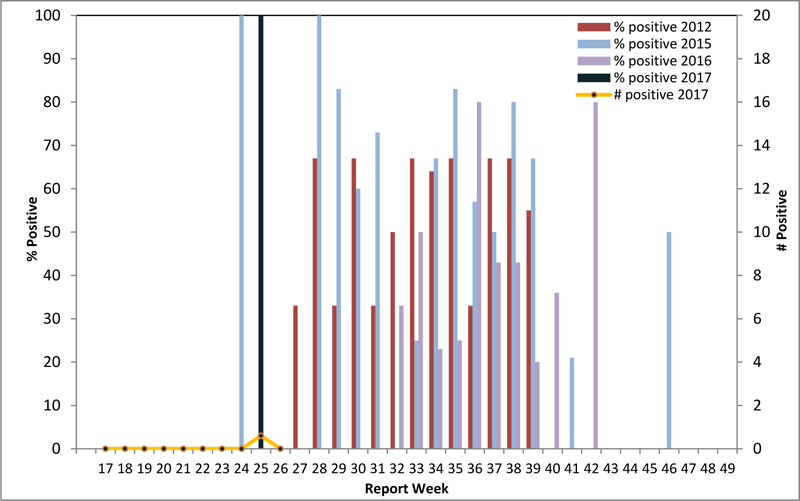
Figure 5: Text Equivalent
| Year | 17 | 18 | 19 | 20 | 21 | 22 | 23 | 24 | 25 | 26 | 27 | 28 | 29 | 30 | 31 | 32 | 33 | 34 | 35 | 36 | 37 | 38 | 39 | 40 | 41 | 42 | 43 | 44 | 45 | 46 | 47 | 48 | |
|---|---|---|---|---|---|---|---|---|---|---|---|---|---|---|---|---|---|---|---|---|---|---|---|---|---|---|---|---|---|---|---|---|---|
| % Positive | 2012 | 0 | 0 | 0 | 0 | 0 | 0 | 0 | 0 | 0 | 0 | 33 | 67 | 33 | 67 | 33 | 50 | 67 | 64 | 67 | 33 | 67 | 67 | 55 | 0 | 0 | 0 | 0 | 0 | 0 | 0 | 0 | 0 |
| % Positive | 2015 | 0 | 0 | 0 | 0 | 0 | 0 | 0 | 100 | 0 | 0 | 0 | 100 | 83 | 60 | 73 | 0 | 25 | 67 | 83 | 57 | 50 | 80 | 67 | 0 | 21 | 0 | 0 | 0 | 0 | 50 | 0 | 0 |
| % Positive | 2016 | 0 | 0 | 0 | 0 | 0 | 0 | 0 | 0 | 0 | 0 | ||||||||||||||||||||||
| # Positive | 2016 | 0 | 0 | 0 | 0 | 0 | 0 | 0 | 0 | 0 | 0 | ||||||||||||||||||||||
| # Positive | 2017 | 0 | 0 | 0 | 0 | 0 | 0 | 0 | 0 | 3 | 0 |
Page details
- Date modified: