
West Nile Virus national surveillance report: August 5 to 11, 2018
Download the alternative format
(PDF format, 1.3 MB, 6 pages)
Organization: Public Health Agency of Canada
Published: August 21, 2018
Related Topics
West Nile Virus - Week 32 2018
Canada
- Human
As of August 11, 2018, the Public Health Agency of Canada has been informed of five clinical cases of West Nile virus (WNV): four in Ontario and one in Manitoba. Of these, three (60%) have been classified as WNV neurological syndrome and two (40%) are unspecified. No deaths have been reported. In addition, two WNV asymptomatic infections in Ontario were reported.
- Mosquito
To date (week 32), the PHAC has been notified of 10,091 mosquito pools tested for WNV: Saskatchewan (563), Manitoba (1,565), Ontario (7,072) and Québec (891]). Of these, a total of 285 (2.82%) have tested positive for WNV: thirty-three in Saskatchewan, 129 in Manitoba, 115 in Ontario, and eight in Québec.
- Wild Bird
-
To date (week 32), 37 out of 58 dead wild birds have tested positive for WNV by the Canadian Wildlife Health Cooperative (CWHC) and Manitoba Agriculture: thirteen in Manitoba, seven in Québec, two in Saskatchewan, and fifteen in Ontario. In addition, four live birds in Québec have been tested positive for WNV by the University of Montréal.
- Equine
The Canadian Food Inspection Agency (CFIA) has reported nine horses with WNV infection in the following three provinces: Alberta (5), Saskatchewan (2), and Manitoba (2).
United States and U.S. territories
As of August 7, 106 human cases of WNV have been reported to the US Centers for Disease Control and Prevention (CDC). Of these, sixty-two (58%) were classified as neuroinvasive disease and forty-four (42%) as non-neuroinvasive disease. Four deaths have been reported. In addition, forty-four presumptive viremic blood donors have been identified.
Europe and Neighboring Countries
As of August 9, 231 human cases of West Nile fever have been reported to the European Centre for Disease Prevention and Control. Seventeen deaths have been reported.
Weekly updates: 2018 West Nile fever transmission season
Other Mosquito-borne Diseases in Canada - Week 32 2018
- Eastern Equine Encephalitis virus
No human cases of Eastern Equine Encephalitis virus (EEEV) have been reported to the PHAC, since the 2018 season. The CFIA has reported four horses testing positive for EEEV, all in Ontario.
- California Serogroup virus
-
In surveillance week 32, no human cases/exposures of California serogroup virus were diagnosed by the National Microbiology Laboratory in the Public Health Agency of Canada.
Figure and tables
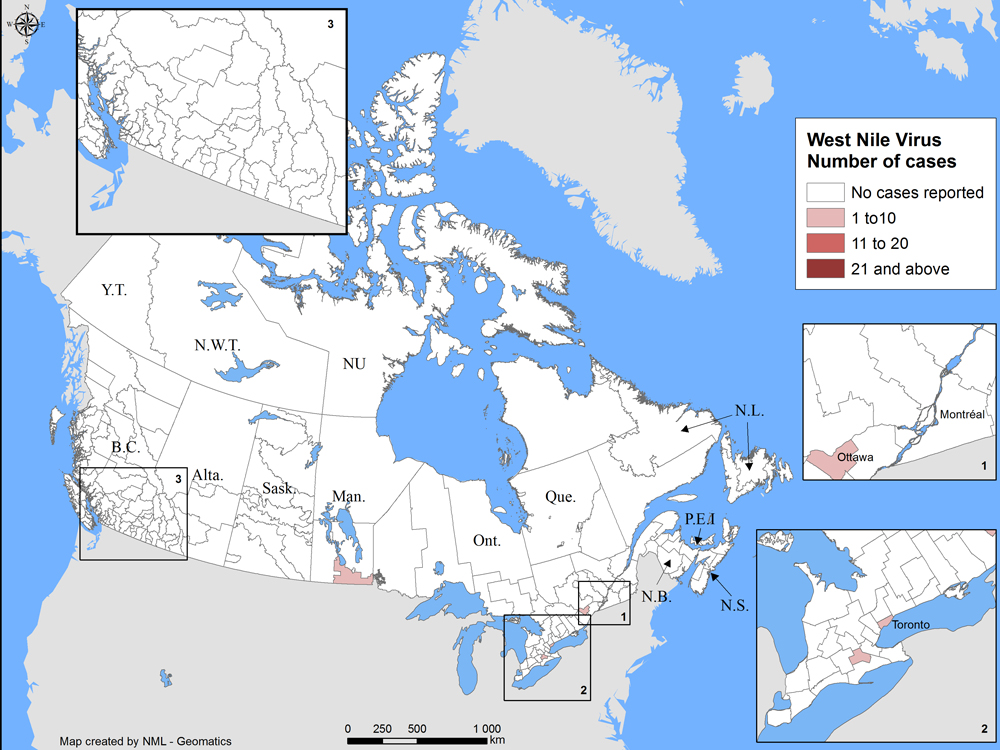
Figure 1 - Text description
Map showing geographic distribution of human cases of West Nile virus (WNV) in Canada.
As of August 11, 2018, seven human cases associated with WNV in Canada have been reported to the Public Health Agency of Canada (PHAC).
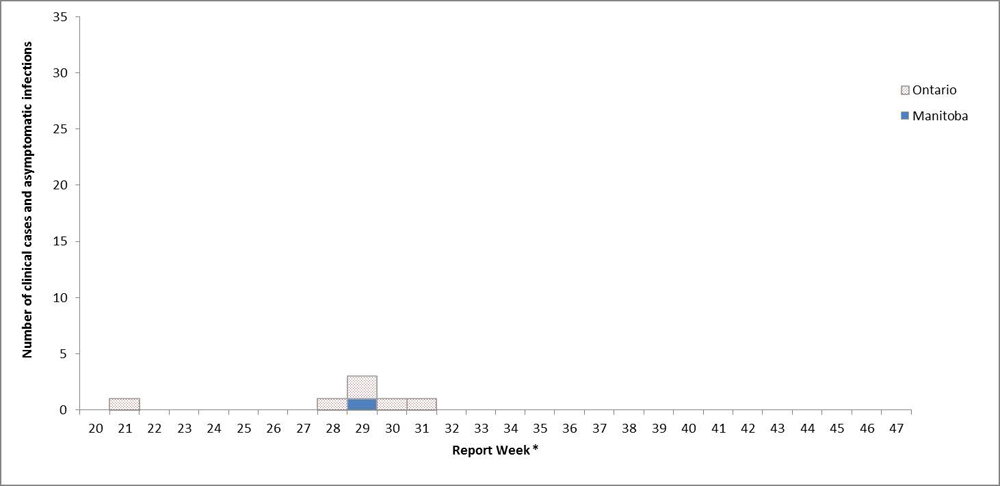
Figure 2 note ±: WNV clinical cases and asymptomatic infections are grouped by report week, based on episode date. Episode date could include one of the following: onset date, diagnosis date, lab sample date or reporting date.
Figure 2 - Text description
As of week 32, ending August 11, 2018, there are seven human clinical cases and asymptomatic infections associated with WNV in Canada.
| Province / Territory | Report Weekfigure 2 table note ± | Total | |||||||||||||||||||||||||||
|---|---|---|---|---|---|---|---|---|---|---|---|---|---|---|---|---|---|---|---|---|---|---|---|---|---|---|---|---|---|
| 20 | 21 | 22 | 23 | 24 | 25 | 26 | 27 | 28 | 29 | 30 | 31 | 32 | 33 | 34 | 35 | 36 | 37 | 38 | 39 | 40 | 41 | 42 | 43 | 44 | 45 | 46 | 47 | ||
| Manitoba | 0 | 0 | 0 | 0 | 0 | 0 | 0 | 0 | 0 | 1 | 0 | 0 | 0 | - | - | - | - | - | - | - | - | - | - | - | - | - | - | - | 1 |
| Ontario | 0 | 1 | 0 | 0 | 0 | 0 | 0 | 0 | 1 | 2 | 1 | 1 | 0 | - | - | - | - | - | - | - | - | - | - | - | - | - | - | - | 6 |
| Total | 0 | 1 | 0 | 0 | 0 | 0 | 0 | 0 | 1 | 3 | 1 | 1 | 0 | 0 | 0 | 0 | 0 | 0 | 0 | 0 | 0 | 0 | 0 | 0 | 0 | 0 | 0 | 0 | 7 |
'-' = Not available. Figure 2 table notes
|
|||||||||||||||||||||||||||||
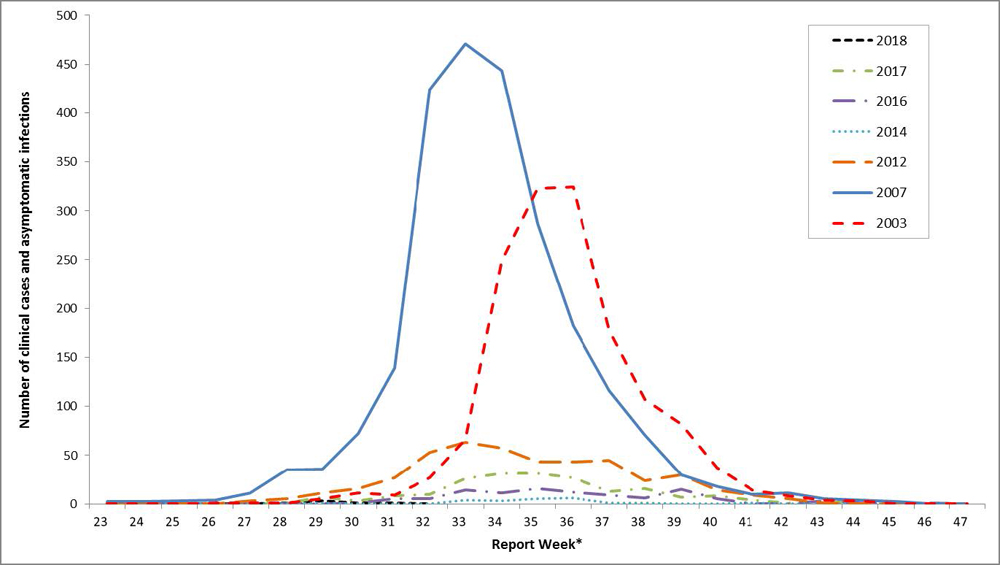
Figure 3 note *: WNV clinical cases and asymptomatic infections are grouped by report week, based on episode date. Episode date could include one of the following: onset date, diagnosis date, lab sample date or reporting date.
Figure 3 - Text description
| Year | Report Weekfigure 3 table note * | Total | |||||||||||||||||||||||||||
|---|---|---|---|---|---|---|---|---|---|---|---|---|---|---|---|---|---|---|---|---|---|---|---|---|---|---|---|---|---|
| 20 | 21 | 22 | 23 | 24 | 25 | 26 | 27 | 28 | 29 | 30 | 31 | 32 | 33 | 34 | 35 | 36 | 37 | 38 | 39 | 40 | 41 | 42 | 43 | 44 | 45 | 46 | 47 | ||
| 2018 | 0 | 1 | 0 | 0 | 0 | 0 | 0 | 0 | 1 | 3 | 1 | 1 | 0 | - | - | - | - | - | - | - | - | - | - | - | - | - | - | - | 7 |
| 2017 | 0 | 0 | 0 | 0 | 0 | 1 | 0 | 1 | 1 | 7 | 3 | 8 | 10 | 26 | 31 | 31 | 27 | 13 | 16 | 7 | 8 | 4 | 1 | 1 | 3 | 0 | 0 | 0 | 200 |
| 2016 | 0 | 0 | 0 | 0 | 1 | 0 | 0 | 0 | 0 | 0 | 1 | 5 | 5 | 14 | 11 | 16 | 12 | 9 | 6 | 15 | 5 | 0 | 0 | 3 | 1 | 0 | 1 | 0 | 105 |
| 2014 | 0 | 0 | 0 | 0 | 0 | 0 | 0 | 0 | 0 | 1 | 0 | 0 | 0 | 4 | 3 | 5 | 6 | 1 | 1 | 0 | 0 | 1 | 0 | 0 | 0 | 0 | 0 | 0 | 22 |
| 2012 | 0 | 0 | 0 | 1 | 0 | 0 | 0 | 3 | 5 | 11 | 16 | 27 | 53 | 63 | 57 | 43 | 43 | 45 | 24 | 30 | 14 | 9 | 5 | 1 | 0 | 0 | 0 | 0 | 450 |
| 2007 | 0 | 0 | 0 | 2 | 2 | 3 | 4 | 11 | 35 | 36 | 72 | 139 | 424 | 471 | 443 | 287 | 182 | 116 | 71 | 30 | 18 | 10 | 11 | 5 | 4 | 2 | 0 | 0 | 2,378 |
| 2003 | 0 | 0 | 0 | 0 | 0 | 0 | 1 | 1 | 1 | 5 | 11 | 9 | 27 | 66 | 249 | 323 | 324 | 178 | 107 | 82 | 37 | 14 | 8 | 4 | 3 | 0 | 0 | 0 | 1,450 |
'-' = Not available. Figure 3 table notes
|
|||||||||||||||||||||||||||||
| Province/Territory | Clinical Cases | Total clinical casestable 1 note 1 | Total travel-related casestable 1 note 2 | Total asymptomatic infectionstable 1 note 3 | ||
|---|---|---|---|---|---|---|
| Neurological syndrome | Non-neurological syndrome | Unclassified/ Unspecified | ||||
| Week 32: August 5 to August 11, 2018 | ||||||
| Newfoundland and Labrador | 0 | 0 | 0 | 0 | 0 | 0 |
| Prince Edward Island | 0 | 0 | 0 | 0 | 0 | 0 |
| Nova Scotia | 0 | 0 | 0 | 0 | 0 | 0 |
| New Brunswick | 0 | 0 | 0 | 0 | 0 | 0 |
| Québec | 0 | 0 | 0 | 0 | 0 | 0 |
| Ontario | 0 | 0 | 0 | 0 | 0 | 0 |
| Manitoba | 0 | 0 | 0 | 0 | 0 | 0 |
| Saskatchewantable 1 note 4 | 0 | - | - | - | - | - |
| Alberta | 0 | 0 | 0 | 0 | 0 | 0 |
| British Columbia | 0 | 0 | 0 | 0 | 0 | 0 |
| Yukon Territory | 0 | 0 | 0 | 0 | 0 | 0 |
| Northwest Territory | 0 | 0 | 0 | 0 | 0 | 0 |
| Nunavut | 0 | 0 | 0 | 0 | 0 | 0 |
| Total | 0 | 0 | 0 | 0 | 0 | 0 |
| Year to date: January 1 to August 11, 2018 | ||||||
| Newfoundland and Labrador | 0 | 0 | 0 | 0 | 0 | 0 |
| Prince Edward Island | 0 | 0 | 0 | 0 | 0 | 0 |
| Nova Scotia | 0 | 0 | 0 | 0 | 0 | 0 |
| New Brunswick | 0 | 0 | 0 | 0 | 0 | 0 |
| Québec | 0 | 0 | 0 | 0 | 0 | 0 |
| Ontario | 2 | 0 | 2 | 4 | 2 | 2 |
| Manitoba | 1 | 0 | 0 | 1 | 0 | 0 |
| Saskatchewantable 1 note 4 | 0 | - | - | - | - | - |
| Alberta | 0 | 0 | 0 | 0 | 0 | 0 |
| British Columbia | 0 | 0 | 0 | 0 | 0 | 0 |
| Yukon Territory | 0 | 0 | 0 | 0 | 0 | 0 |
| Northwest Territory | 0 | 0 | 0 | 0 | 0 | 0 |
| Nunavut | 0 | 0 | 0 | 0 | 0 | 0 |
| Total | 3 | 0 | 2 | 5 | 2 | 2 |
'-' = Not available. Table 1 notes
|
||||||
| Province / Territory | Number of positive mosquito pools | Number of mosquito pools tested | Percentage of positive mosquito pools (%) |
|---|---|---|---|
| Saskatchewan | 33 | 563 | 5.86 |
| Manitoba | 129 | 1,565 | 8.24 |
| Ontario | 115 | 7,072 | 1.63 |
| Québec | 8 | 891 | 0.90 |
| Total | 285 | 10,091 | 2.82 |
Table 2 notes
|
|||
| Province | Report Week | Total | ||||||||||||||||||
|---|---|---|---|---|---|---|---|---|---|---|---|---|---|---|---|---|---|---|---|---|
| 22 | 23 | 24 | 25 | 26 | 27 | 28 | 29 | 30 | 31 | 32 | 33 | 34 | 35 | 36 | 37 | 38 | 39 | 40 | ||
| Saskatchewan | 0 | 15 | 18 | 17 | 45 | 54 | 79 | 95 | 93 | 92 | 55 | - | - | - | - | - | - | - | - | 563 |
| Manitoba | 15 | 39 | 89 | 107 | 124 | 122 | 241 | 240 | 247 | 169 | 172 | - | - | - | - | - | - | - | - | 1,565 |
| Ontario | 0 | - | - | - | 842 | 955 | 1,024 | 963 | 1,073 | 1,059 | 1,156 | - | - | - | - | - | - | - | - | 7,072 |
| Québec | 0 | 69 | 77 | 105 | 105 | 108 | 109 | 109 | 110 | 99 | - | - | - | - | - | - | - | - | - | 891 |
| Total | 15 | 123 | 184 | 229 | 1,116 | 1,239 | 1,453 | 1,407 | 1,523 | 1,419 | 1,383 | - | - | - | - | - | - | - | - | 10,091 |
'-' = Not available. Table 3 notes
|
||||||||||||||||||||
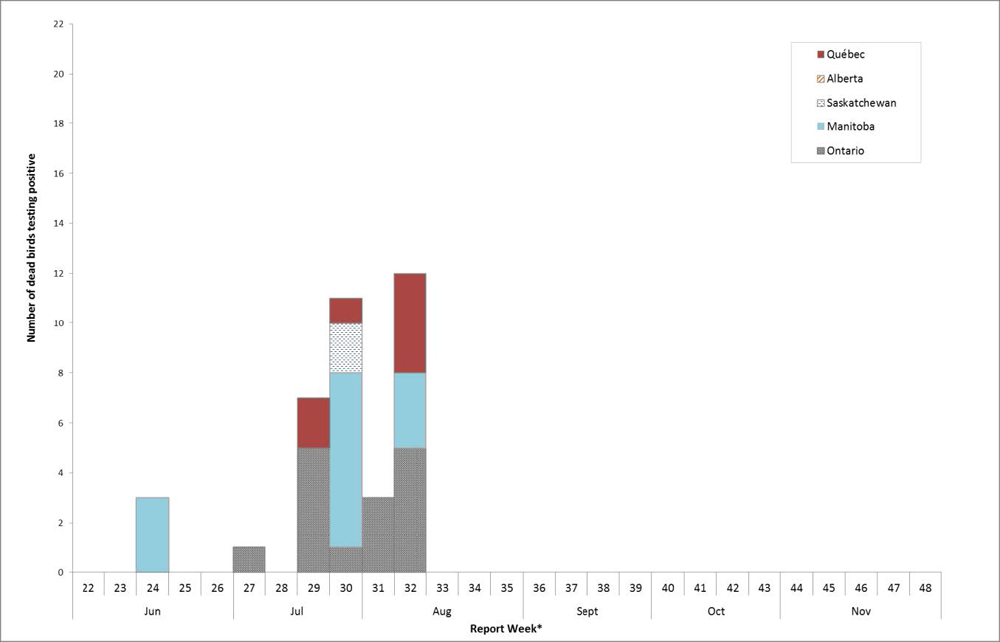
Figure 4 notes
- Figure 4 note *
Not all provinces conduct dead wild bird surveillance as part of their respective WNV surveillance program. However, WNV positive dead wild birds may be identified through the National Wildlife Disease Surveillance Program, CWHC.
Figure 4 - Text description
As of week 32, ending August 11, 2018, there are thirty-seven WNV cases in birds, in Canada.
| Province | Jun | Jul | Aug | Sept | Oct | Nov | Total | |||||||||||||||||||||
|---|---|---|---|---|---|---|---|---|---|---|---|---|---|---|---|---|---|---|---|---|---|---|---|---|---|---|---|---|
| 22 | 23 | 24 | 25 | 26 | 27 | 28 | 29 | 30 | 31 | 32 | 33 | 34 | 35 | 36 | 37 | 38 | 39 | 40 | 41 | 42 | 43 | 44 | 45 | 46 | 47 | 48 | ||
| Québec | 0 | 0 | 0 | 0 | 0 | 0 | 0 | 2 | 1 | 0 | 4 | - | - | - | - | - | - | - | - | - | - | - | - | - | - | - | - | 7 |
| Ontario | 0 | 0 | 0 | 0 | 0 | 1 | 0 | 5 | 1 | 3 | 5 | - | - | - | - | - | - | - | - | - | - | - | - | - | - | - | - | 15 |
| Manitoba | 0 | 0 | 3 | 0 | 0 | 0 | 0 | 0 | 7 | 0 | 3 | - | - | - | - | - | - | - | - | - | - | - | - | - | - | - | - | 13 |
| Saskatchewan | 0 | 0 | 0 | 0 | 0 | 0 | 0 | 0 | 2 | 0 | 0 | - | - | - | - | - | - | - | - | - | - | - | - | - | - | - | - | 2 |
| Total | 0 | 0 | 3 | 0 | 0 | 1 | 0 | 7 | 11 | 3 | 12 | - | - | - | - | - | - | - | - | - | - | - | - | - | - | - | - | 37 |
'-' = Not available. |
||||||||||||||||||||||||||||
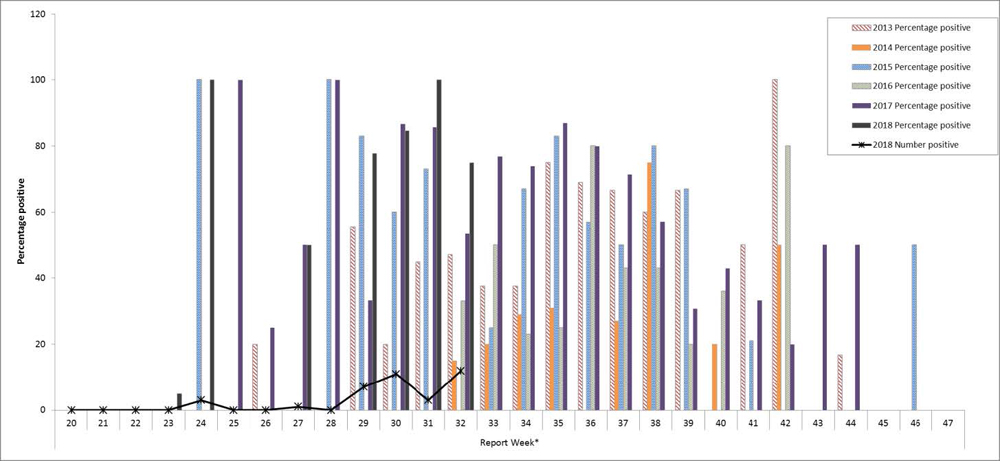
Figure 5 notes
- Figure 5 note *
Not all provinces conduct dead wild bird surveillance as part of their respective WNV surveillance program. However, WNV positive dead wild birds may be identified through the National Wildlife Disease Surveillance Program, CWHC.
Figure 5 - Text description
| Jun | Jul | Aug | Sept | Oct | Nov | ||||||||||||||||||||||
|---|---|---|---|---|---|---|---|---|---|---|---|---|---|---|---|---|---|---|---|---|---|---|---|---|---|---|---|
| 22 | 23 | 24 | 25 | 26 | 27 | 28 | 29 | 30 | 31 | 32 | 33 | 34 | 35 | 36 | 37 | 38 | 39 | 40 | 41 | 42 | 43 | 44 | 45 | 46 | 47 | ||
| 2013 | Percentage positive | 0 | 0 | 0 | 0 | 20 | 0 | 0 | 56 | 20 | 45 | 47 | 38 | 38 | 75 | 69 | 67 | 60 | 67 | 0 | 50 | 100 | 0 | 17 | 0 | 0 | 0 |
| 2014 | Percentage positive | 0 | 0 | 0 | 0 | 0 | 0 | 0 | 0 | 0 | 0 | 15 | 20 | 29 | 31 | 0 | 27 | 75 | 0 | 20 | 0 | 50 | 0 | 0 | 0 | 0 | 0 |
| 2015 | Percentage positive | 0 | 0 | 100 | 0 | 0 | 0 | 100 | 83 | 60 | 73 | 0 | 25 | 67 | 83 | 57 | 50 | 80 | 67 | 0 | 21 | 0 | 0 | 0 | 0 | 50 | 0 |
| 2016 | Percentage positive | 0 |
0 |
0 |
0 |
0 |
0 |
0 |
0 |
0 |
0 |
33 |
50 |
23 |
25 |
80 |
43 |
43 |
20 |
36 |
0 |
80 |
0 |
0 |
0 |
0 |
0 |
| 2017 | Percentage positive | 0 |
0 |
0 |
100 |
25 |
50 |
100 |
33 |
87 |
86 |
53 |
77 |
74 |
87 |
80 |
71 |
57 |
31 |
43 |
33 |
20 |
50 |
50 |
0 |
0 |
0 |
| 2018 | Percentage positive | 0 |
0 |
100 |
0 |
0 |
50 | 0 | 78 | 85 | 100 | 75 | - | - | - | - | - | - | - | - | - | - | - | - | - | - | - |
| 2018 | Number positive | 0 |
0 |
3 |
0 |
0 |
1 | 0 | 7 | 11 | 3 | 12 | - | - | - | - | - | - | - | - | - | - | - | - | - | - | - |
'-' = Not available. |
|||||||||||||||||||||||||||