
West Nile Virus national surveillance report: July 29 - August 4, 2018
Download the alternative format
(PDF format, 1.3 MB, 7 pages)
Organization: Public Health Agency of Canada
Published: August 14, 2018
Related Topics
West Nile Virus - Week 31 2018
Canada
- Human
-
As of August 4, 2018, the Public Health Agency of Canada has been informed of five clinical (confirmed or probable) cases of West Nile virus (WNV) and one asymptomatic infection (Ontario [5] and Manitoba [1]). Of the five clinical cases, three (60%) have been classified as WNV neurological syndrome and two cases (40%) are unspecified. No deaths have been reported.
- Mosquito
-
To date (week 31), the PHAC has been notified of 8609 mosquito pools tested for WNV (Saskatchewan [508], Manitoba [1,393], Ontario [5,916] and Quebec [792]). Of these, a total of 195 (2.27%) have tested positive for WNV: twenty-six in Saskatchewan (Moist Mixed Grassland/Aspen Parkland [23] and Mixed Grassland [3]), 102 in Manitoba (Winnipeg [31], Interlake-Eastern [18], Prairie Mountain [23], and Southern [30]), sixty-five in Ontario (City of Ottawa [1], City of Hamilton [3], Lambton County [1], Niagara County [1], Oxford County [2], City of Toronto [11], Waterloo [2], Simcoe Muskoka District [1], Middlesex-London [1], Haldimand-Norfolk [1], Halton Region [4], Peel Region [10], Hastings and Prince Edward Counties [1],Windsor-Essex County [15], Chatham-Kent [3], Brant County [1], Perth District [1], Wellington-Dufferin-Guelph [1], and York Region [5] and two in Quebec.
- Wild Bird
-
As of week 31, a total of forty-four dead wild birds have been tested for WNV by the Canadian Wildlife Health Cooperative (CWHC) and Manitoba Agriculture: one in Alberta, seven in Saskatchewan, ten in Manitoba, nineteen in Ontario, six in Québec, and one in Nova Scotia. Of these, twenty-five dead wild birds were positive for WNV: ten in Manitoba (Winnipeg Regional Health [10]), three in Quebec (Estrie [3]), two in Saskatchewan (Saskatoon [2]) and ten in Ontario (Wellington-Dufferin-Guelph [1], Leeds, Grenville & Lanark [1], Lambton Public Health [1], Middlesex-London [2], City of Hamilton [2], Region of Waterloo [1]and Southwestern Public Health [1]) and Kingston, Frontenac, Lennox & Addington [1]. In addition, four live birds have been tested positive for WNV (Quebec [4]) by the University of Montréal.
- Equine
-
The Canadian Food Inspection Agency (CFIA) has received notification of the first confirmed case of WNV in a horse from Manitoba (Interlake-Eastern).
United States and U.S. territories
As of August 7, 106 human cases of WNV have been reported to the US Centers for Disease Control and Prevention (CDC). Of these, sixty-two (58%) were classified as neuroinvasive disease and forty-four (42%) as non-neuroinvasive disease. Four deaths have been reported. In addition, forty-four presumptive viremic blood donors have been identified.
Europe and Neighboring Countries
As of August 2, 181 human cases of West Nile fever have been reported to the European Centre for Disease Prevention and Control in the following countries: Serbia (70), Greece (51), Italy (24), Romania (5), and Hungary (5). Three deaths have been reported (Serbia [3]).
Weekly updates: 2018 West Nile fever transmission season
Other Mosquito-borne Diseases - Week 31 2018
Canada
- Eastern Equine Encephalitis virus
-
No human cases of Eastern Equine Encephalitis virus (EEEV) have been reported to the PHAC, since the 2018 season.
- California Serogroup virus
-
In surveillance week 31, no human cases/exposures of California serogroup virus were diagnosed by the National Microbiology Laboratory in the Public Health Agency of Canada.

Figure 1 - Text description
Map showing geographic distribution of human cases of West Nile virus (WNV) in Canada.
As of August 4, 2018, five human cases associated with WNV in Canada have been reported to the Public Health Agency of Canada (PHAC).
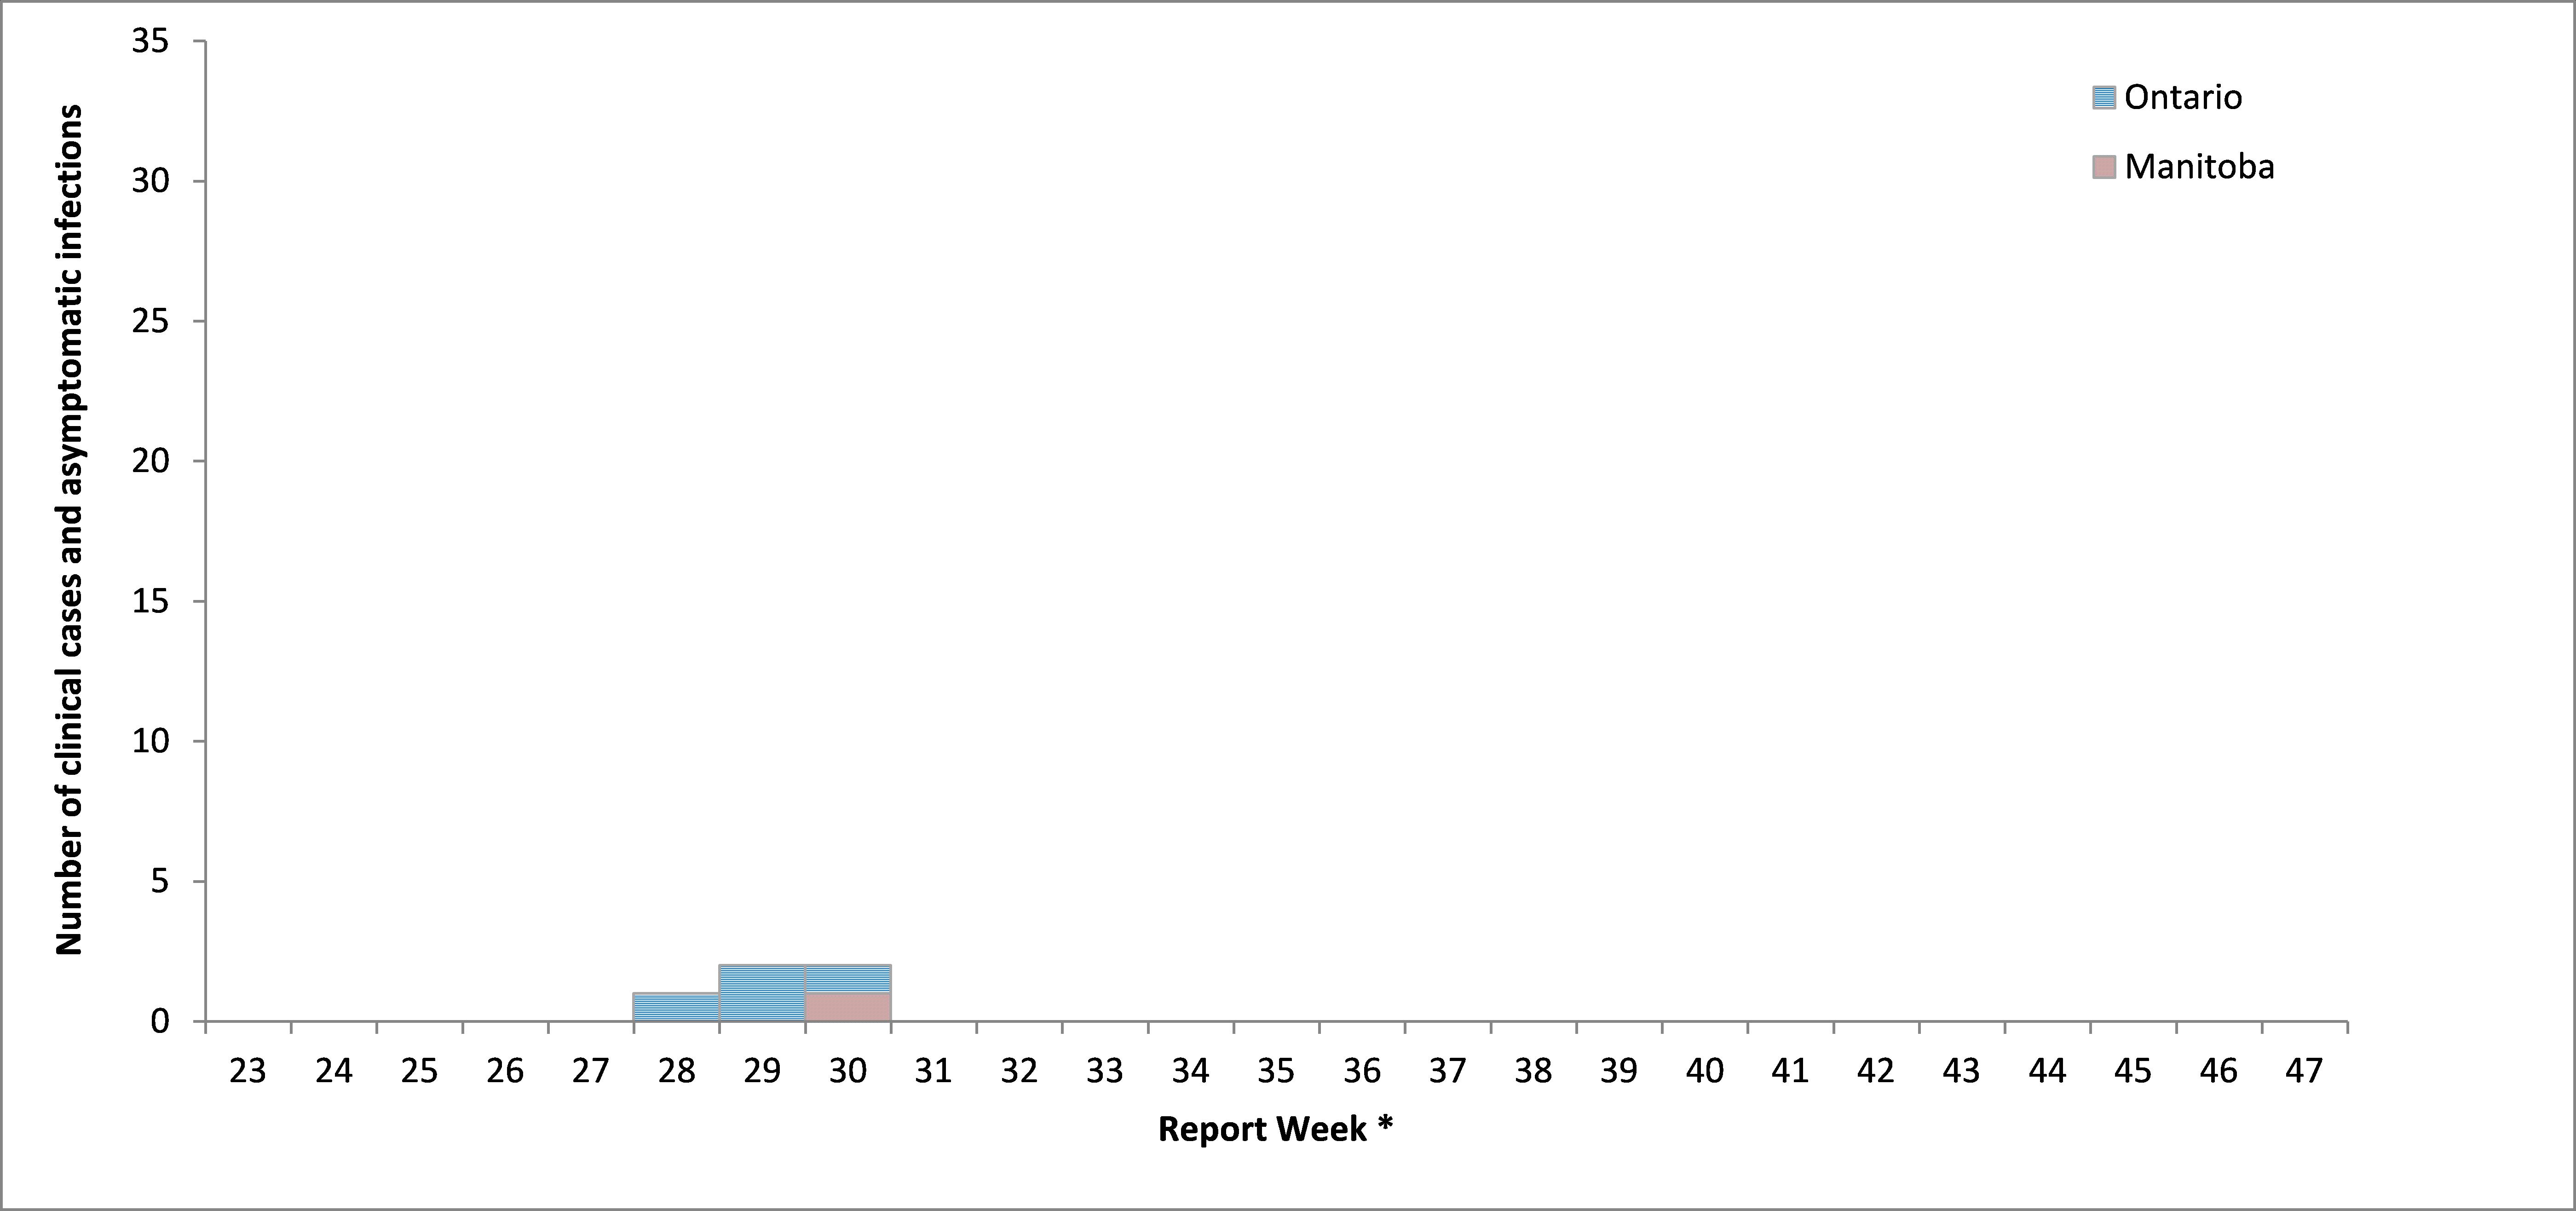
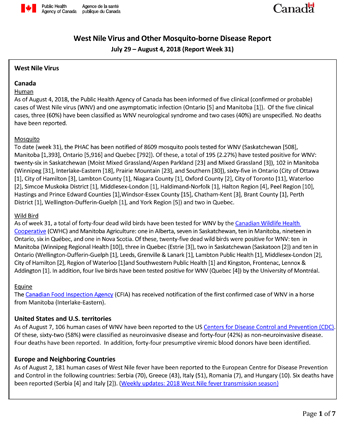
Figure 2 note ±: WNV clinical cases and asymptomatic infections are grouped by report week, based on episode date. Episode date could include one of the following: onset date, diagnosis date, lab sample date or reporting date.
Figure 2 - Text description
As of week 31, ending August 4, 2018, there are five human clinical cases and asymptomatic infections associated with WNV in Canada.
| Province / Territory | Report Weekfigure 2 table note ± | Total | ||||||||||||||||||||||||
|---|---|---|---|---|---|---|---|---|---|---|---|---|---|---|---|---|---|---|---|---|---|---|---|---|---|---|
| 23 | 24 | 25 | 26 | 27 | 28 | 29 | 30 | 31 | 32 | 33 | 34 | 35 | 36 | 37 | 38 | 39 | 40 | 41 | 42 | 43 | 44 | 45 | 46 | 47 | ||
| British Columbia | 0 | 0 | 0 | 0 | 0 | 0 | 0 | 0 | 0 | - | - | - | - | - | - | - | - | - | - | - | - | - | - | - | - | 0 |
| Alberta | 0 | 0 | 0 | 0 | 0 | 0 | 0 | 0 | 0 | - | - | - | - | - | - | - | - | - | - | - | - | - | - | - | - | 0 |
| Manitoba | 0 | 0 | 0 | 0 | 0 | 0 | 0 | 1 | 0 | - | - | - | - | - | - | - | - | - | - | - | - | - | - | - | - | 1 |
| Ontario | 0 | 0 | 0 | 0 | 0 | 1 | 2 | 1 | 0 | - | - | - | - | - | - | - | - | - | - | - | - | - | - | - | - | 4 |
| Québec | 0 | 0 | 0 | 0 | 0 | 0 | 0 | 0 | 0 | - | - | - | - | - | - | - | - | - | - | - | - | - | - | - | - | 0 |
| Total | 0 | 0 | 0 | 0 | 0 | 1 | 2 | 2 | 0 | 0 | 0 | 0 | 0 | 0 | 0 | 0 | 0 | 0 | 0 | 0 | 0 | 0 | 0 | 0 | 0 | 5 |
'-' = Not available. Figure 2 table notes
|
||||||||||||||||||||||||||
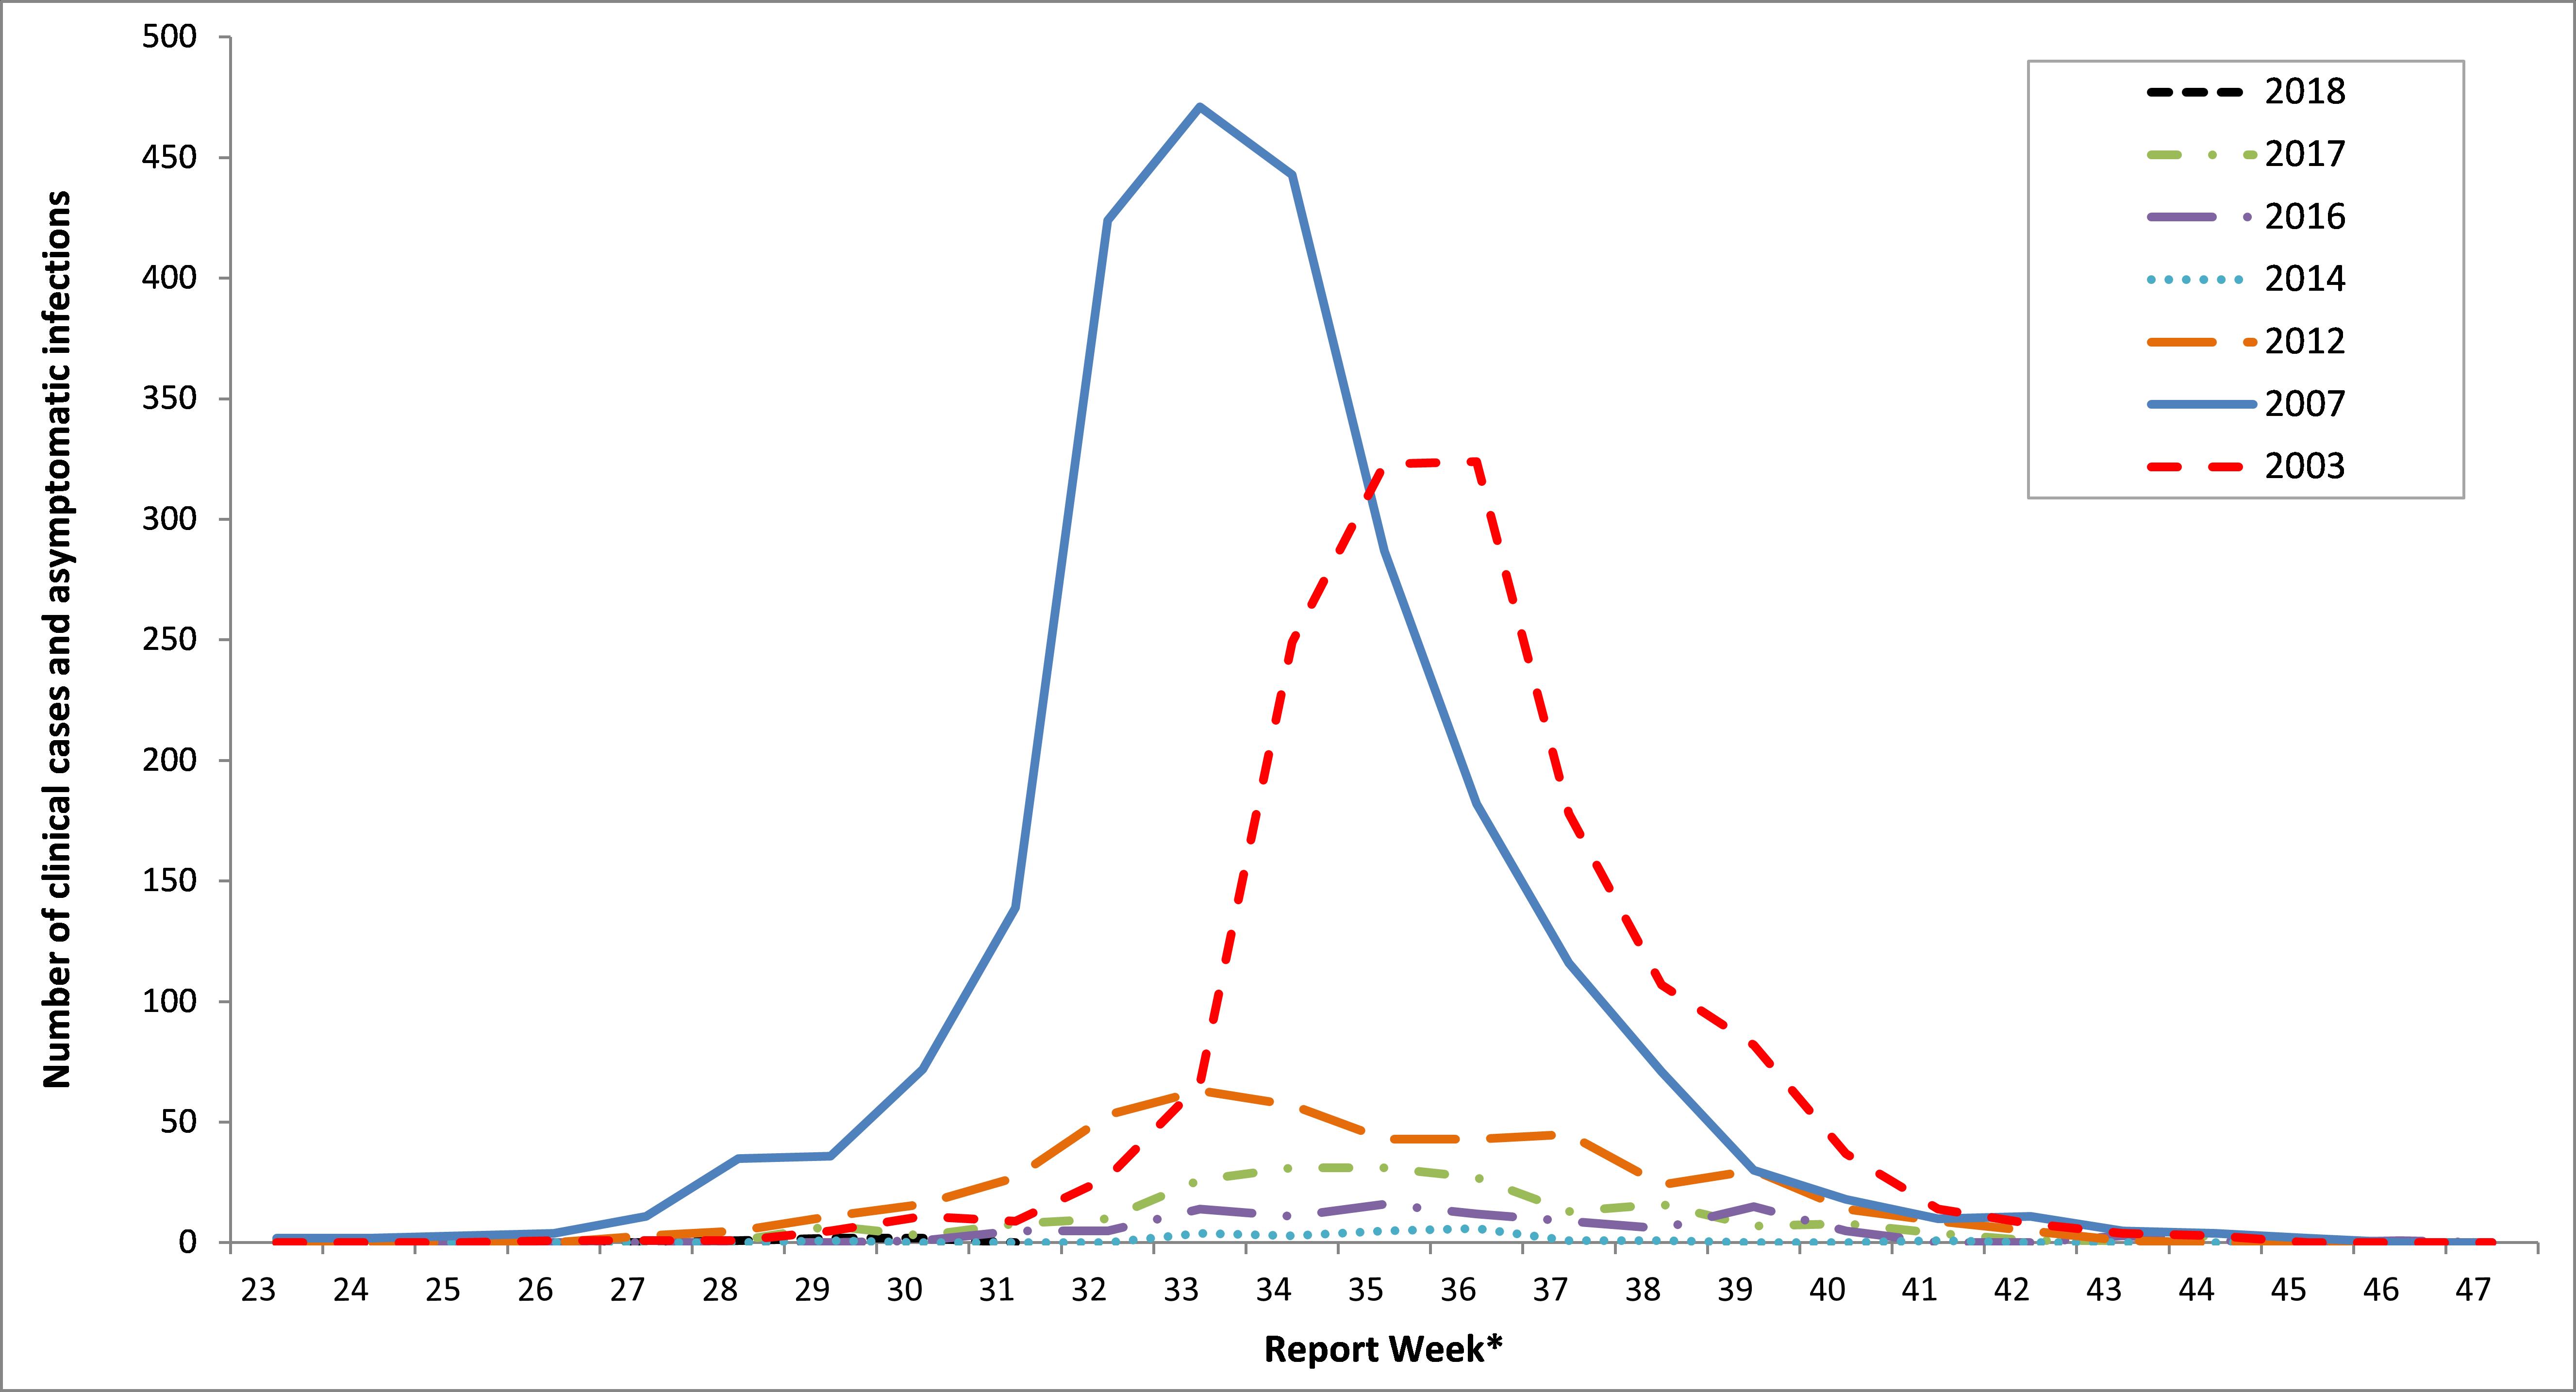
Figure 3 note *: WNV clinical cases and asymptomatic infections are grouped by report week, based on episode date. Episode date could include one of the following: onset date, diagnosis date, lab sample date or reporting date.
Figure 3 - Text description
| Year | Report Weekfigure 3 table note * | Total | ||||||||||||||||||||||||
|---|---|---|---|---|---|---|---|---|---|---|---|---|---|---|---|---|---|---|---|---|---|---|---|---|---|---|
| 23 | 24 | 25 | 26 | 27 | 28 | 29 | 30 | 31 | 32 | 33 | 34 | 35 | 36 | 37 | 38 | 39 | 40 | 41 | 42 | 43 | 44 | 45 | 46 | 47 | ||
| 2018 | 0 | 0 | 0 | 0 | 0 | 1 | 2 | 2 | 0 | - | - | - | - | - | - | - | - | - | - | - | - | - | - | - | - | 5 |
| 2017 | 0 | 0 | 1 | 0 | 1 | 1 | 7 | 3 | 8 | 10 | 26 | 31 | 31 | 27 | 13 | 16 | 7 | 8 | 4 | 1 | 1 | 3 | 0 | 0 | 0 | 200 |
| 2016 | 0 | 1 | 0 | 0 | 0 | 0 | 0 | 1 | 5 | 5 | 14 | 11 | 16 | 12 | 9 | 6 | 15 | 5 | 0 | 0 | 3 | 1 | 0 | 1 | 0 | 105 |
| 2014 | 0 | 0 | 0 | 0 | 0 | 0 | 1 | 0 | 0 | 0 | 4 | 3 | 5 | 6 | 1 | 1 | 0 | 0 | 1 | 0 | 0 | 0 | 0 | 0 | 0 | 22 |
| 2012 | 1 | 0 | 0 | 0 | 3 | 5 | 11 | 16 | 27 | 53 | 63 | 57 | 43 | 43 | 45 | 24 | 30 | 14 | 9 | 5 | 1 | 0 | 0 | 0 | 0 | 450 |
| 2007 | 2 | 2 | 3 | 4 | 11 | 35 | 36 | 72 | 139 | 424 | 471 | 443 | 287 | 182 | 116 | 71 | 30 | 18 | 10 | 11 | 5 | 4 | 2 | 0 | 0 | 2,378 |
| 2003 | 0 | 0 | 0 | 1 | 1 | 1 | 5 | 11 | 9 | 27 | 66 | 249 | 323 | 324 | 178 | 107 | 82 | 37 | 14 | 8 | 4 | 3 | 0 | 0 | 0 | 1,450 |
'-' = Not available. Figure 3 table notes
|
||||||||||||||||||||||||||
| Province/Territory | Clinical Cases | Total clinical casestable 1 note 1 | Total travel-related casestable 1 note 2 | Total asymptomatic infectionstable 1 note 3 | ||
|---|---|---|---|---|---|---|
| Neurological syndrome | Non-neurological syndrome | Unclassified/ Unspecified | ||||
| Week 31: July 29 to August 4, 2018 | ||||||
| Newfoundland and Labrador | 0 | 0 | 0 | 0 | 0 | 0 |
| Prince Edward Island | 0 | 0 | 0 | 0 | 0 | 0 |
| Nova Scotia | 0 | 0 | 0 | 0 | 0 | 0 |
| New Brunswick | 0 | 0 | 0 | 0 | 0 | 0 |
| Québec | 0 | 0 | 0 | 0 | 0 | 0 |
| Ontario | 0 | 0 | 1 | 1 | 1 | 1 |
| Manitoba | 0 | 0 | 0 | 0 | 0 | 0 |
| Saskatchewantable 1 note 4 | 0 | - | - | - | - | - |
| Alberta | 0 | 0 | 0 | 0 | 0 | 0 |
| British Columbia | 0 | 0 | 0 | 0 | 0 | 0 |
| Yukon Territory | 0 | 0 | 0 | 0 | 0 | 0 |
| Northwest Territory | 0 | 0 | 0 | 0 | 0 | 0 |
| Nunavut | 0 | 0 | 0 | 0 | 0 | 0 |
| Total | 0 | 0 | 1 | 1 | 1 | 1 |
| Year to date: January 1 to August 4, 2018 | ||||||
| Newfoundland and Labrador | 0 | 0 | 0 | 0 | 0 | 0 |
| Prince Edward Island | 0 | 0 | 0 | 0 | 0 | 0 |
| Nova Scotia | 0 | 0 | 0 | 0 | 0 | 0 |
| New Brunswick | 0 | 0 | 0 | 0 | 0 | 0 |
| Québec | 0 | 0 | 0 | 0 | 0 | 0 |
| Ontario | 2 | 0 | 2 | 4 | 2 | 1 |
| Manitoba | 1 | 0 | 0 | 1 | 0 | 0 |
| Saskatchewantable 1 note 4 | 0 | - | - | - | - | - |
| Alberta | 0 | 0 | 0 | 0 | 0 | 0 |
| British Columbia | 0 | 0 | 0 | 0 | 0 | 0 |
| Yukon Territory | 0 | 0 | 0 | 0 | 0 | 0 |
| Northwest Territory | 0 | 0 | 0 | 0 | 0 | 0 |
| Nunavut | 0 | 0 | 0 | 0 | 0 | 0 |
| Total | 3 | 0 | 2 | 5 | 2 | 1 |
'-' = Not available. Table 1 notes
|
||||||
| Province / Territory | Number of positive mosquito pools | Number of mosquito pools tested | Percentage of positive mosquito pools (%) |
|---|---|---|---|
| Saskatchewan | 26 | 508 | 5.12 |
| Manitoba | 102 | 1,393 | 7.32 |
| Ontario | 65 | 5,916 | 1.10 |
| Québec | 2 | 792 | 0.25 |
| Total | 195 | 8,609 | 2.27 |
Table 2 notes
|
|||
| Province | Report Week | Total | ||||||||||||||||||
|---|---|---|---|---|---|---|---|---|---|---|---|---|---|---|---|---|---|---|---|---|
| 22 | 23 | 24 | 25 | 26 | 27 | 28 | 29 | 30 | 31 | 32 | 33 | 34 | 35 | 36 | 37 | 38 | 39 | 40 | ||
| Saskatchewan | 0 | 15 | 18 | 17 | 45 | 54 | 79 | 95 | 93 | 92 | - | - | - | - | - | - | - | - | - | 508 |
| Manitoba | 15 | 39 | 89 | 107 | 124 | 122 | 241 | 240 | 247 | 169 | - | - | - | - | - | - | - | - | - | 1,393 |
| Ontario | 0 | - | - | - | 842 | 955 | 1,024 | 963 | 1,073 | 1,059 | - | - | - | - | - | - | - | - | - | 5,916 |
| Québec | 0 | 69 | 77 | 105 | 105 | 108 | 109 | 109 | 110 | - | - | - | - | - | - | - | - | - | - | 792 |
| Total | 15 | 123 | 184 | 229 | 1,116 | 1,239 | 1,453 | 1,407 | 1,523 | 1,320 | - | - | - | - | - | - | - | - | - | 8,609 |
'-' = Not available. Table 3 notes
|
||||||||||||||||||||
Figure 4 notes
- Figure 4 note *
-
Not all provinces conduct dead wild bird surveillance as part of their respective WNV surveillance program. However, WNV positive dead wild birds may be identified through the National Wildlife Disease Surveillance Program, CWHC.
Figure 4 - Text description
As of week 31, ending August 4, 2018, there are twenty-five WNV cases in birds, in Canada.
| Province | Jun | Jul | Aug | Sept | Oct | Nov | Total | |||||||||||||||||||||
|---|---|---|---|---|---|---|---|---|---|---|---|---|---|---|---|---|---|---|---|---|---|---|---|---|---|---|---|---|
| 22 | 23 | 24 | 25 | 26 | 27 | 28 | 29 | 30 | 31 | 32 | 33 | 34 | 35 | 36 | 37 | 38 | 39 | 40 | 41 | 42 | 43 | 44 | 45 | 46 | 47 | 48 | ||
| Québec | 0 | 0 | 0 | 0 | 0 | 0 | 0 | 2 | 1 | 0 | - | - | - | - | - | - | - | - | - | - | - | - | - | - | - | - | - | 3 |
| Ontario | 0 | 0 | 0 | 0 | 0 | 1 | 0 | 5 | 1 | 3 | - | - | - | - | - | - | - | - | - | - | - | - | - | - | - | - | - | 10 |
| Manitoba | 0 | 0 | 3 | 0 | 0 | 0 | 0 | 0 | 7 | 0 | - | - | - | - | - | - | - | - | - | - | - | - | - | - | - | - | - | 10 |
| Saskatchewan | 0 | 0 | 0 | 0 | 0 | 0 | 0 | 0 | 2 | 0 | - | - | - | - | - | - | - | - | - | - | - | - | - | - | - | - | - | 2 |
| Total | 0 | 0 | 3 | 0 | 0 | 1 | 0 | 7 | 11 | 3 | - | - | - | - | - | - | - | - | - | - | - | - | - | - | - | - | - | 25 |
'-' = Not available. |
||||||||||||||||||||||||||||
Figure 5 notes
- Figure 5 note *
-
Not all provinces conduct dead wild bird surveillance as part of their respective WNV surveillance program. However, WNV positive dead wild birds may be identified through the National Wildlife Disease Surveillance Program, CWHC.
Figure 5 - Text description
| Jun | Jul | Aug | Sept | Oct | Nov | ||||||||||||||||||||||
|---|---|---|---|---|---|---|---|---|---|---|---|---|---|---|---|---|---|---|---|---|---|---|---|---|---|---|---|
| 22 | 23 | 24 | 25 | 26 | 27 | 28 | 29 | 30 | 31 | 32 | 33 | 34 | 35 | 36 | 37 | 38 | 39 | 40 | 41 | 42 | 43 | 44 | 45 | 46 | 47 | ||
| 2013 | Percentage positive | 0 | 0 | 0 | 0 | 20 | 0 | 0 | 56 | 20 | 45 | 47 | 38 | 38 | 75 | 69 | 67 | 60 | 67 | 0 | 50 | 100 | 0 | 17 | 0 | 0 | 0 |
| 2014 | Percentage positive | 0 | 0 | 0 | 0 | 0 | 0 | 0 | 0 | 0 | 0 | 15 | 20 | 29 | 31 | 0 | 27 | 75 | 0 | 20 | 0 | 50 | 0 | 0 | 0 | 0 | 0 |
| 2015 | Percentage positive | 0 | 0 | 100 | 0 | 0 | 0 | 100 | 83 | 60 | 73 | 0 | 25 | 67 | 83 | 57 | 50 | 80 | 67 | 0 | 21 | 0 | 0 | 0 | 0 | 50 | 0 |
| 2016 | Percentage positive | 0 |
0 |
0 |
0 |
0 |
0 |
0 |
0 |
0 |
0 |
33 |
50 |
23 |
25 |
80 |
43 |
43 |
20 |
36 |
0 |
80 |
0 |
0 |
0 |
0 |
0 |
| 2017 | Percentage positive | 0 |
0 |
0 |
100 |
25 |
50 |
100 |
33 |
87 |
86 |
53 |
77 |
74 |
87 |
80 |
71 |
57 |
31 |
43 |
33 |
20 |
50 |
50 |
0 |
0 |
0 |
| 2018 | Percentage positive | 0 |
0 |
100 |
0 |
0 |
50 | 0 | 78 | 85 | 100 | - | - | - | - | - | - | - | - | - | - | - | - | - | - | - | - |
| 2018 | Number positive | 0 |
0 |
3 |
0 |
0 |
1 | 0 | 7 | 11 | 3 | - | - | - | - | - | - | - | - | - | - | - | - | - | - | - | - |
'-' = Not available. |
|||||||||||||||||||||||||||
Page details
- Date modified: