
West Nile Virus national surveillance report: July 8 - 14, 2018
Download the alternative format
(PDF format, 1.6 MB, 6 pages)
Organization: Public Health Agency of Canada
Published: July 26 2018
Related Topics
West Nile Virus - Week 28 2018
Canada
- Human
-
As of surveillance week 28, ending on July 14, 2018, no human cases of West Nile virus (WNV) have been reported to the Public Health Agency of Canada (PHAC).
- Mosquito
-
To date (week 28), the PHAC has been notified of 4,020 mosquito pools tested for WNV: 228 in Saskatchewan, 507 in Manitoba, 2,821in Ontario, and 464 in Québec. Of these, twenty-four positive mosquito pools were found: three in Saskatchewan, fifteen in Manitoba (Winnipeg [5], Interlake-Eastern [3], Prairie Mountain [2], and Southern [5]) and six in Ontario (Windsor-Essex County [5] and York Region [1]).
- Wild Bird
-
As of week 28, a total of nineteen dead wild birds have been tested for WNV by the Canadian Wildlife Health Cooperative (CWHC) and Manitoba Agriculture: one in Alberta, four in Saskatchewan, three in Manitoba, six in Ontario, four in Québec, and one in Nova Scotia. Of these, three dead wild birds were positive for WNV in the Interlake-Eastern Regional Health Authority, Manitoba.
- Equine
-
The Canadian Food Inspection Agency (CFIA) has not reported domestic animals tested positive for WNV, since the start of the 2018 WNV season.
United States and U.S. territories
As of July 10, fourteen human cases of WNV have been reported to the Centers for Disease Control and Prevention. Of these, seven (50%) were classified as neuroinvasive disease and seven (50%) as non-neuroinvasive disease. No deaths have been reported. In addition, two presumptive viremic blood donors have been identified.
Europe and Neighboring Countries
As of July 12, twenty-four human cases of West Nile fever have been reported to the European Centre for Disease Prevention and Control in the following countries: Greece (9), Italy (4), and Serbia (11). No deaths have been reported.
Weekly updates: 2018 West Nile fever transmission season
Other Mosquito-borne Diseases - Week 28 2018
Canada
- Eastern Equine Encephalitis virus
-
No human cases of Eastern Equine Encephalitis virus (EEEV) have been reported to the PHAC, since the 2018 season.
- California Serogroup virus
-
In surveillance week 28, no human cases/exposures of California serogroup virus were diagnosed by the National Microbiology Laboratory in the Public Health Agency of Canada.
Figure and tables
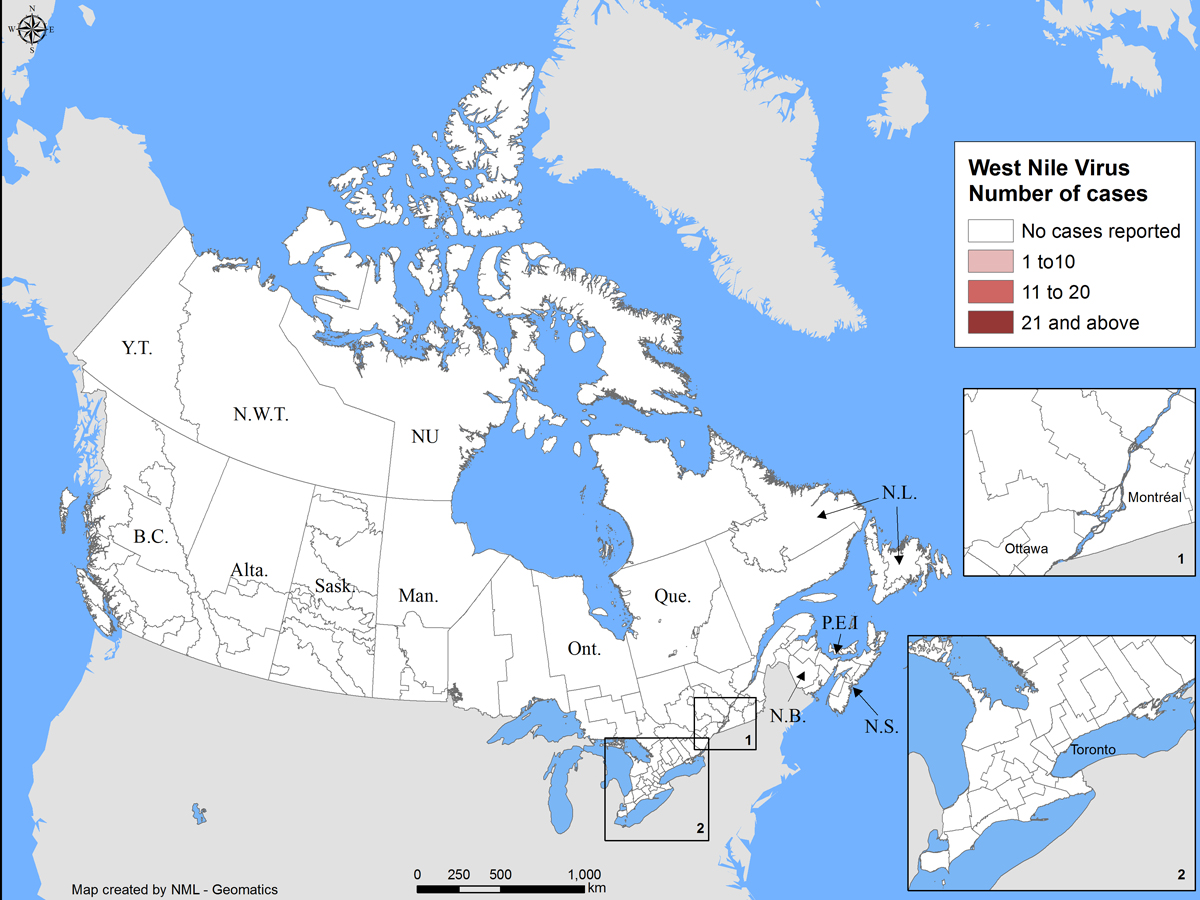
Figure 1 - Text description
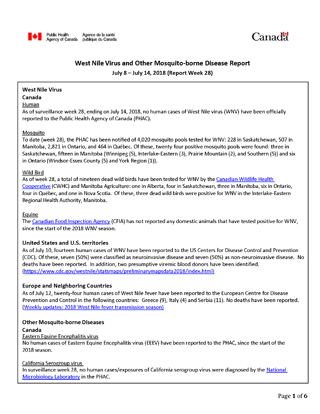
Map showing geographic distribution of human cases of West Nile virus (WNV) in Canada.
As of July 14, 2018, no human cases of WNV were reported to the Public Health Agency of Canada (PHAC).
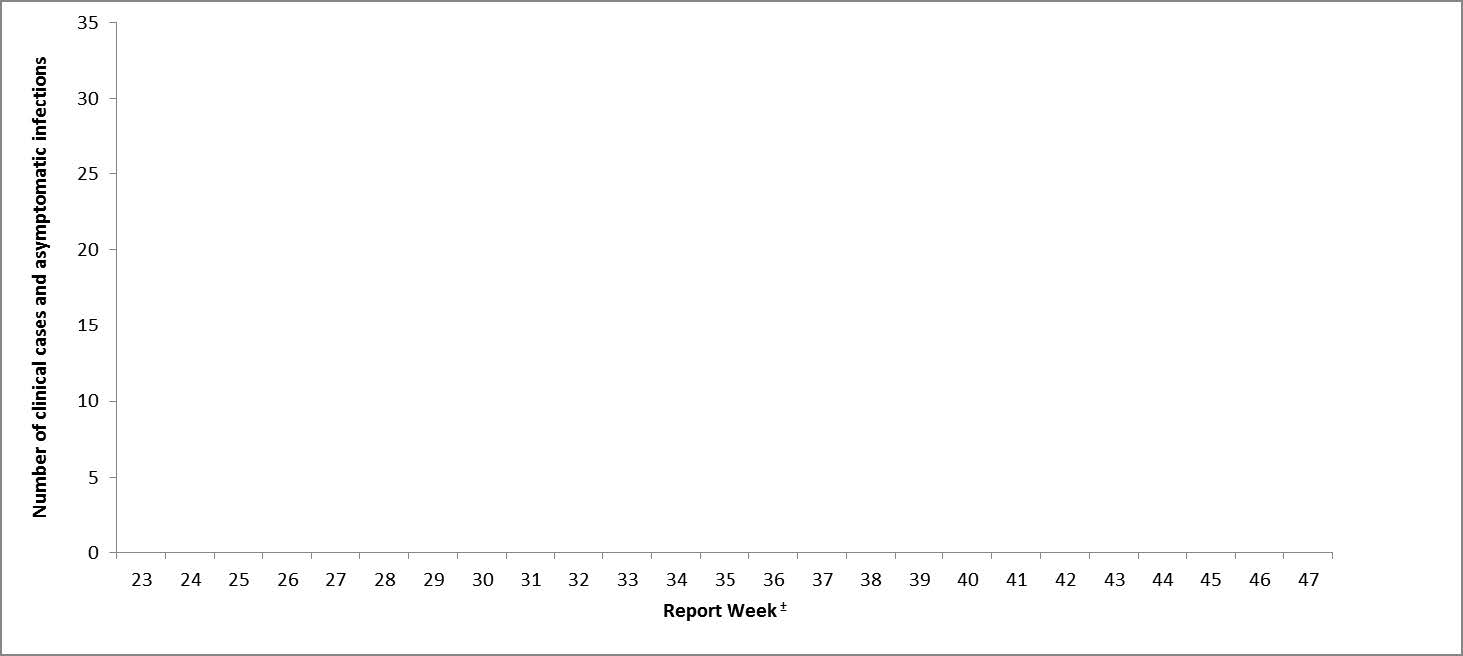
Figure 2 note ±: WNV clinical cases and asymptomatic infections are grouped by report week, based on episode date. Episode date could include one of the following: onset date, diagnosis date, lab sample date or reporting date.
Figure 2 - Text description
As of week 28, ending July 14, 2018, there are no human clinical cases and asymptomatic infections associated with WNV in Canada.
| Province / Territory | Report Weekfigure 2 table note ± | Total | ||||||||||||||||||||||||
|---|---|---|---|---|---|---|---|---|---|---|---|---|---|---|---|---|---|---|---|---|---|---|---|---|---|---|
| 23 | 24 | 25 | 26 | 27 | 28 | 29 | 30 | 31 | 32 | 33 | 34 | 35 | 36 | 37 | 38 | 39 | 40 | 41 | 42 | 43 | 44 | 45 | 46 | 47 | ||
| British Columbia | 0 | 0 | 0 | 0 | 0 | 0 | - | - | - | - | - | - | - | - | - | - | - | - | - | - | - | - | - | - | - | 0 |
| Alberta | 0 | 0 | 0 | 0 | 0 | 0 | - | - | - | - | - | - | - | - | - | - | - | - | - | - | - | - | - | - | - | 0 |
| Manitoba | 0 | 0 | 0 | 0 | 0 | 0 | - | - | - | - | - | - | - | - | - | - | - | - | - | - | - | - | - | - | - | 0 |
| Ontario | 0 | 0 | 0 | 0 | 0 | 0 | - | - | - | - | - | - | - | - | - | - | - | - | - | - | - | - | - | - | - | 0 |
| Québec | 0 | 0 | 0 | 0 | 0 | 0 | - | - | - | - | - | - | - | - | - | - | - | - | - | - | - | - | - | - | - | 0 |
| Total | 0 | 0 | 0 | 0 | 0 | 0 | 0 | 0 | 0 | 0 | 0 | 0 | 0 | 0 | 0 | 0 | 0 | 0 | 0 | 0 | 0 | 0 | 0 | 0 | 0 | 0 |
'-' = Not available. Figure 2 table notes
|
||||||||||||||||||||||||||
Figure 3 note *: WNV clinical cases and asymptomatic infections are grouped by report week, based on episode date. Episode date could include one of the following: onset date, diagnosis date, lab sample date or reporting date.
Figure 3 - Text description
| Year | Report Weekfigure 3 table note * | Total | ||||||||||||||||||||||||
|---|---|---|---|---|---|---|---|---|---|---|---|---|---|---|---|---|---|---|---|---|---|---|---|---|---|---|
| 23 | 24 | 25 | 26 | 27 | 28 | 29 | 30 | 31 | 32 | 33 | 34 | 35 | 36 | 37 | 38 | 39 | 40 | 41 | 42 | 43 | 44 | 45 | 46 | 47 | ||
| 2018 | 0 | 0 | 0 | 0 | 0 | 0 | - | - | - | - | - | - | - | - | - | - | - | - | - | - | - | - | - | - | - | 0 |
| 2017 | 0 | 0 | 1 | 0 | 1 | 1 | 7 | 3 | 8 | 10 | 26 | 31 | 31 | 27 | 13 | 16 | 7 | 8 | 4 | 1 | 1 | 3 | 0 | 0 | 0 | 200 |
| 2016 | 0 | 1 | 0 | 0 | 0 | 0 | 0 | 1 | 5 | 5 | 14 | 11 | 16 | 12 | 9 | 6 | 15 | 5 | 0 | 0 | 3 | 1 | 0 | 1 | 0 | 105 |
| 2014 | 0 | 0 | 0 | 0 | 0 | 0 | 1 | 0 | 0 | 0 | 4 | 3 | 5 | 6 | 1 | 1 | 0 | 0 | 1 | 0 | 0 | 0 | 0 | 0 | 0 | 22 |
| 2012 | 1 | 0 | 0 | 0 | 3 | 5 | 11 | 16 | 27 | 53 | 63 | 57 | 43 | 43 | 45 | 24 | 30 | 14 | 9 | 5 | 1 | 0 | 0 | 0 | 0 | 450 |
| 2007 | 2 | 2 | 3 | 4 | 11 | 35 | 36 | 72 | 139 | 424 | 471 | 443 | 287 | 182 | 116 | 71 | 30 | 18 | 10 | 11 | 5 | 4 | 2 | 0 | 0 | 2,378 |
| 2003 | 0 | 0 | 0 | 1 | 1 | 1 | 5 | 11 | 9 | 27 | 66 | 249 | 323 | 324 | 178 | 107 | 82 | 37 | 14 | 8 | 4 | 3 | 0 | 0 | 0 | 1,450 |
'-' = Not available. Figure 3 table notes
|
||||||||||||||||||||||||||
| Province/Territory | Clinical Cases | Total clinical casestable 1 note 1 | Total travel-related casestable 1 note 2 | Total asymptomatic infectionstable 1 note 3 | ||
|---|---|---|---|---|---|---|
| Neurological syndrome | Non-neurological syndrome | Unclassified/ Unspecified | ||||
| Week 28: July 8 to July 14, 2018 | ||||||
| Newfoundland and Labrador | 0 | 0 | 0 | 0 | 0 | 0 |
| Prince Edward Island | 0 | 0 | 0 | 0 | 0 | 0 |
| Nova Scotia | 0 | 0 | 0 | 0 | 0 | 0 |
| New Brunswick | 0 | 0 | 0 | 0 | 0 | 0 |
| Québec | 0 | 0 | 0 | 0 | 0 | 0 |
| Ontario | 0 | 0 | 0 | 0 | 0 | 0 |
| Manitoba | 0 | 0 | 0 | 0 | 0 | 0 |
| Saskatchewantable 1 note 4 | 0 | - | - | - | - | - |
| Alberta | 0 | 0 | 0 | 0 | 0 | 0 |
| British Columbia | 0 | 0 | 0 | 0 | 0 | 0 |
| Yukon Territory | 0 | 0 | 0 | 0 | 0 | 0 |
| Northwest Territory | 0 | 0 | 0 | 0 | 0 | 0 |
| Nunavut | 0 | 0 | 0 | 0 | 0 | 0 |
| Total | 0 | 0 | 0 | 0 | 0 | 0 |
| Year to date: January 1 to July 14, 2018 | ||||||
| Newfoundland and Labrador | 0 | 0 | 0 | 0 | 0 | 0 |
| Prince Edward Island | 0 | 0 | 0 | 0 | 0 | 0 |
| Nova Scotia | 0 | 0 | 0 | 0 | 0 | 0 |
| New Brunswick | 0 | 0 | 0 | 0 | 0 | 0 |
| Québec | 0 | 0 | 0 | 0 | 0 | 0 |
| Ontario | 0 | 0 | 0 | 0 | 0 | 0 |
| Manitoba | 0 | 0 | 0 | 0 | 0 | 0 |
| Saskatchewantable 1 note 4 | 0 | - | - | - | - | - |
| Alberta | 0 | 0 | 0 | 0 | 0 | 0 |
| British Columbia | 0 | 0 | 0 | 0 | 0 | 0 |
| Yukon Territory | 0 | 0 | 0 | 0 | 0 | 0 |
| Northwest Territory | 0 | 0 | 0 | 0 | 0 | 0 |
| Nunavut | 0 | 0 | 0 | 0 | 0 | 0 |
| Total | 0 | 0 | 0 | 0 | 0 | 0 |
'-' = Not available. Table 1 notes
|
||||||
| Province / Territory | Number of positive mosquito pools | Number of mosquito pools tested | Percentage of positive mosquito pools (%) |
|---|---|---|---|
| Saskatchewan | 3 | 228 | 1.32 |
| Manitoba | 15 | 507 | 2.96 |
| Ontario | 6 | 2,821 | 0.21 |
| Québec | 0 | 464 | 0.00 |
| Total | 24 | 4,020 | 0.60 |
Table 2 notes
|
|||
| Province | Report Week | Total | |||||||||||||||||
|---|---|---|---|---|---|---|---|---|---|---|---|---|---|---|---|---|---|---|---|
| 23 | 24 | 25 | 26 | 27 | 28 | 29 | 30 | 31 | 32 | 33 | 34 | 35 | 36 | 37 | 38 | 39 | 40 | ||
| Saskatchewan | 15 | 18 | 17 | 45 | 54 | 79 | - | - | - | - | - | - | - | - | - | - | - | - | 228 |
| Manitoba | 39 | 89 | 107 | 124 | 122 | 11 | - | - | - | - | - | - | - | - | - | - | - | - | 507 |
| Ontario | - | - | - | 842 | 955 | 1,024 | - | - | - | - | - | - | - | - | - | - | - | - | 2,821 |
| Québec | 69 | 77 | 105 | 105 | - | 108 | - | - | - | - | - | - | - | - | - | - | - | - | 464 |
| Total | 123 | 184 | 229 | 1,116 | 1,131 | 1,239 | - | - | - | - | - | - | - | - | - | - | - | - | 4,020 |
'-' = Not available. Table 3 notes
|
|||||||||||||||||||
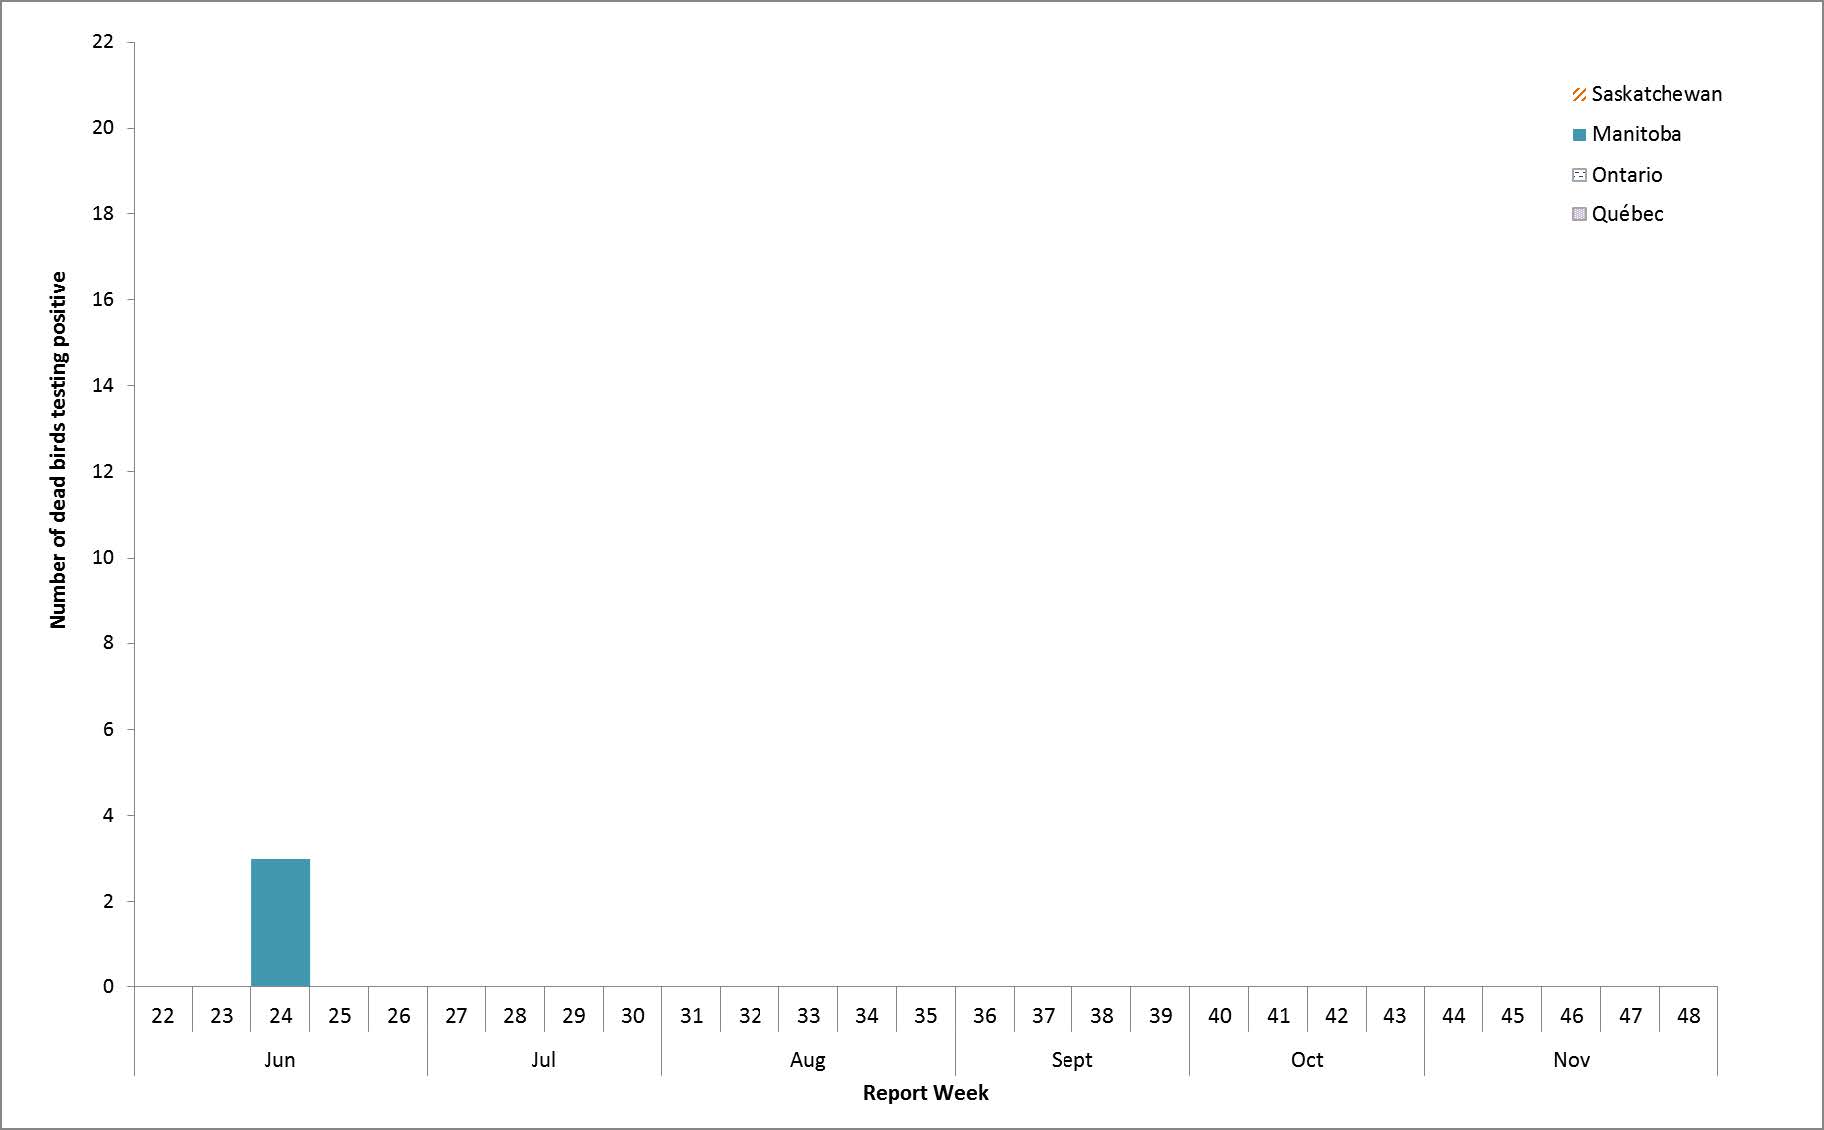
Figure 4 notes
- Figure 4 note *
-
Not all provinces conduct dead wild bird surveillance as part of their respective WNV surveillance program. However, WNV positive dead wild birds may be identified through the National Wildlife Disease Surveillance Program, CWHC.
Figure 4 - Text description
As of week 28, ending July 14, 2018, there are three WNV cases in birds, in Canada.
| Province | Jun | Jul | Aug | Sept | Oct | Nov | Total | |||||||||||||||||||||
|---|---|---|---|---|---|---|---|---|---|---|---|---|---|---|---|---|---|---|---|---|---|---|---|---|---|---|---|---|
| 22 | 23 | 24 | 25 | 26 | 27 | 28 | 29 | 30 | 31 | 32 | 33 | 34 | 35 | 36 | 37 | 38 | 39 | 40 | 41 | 42 | 43 | 44 | 45 | 46 | 47 | 48 | ||
| Québec | 0 | 0 | 0 | 0 | 0 | 0 | 0 | - | - | - | - | - | - | - | - | - | - | - | - | - | - | - | - | - | - | - | - | 0 |
| Ontario | 0 | 0 | 0 | 0 | 0 | 0 | 0 | - | - | - | - | - | - | - | - | - | - | - | - | - | - | - | - | - | - | - | - | 0 |
| Manitoba | 0 | 0 | 3 | 0 | 0 | 0 | 0 | - | - | - | - | - | - | - | - | - | - | - | - | - | - | - | - | - | - | - | - | 3 |
| Saskatchewan | 0 | 0 | 0 | 0 | 0 | 0 | 0 | - | - | - | - | - | - | - | - | - | - | - | - | - | - | - | - | - | - | - | - | 0 |
| Total | 0 | 0 | 3 | 0 | 0 | 0 | 0 | - | - | - | - | - | - | - | - | - | - | - | - | - | - | - | - | - | - | - | - | 3 |
'-' = Not available. |
||||||||||||||||||||||||||||
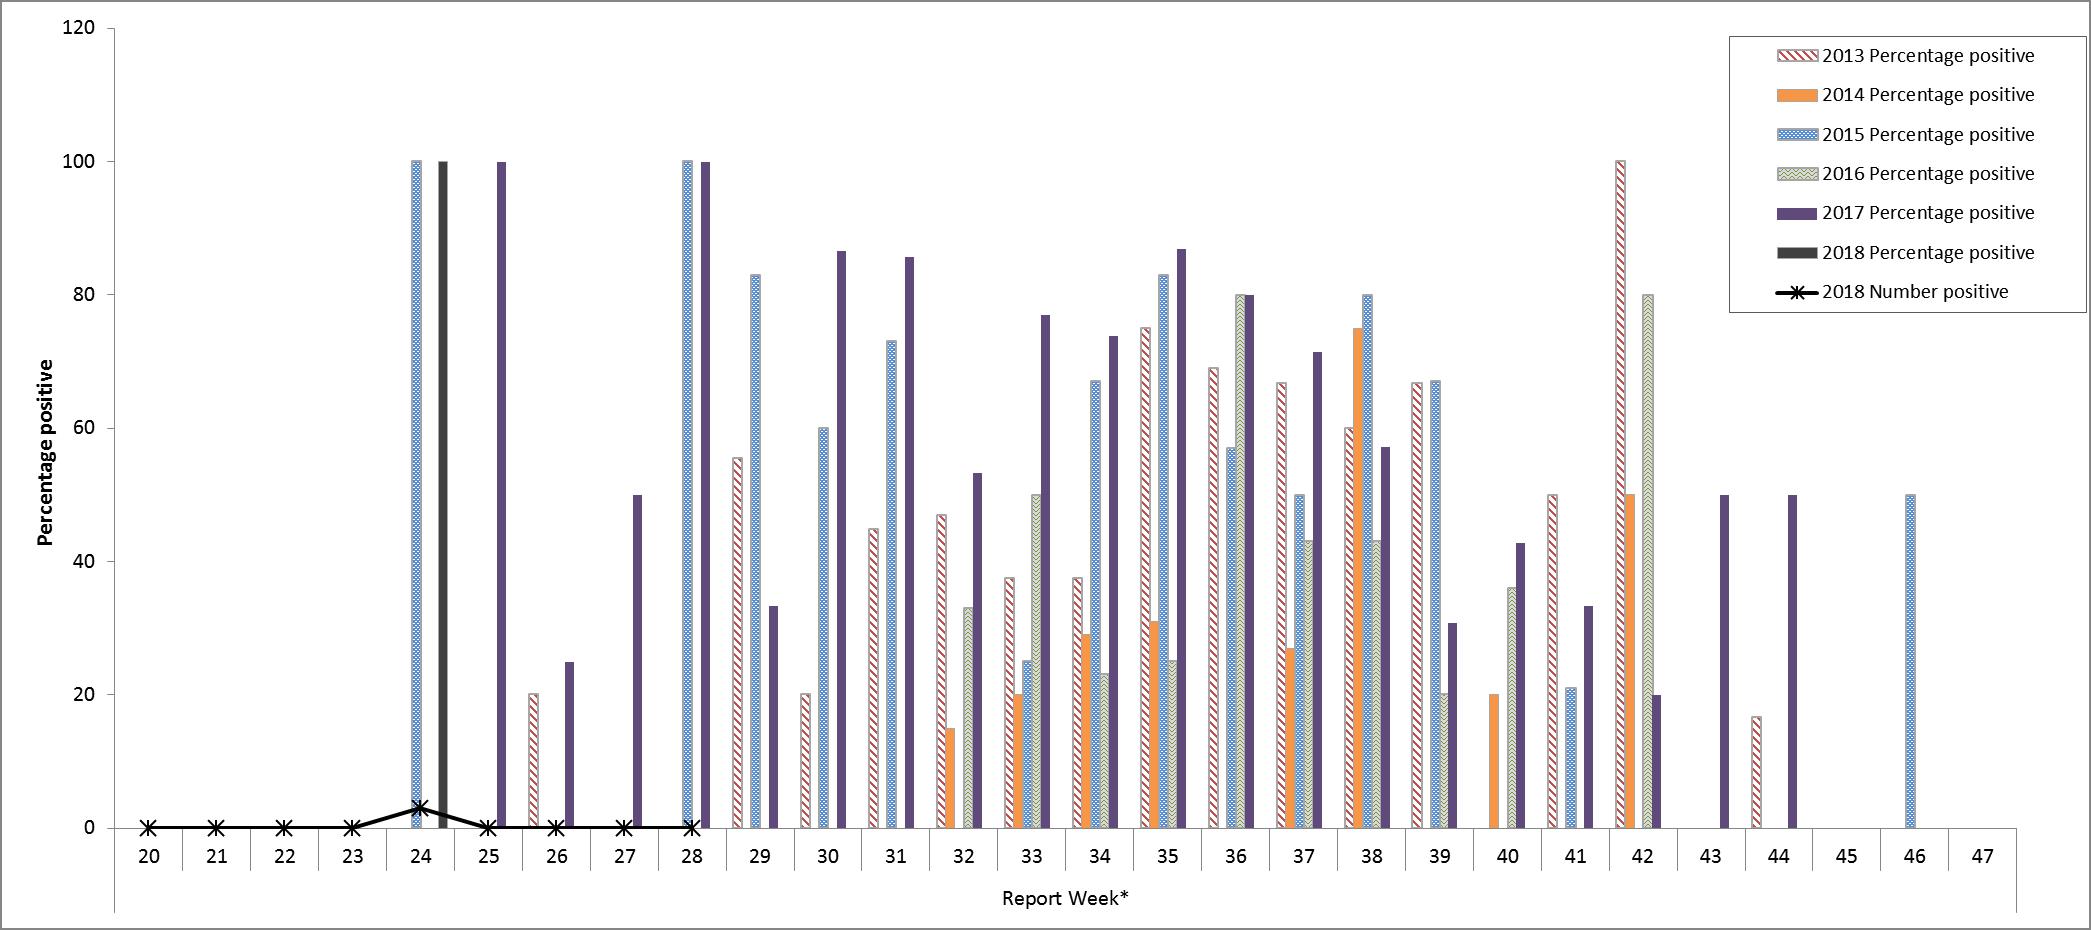
Figure 5 notes
- Figure 5 note *
-
Not all provinces conduct dead wild bird surveillance as part of their respective WNV surveillance program. However, WNV positive dead wild birds may be identified through the National Wildlife Disease Surveillance Program, CWHC.
Figure 5 - Text description
| Jun | Jul | Aug | Sept | Oct | Nov | ||||||||||||||||||||||
|---|---|---|---|---|---|---|---|---|---|---|---|---|---|---|---|---|---|---|---|---|---|---|---|---|---|---|---|
| 22 | 23 | 24 | 25 | 26 | 27 | 28 | 29 | 30 | 31 | 32 | 33 | 34 | 35 | 36 | 37 | 38 | 39 | 40 | 41 | 42 | 43 | 44 | 45 | 46 | 47 | ||
| 2013 | Percentage positive | 0 | 0 | 0 | 0 | 20 | 0 | 0 | 56 | 20 | 45 | 47 | 38 | 38 | 75 | 69 | 67 | 60 | 67 | 0 | 50 | 100 | 0 | 17 | 0 | 0 | 0 |
| 2014 | Percentage positive | 0 | 0 | 0 | 0 | 0 | 0 | 0 | 0 | 0 | 0 | 15 | 20 | 29 | 31 | 0 | 27 | 75 | 0 | 20 | 0 | 50 | 0 | 0 | 0 | 0 | 0 |
| 2015 | Percentage positive | 0 | 0 | 100 | 0 | 0 | 0 | 100 | 83 | 60 | 73 | 0 | 25 | 67 | 83 | 57 | 50 | 80 | 67 | 0 | 21 | 0 | 0 | 0 | 0 | 50 | 0 |
| 2016 | Percentage positive | 0 |
0 |
0 |
0 |
0 |
0 |
0 |
0 |
0 |
0 |
33 |
50 |
23 |
25 |
80 |
43 |
43 |
20 |
36 |
0 |
80 |
0 |
0 |
0 |
0 |
0 |
| 2017 | Percentage positive | 0 |
0 |
0 |
100 |
25 |
50 |
100 |
33 |
87 |
86 |
53 |
77 |
74 |
87 |
80 |
71 |
57 |
31 |
43 |
33 |
20 |
50 |
50 |
0 |
0 |
0 |
| 2018 | Percentage positive | 0 |
0 |
100 |
0 |
0 |
0 | 0 | - | - | - | - | - | - | - | - | - | - | - | - | - | - | - | - | - | - | - |
| 2018 | Number positive | 0 |
0 |
3 |
0 |
0 |
0 | 0 | - | - | - | - | - | - | - | - | - | - | - | - | - | - | - | - | - | - | - |
'-' = Not available. |
|||||||||||||||||||||||||||