National laboratory surveillance of invasive streptococcal disease in Canada, Annual Summary 2013
Table of Contents
- Acknowledgements
- Executive Summary
- Introduction
- Methods
- Results and Discussion
- Conclusion
- Appendix
- References
Figures and Tables
- Figure 1. Incidence of IPD, 2000 – 2013
- Figure 2 Table 1. Incidence of IPD cases per 100 000 in Canada, 2009 – 2013
- Table 2. Number of invasive S. pneumoniae isolates from each province, 2013
- Figure 3. Clinical isolation sites of S. pneumoniae, 2013)
- Figure 4 - 7. Distribution of invasive S. pneumoniae by clinical source, 2013
- Figure 8 - 14. Invasive S. pneumoniae serotypes by age, 2010 – 2013
- Figure 15 – 18. Serotypes 3, 7F, 19A and 22F by year and age group
- Figure 19 - 25. Regional distribution of invasive S. pneumoniae serotypes by age, 2013
- Figure 26 - 29. Serotypes 3, 7F, 19A and 22F by region and age group
- Table 3. Vaccine serotypes, 2013
- Figure 30. Vaccine serotypes by region, 2013
- Figure 31. Vaccine serotypes by age group, 2013
- Figure 32, Table 4. Proportion of PCV7 serotypes (4, 6B, 9V, 14, 18C, 19F, 23F) by age group, 2010 – 2013
- Figure 33, Table 5. Proportion of PCV13 serotypes (1, 5, 7F, 3, 6A, 19A) by age group, 2010 – 2013
- Figure 34, Table 6. Proportion of PPV23 serotypes (2, 8, 9N, 10A, 11A, 12F, 15B, 17F, 20, 22F, 33F) by age group, 2010 – 2013
- Figure 35, Table 7. Proportion of non-vaccine serotypes by age group, 2010 – 2013
- Figure 36. Antimicrobial resistance of S. pneumoniae isolates, 2011 – 2013
- Figure 37. Regional antimicrobial resistance of S. pneumoniae, 2013
- Figure 38. Multi-drug resistance of S. pneumoniae, 2011 – 2013
- Figure 39. Multi-drug resistance of S. pneumoniae serotypes, 2013
- Table 8. Antimicrobial resistance of S. pneumoniae serotypes, 2013
- Figure 40 – 47. Resistance of S. pneumoniae serotypes by antibiotic, 2011 – 2013
- Table 9. Number of invasive S. pyogenes isolates from each province, 2013
- Figure 48 - 49. Clinical isolation sites of S. pyogenes from children and from adults
- Figure 50 - 51. Invasive S. pyogenes in children and in adults
- Figure 52. Regional distribution of S. pyogenes emm types
- Figure 53abc. Invasive S. pyogenes emm types in clinical isolation sources, 2013
- Figure 54, Table 10. Antimicrobial resistance of invasive S. pyogenes, 2010 - 2013
- Table 11. Chloramphenicol non-susceptibility of S. pyogenes emm types, 2010 to 2013
- Figure 55. Macrolide resistance of S. pyogenes emm types, 2013
- Table 12. Invasive S. agalactiae serotypes from each age group, 2013
- Figure 56 – 57, Table 13. Clinical isolation sites of S. agalactiae
- Figure 58. Regional distribution of invasiveS. agalactiae serotypes in 2013
- Figure 59, Table 14. Antimicrobial resistance of invasive S. agalactiae (iGBS) isolated 2010 to 2013
- Table 15. Chloramphenicol non-susceptibility of S. agalactiae serotypes, 2010 to 2013
- Figure 60. Macrolide resistance of S. agalactiae serotypes, 2013
- Appendix
- Table A. Proportion of invasive Streptococcus pneumoniae cases serotyped in Canada, 2013
- Table B. Proportion of invasive Streptococcus pyogenes cases in Canada, 2013
Acknowledgements
Authorship
Streptococcus and STI Unit
Bacteriology and Enteric Diseases Program
National Microbiology Laboratory
Public Health Agency of Canada
Walter H.B. Demczuk, Averil Griffith, Ravinder Singh, Irene Martin (Unit Head)
Dr. Michael Mulvey (Chief, Antimicrobial Resistance and Nosocomial Infections)
Other Contributors:
Vaccine Preventable Diseases Section
Surveillance and Outbreak Response Division
Centre for Immunization and Respiratory Infectious Diseases (CIRID)
Public Health Agency of Canada
Lindsey Sherrard, Susan Squires
Laboratoire de santé publique du Québec (LSPQ)
Dr. Brigitte Lefebvre, Dr. Marc-Christian Domingo, Dr. Cecile Tremblay
Toronto Invasive Bacterial Diseases Network (TIBDN)
Department of Microbiology, Mount Sinai Hospital
Dr. Allison McGeer, Agron Plevneshi, Sylvia Pong-Porter, Karen Green, Kenny Wong and site investigators and staff
The Alberta Provincial Laboratory for Public Health (ProvLab Alberta)
Dr. Gregory J. Tyrrell, Dr. Graham Tipples
Department of Medical Microbiology and Infectious Diseases, Faculty of Medicine, University of Manitoba
Dr. Heather Adam, Dr. Matthew Gilmour, Melanie Baxter, Kim Nichol, Barbara Weshnoweski, Ravi Vashisht, Dr. George Zhanel
This report has been reviewed by Canadian Public Health Laboratory Network (CPHLN) Provincial and Territorial laboratory Directors.
Acknowledgements
The results presented in this report represent streptococcal isolates kindly submitted to the NML from the following hospitals or provincial public health laboratories: British Columbia Centre for Disease Control, Vancouver, British Columbia – Dr. Judy Issac-Renton, Dr. Linda Hoang, Ana Paccagnella, Loretta Janz, Sultana Mithan, Tazim Rahim; Saskatchewan Disease Control Laboratory, Regina, Saskatchewan - Dr. Greg Horsman, Rosanne Kitzul; Cadham Provincial Laboratory, Winnipeg, Manitoba - Dr. Jared Bullard, Dr. Paul Van Caeseele, Denise Sitter; Public Health Ontario, Toronto, Ontario – Dr. Frances Jamieson, Dr. Jonathan Gubbay, Deirdre Soares, Dr. Julianne Kus; Queen Elizabeth II Health Science Centre, Halifax, Nova Scotia - Dr. David Haldane; New Brunswick Regional Hospitals - Dr. Alexander Doroshenko, Maryse Thibeault, Eric Brisson, Francine Plourde, Dr. L. Thibault, Dr. Lewis Abbott, Melanie Stace, Peter Delaney, Linda Turgeon, Tammy Mahaney; Queen Elizabeth Hospital, Charlottetown, Prince Edward Island – Dr. G. German; Newfoundland Public Health Laboratory, St. John's, Newfoundland - Dr. S. Ratnam; Stanton Territorial Hospital Laboratory, Yellowknife, Northwest Territories - Cheryl Case; Whitehorse General Hospital, Whitehorse, Yukon - Rosalyn Robertson, Becky Nash, Chris Cash.
Executive Summary
- 2577 isolates of Streptococcus pneumoniae causing invasive pneumococcal disease (IPD) were characterized in 2013.
- Overall incidence of IPD in all combined age groups has remained relatively stable, at around 9.6 cases per 100 000 (range: 9.0 to 9.8) from 2009 to 2013. Incidence of IPD has declined in children under 5 years of age; however rates in the older age groups have remained relatively unchanged.
- In 2013, the highest incidence rates were observed in adults aged 60 years and over (21.7 cases per 100 000 population), infants aged less than 1 year (17.8 cases per 100 000 population), and children aged 1 to 4 years (11.2 cases per 100 000 population).
- PCV7 serotypes (4, 6B, 9V, 14, 18C, 19F, 23F) have declined from 9.5% to 5.0% of all IPD isolates from 2010 to 2013.
- PCV13 serotypes (1, 5, 3, 6A, 7F, 19A) have declined in all ages, with an overall decline from 45.5% in 2010 to 30.4% in 2013.
- PPV23 serotypes (2, 8, 9N, 10A, 11A, 12F, 15B, 17F, 20, 22F, 33F) have increased in all age groups, with an overall increase from 24.7% (n=670) to 37.6% (n=970) between 2010 and 2013.
- Serotype 22F was the most prevalent serotype in 2013, increasing from 6.7% to 12.1% between 2010 and 2013, respectively, in all age groups.
- Serotype 19A has continued to decline since 2010 from 19.0% to 11.6% in 2013. Reductions from 2012 levels have been observed in < 2 year olds from 20.7% to 11.6%; and in the 2 – 4 year olds from 23.6% to 18.7%.
- Serotype 7F has similarly decreased from 14.3% in 2010 to 8.8% in 2013, and none were reported from children < 2 years of age during 2013.
- Serotype 3 has increased slightly overall since 2010 from 8.3% to 8.9% of the 2013 isolates, decreasing in <2 year olds from 8.6% to 5.4% since 2012, and increasing in the 5-14 year old age group from 2.9% to 5.1% since 2012.
- Antimicrobial susceptibility testing of 1,061 isolates indicated 24.8% were resistant to clarithromycin, 11.9% to penicillin, 9.9% to doxycycline, 5.9% to clindamycin, 7.4% to trimethoprim/sulfamethoxazole, 2.6% to meropenem, and 2.3% to imipenem. No resistance was seen to linezolid, tigecycline, or vancomycin.
- Increases of antimicrobial resistance have been observed to clarithromycin, trimethoprim/sulfamethoxazole, imipenem and meropenem.
- Multi-drug resistance to 3 or more classes of antimicrobials was observed in 7.5% of the isolates tested with the highest rates seen in serotypes 15A (50.0%) and 19A (28.9%).
- Of the 1294 invasive S. pyogenes (Group A Streptococcus) tested during 2013, emm1 continues to be most predominant accounting for 28.4% of isolates from those <15 years old and 23.7% of those ≥15 years old. Emm89 was the next most prevalent with 7.4% of isolates from children and 9.9% from adults.
- 0.6% of 1294 S. pyogenes isolates tested in 2013 where non-susceptible to chloramphenicol, 8.5% to erythromycin, and 2.3% to clindamycin. No resistance was seen to penicillin or vancomycin.
- 416 invasive S. agalactiae (Group B Streptococcus) were submitted to NML during 2013, with serotypes III (23.8%), V (19.7%) and Ia (17.8%) being most predominant.
- Increases of erythromycin resistance (48.8%) and clarithromycin (28.8%) have been observed in 2013 in Group B Streptococci.
Introduction
As of April 1, 2010, the National Microbiology Laboratory (NML), Winnipeg began offering surveillance, reference diagnostics and outbreak support on invasive Streptococcus pneumoniae(pneumococcus), Streptococcus pyogenes(Group A Streptococcus), and Streptococcus agalactiae (Group B Streptococcus). The Streptococcus and STI Unit also participates in a number of international, national and regional surveillance programs.
This report is intended to present the current distribution of serotypes of S. pneumoniae, emm types of S. pyogenes, and serotypes of S. agalactiae isolated from sterile sites that are forwarded from Canadian provincial and territorial public health laboratories, regional health units and reference centres to the NML. To broaden the representativeness of the data presented, the aggregated counts also include data submitted by Laboratoire de santé publique du Québec (LSPQ), Toronto Invasive Bacterial Diseases Network (TIBDN), and the Alberta Provincial Laboratory for Public Health (ProvLab Alberta), organizations that perform their own serotyping.
Invasive pneumococcal disease (IPD, S. pneumoniae) causes severe infections such as meningitis and bacteraemia [Marchessault, 2002; Schuchat, 1997] with children and the elderly being at greatest risk for infection [Robinson, 2001; Scott, 1996]. Of the 92 distinct pneumococcal serotypes currently recognized, the majority of disease worldwide is caused by only a few serotypes.
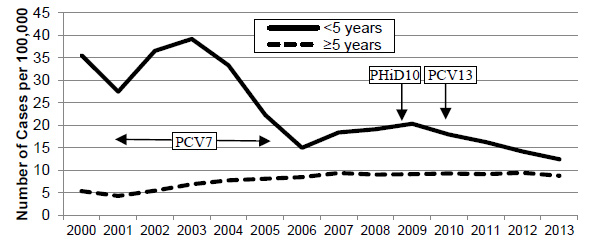
A 7-valent pneumococcal conjugate vaccine (PCV7); consisting of serotypes 4, 6B, 9V, 14, 18C, 19F, and 23F; was introduced in all provincial and territorial vaccination programs between 2002 and 2006 [Bettinger, 2010], that led to a dramatic decrease in incidence of disease and in the constituent serotypes in children [Bettinger, 2010; Bjornson, 2007; Bruce, 2008; Demczuk, 2012; Deng, 2013; DeWals, 2012; Kellner, 2008; Kellner, 2009; Lim, 2013; Lovgren, 1998; McIntosh, 2011; NACI, 2010; Shahidi, 2008; Tyrrell, 2009; Weinberger, 2011;] (Figure 1). After the introduction of vaccination programs, paediatric IPD increased due to serotype replacement among pneumococcal infections with increases in non-PCV7 serotype infections, such as serotypes 7F and 19A [Kellner, 2009; Tyrrell, 2009]. In 2009, a 10-valent Pneumococcal, Haemophilus influenzae, and Diptheria vaccine (PHiD10); consisting of all the PCV7 serotypes plus serotypes 1, 5 and 7F; was used in Québec, Ontario and Newfoundland and Labrador. The 13-valent pneumococcal conjugate vaccine (PCV13); consisting of all PHiD10 serotypes plus serotypes 3, 6A and 19A; was recommended for use in Canada in 2010 [National Advisory Committee on Immunization (NACI), 2010] and introduced by all provinces and territories between mid-2010 and mid-2011. Immunization schedules vary by jurisdiction, however National Advisory Committee on Immunization (NACI) / Public Health Agency of Canada (PHAC) recommendations have been published [NACI , 2010; Public Health Agency of Canada (PHAC), 2013]. The 23-valent pneumococcal polysaccharide vaccine (PPV23) vaccine is available for adults; however it is not effective in children due to a poor T-cell-independent antibody response in immature immune systems [Merck & Co. Inc.]. Surveillance of the distribution of S. pneumoniae serotypes is important to inform vaccine composition and monitor for possible serotype replacement [Demczuk, 2010, Demczuk 2013].
Figure 1. Incidence of IPD in Canada, 2000-2013
Incidence of IPD in Canada, 2000-2013 - Text Description
This figure represents the number of cases per 100,000 of invasive pneumococcal disease distributed between 2000 and 2013 for <5 years of age and ≥ 5 years of age.
| Year | Number of Cases per 100,000 | |
|---|---|---|
| <5 years | ≥5 years | |
| 2000 | 35.59 | 5.36 |
| 2001 | 27.47 | 4.25 |
| 2002 | 36.54 | 5.46 |
| 2003 | 39.22 | 6.85 |
| 2004 | 33.33 | 7.74 |
| 2005 | 22.28 | 8.11 |
| 2006 | 14.99 | 8.48 |
| 2007 | 18.41 | 9.36 |
| 2008 | 19.10 | 9.03 |
| 2009 | 20.33 | 9.14 |
| 2010 | 17.95 | 9.28 |
| 2011 | 16.27 | 9.11 |
| 2012 | 14.15 | 9.44 |
| 2013 | 12.44 | 8.76 |
Invasive Group A Streptococcus (iGAS, S. pyogenes) is nationally notifiable and responsible for a wide range of disease including bacteraemia, toxic shock syndrome and skin and soft tissue infections of which necrotizing fasciitis is most notorious [Cunningham, 2000]. Surveillance of strains is important to monitor increasing virulence patterns associated with this organism [Schwartz, 1990; Siljander, 2010]. The M protein, encoded by the emm gene, is an important virulence factor and an epidemiological marker used to characterize S. pyogenes isolates.
Group B Streptococcus (GBS, S. agalactiae) is commonly associated with neo-natal disease where the highest infection risk is during childbirth, and often treated prophylactically with antibiotics. Infant associated disease is nationally notifiable, however GBS is also is also an increasing health concern among adults causing septicemia, meningitis, pneumonia, bone, joint and tissue infections. At risk adults groups include those with underlying medical conditions, pregnant women, and those residing in extended health care facilities [Lamangni, 2013].
Methods
A total of 2577 invasive S. pneumoniae, 1294 invasive S. pyogenes and 420 S. agalactiae isolates are included in this report for 2013. Data for 2013 includes test results for isolates submitted to the NML by provincial and territorial public health laboratories and data provided by jurisdictions including: 529 IPD isolates serotyped by Laboratoire de santé publique du Québec , 342 by the Alberta Provincial Laboratory for Public Health and 310 by the Toronto Invasive Bacterial Diseases Network.
Data submitted with bacterial isolates included patient age, gender, clinical source and date of collection. Multiple isolates, with the same serotype, collected from the same patient within 14 days were counted once with the most invasive isolation site assigned. Meningitis related isolates were regarded as most invasive, followed by blood and then other sterile sites. The data were aggregated by age into <2 year, 2-14 year, 15-49 year, 50-64 year and ≥65 year age groups; and regionally into Western (British Columbia, Alberta, Saskatchewan, Manitoba, Yukon Territories, Northwest Territories and Nunavut); Central (Ontario and Québec) and Eastern (New Brunswick, Nova Scotia, Prince Edward Island, Newfoundland and Labrador) regions of Canada. Caution should be exercised when interpreting the data presented in this report as the overall interpretation of the results is difficult due to the limitations related to the isolates available for testing. Only a subset of laboratory isolates within each province may be submitted for testing and therefore this report does not reflect true incidence or rates of disease in Canada. Submission of isolates to the NML is voluntary and not standardized across the country. Accordingly, aggregated national and regional summaries are presented in this report.
Validated surveillance data for 2009 to 2012 were obtained through the Canadian Notifiable Disease Surveillance System (CNDSS) [PHAC, 2014]. Population data were obtained from Statistics Canada July 1st annual population estimates, 2009 to 2013. The population of provinces and territories for whom case data were not available were excluded from the denominator.
All IPD isolates were screened by bile solubility and optochin (Oxoid) analyses and iGAS/GBS isolates were confirmed using PYR (Pyrrolidonyl-α-naphthylamide) reaction and susceptibility to bacitracin (Oxoid) and trimethoprim/sulfamethoxazole susceptibility discs (BBL; 1.25/23.75 µg/ml) [Spellerberg, 2007]. Sterile clinical isolation sites include blood, cerebrospinal fluid or other nervous tissue (CSF), pleural fluid, peritoneal fluid, pericardial fluid, joint fluid, internal body sites and muscle including surgical or biopsy samples and aspirates. For S. pyogenes, any isolation site was tested if a case of toxic shock syndrome or necrotizing fasciitis was associated with the infection [Canadian Communicable Disease Report, 2009; Minnesota Department of Health].
Serotyping of IPD at NML is performed by observing the Quellung reaction using pool, group, type and factor commercial antisera (SSI Diagnostica; Statens Serum Institute, Copenhagen, Denmark) [Austrian, 1976; Lovgren, 1998]. Isolates for which a Quellung reaction is not observed are confirmed by rpoB gene sequencing [Drancourt, 2004; Clinical Laboratory Standards Institute (CLSI), 2008] as well as PCR serotyping as outlined at: http://www.cdc.gov/ncidod/biotech/strep/pcr.htm .
In 2011, the NML began a collaboration with the University of Manitoba – Health Sciences Centre - Canadian Antimicrobial Resistance Alliance (CARA) to provide antimicrobial susceptibility testing (AST) for S. pneumoniae isolates submitted to the NML called SAVE (S. pneumoniae Serotyping and Antimicrobial Susceptibility: Assessment for Vaccine Efficacy in Canada After the Introduction of PCV-13). All sterile-site isolates from any age group causing invasive pneumococcal disease submitted by 8 participating jurisdictions (Saskatchewan, Manitoba, Ontario, Quebec, Nova Scotia, Prince Edward Island, New Brunswick, Newfoundland and Labrador) are included in the study. A panel of 18 antimicrobials are tested, including: penicillin, amoxicillin/clavulanate, cefuroxime, ceftriaxone, clarithromycin, ertapenem, meropenem, clindamycin, vancomycin, ciprofloxacin, levofloxacin, moxifloxacin, linezolid, tigecycline, trimethoprim/sulfamethoxazole and doxycycline. MICs of these antimicrobials are determined by the CLSI broth microdilution method using 96-well custom designed microtitre plates [CLSI, 2011]. MIC interpretive standards were defined according to CLSI breakpoints (M100-S21, 2011) for all antibiotics except ciprofloxacin and doxycycline for which EUCAST interpretative breakpoints were used [EUCAST, 2012].
The emm types were determined for all invasive Group A Streptococcus isolates submitted to the NML. Isolates were characterized using the emm sequencing CDC protocol available at: http://www.cdc.gov/ncidod/biotech/strep/M-ProteinGene_typing.htm. The emm sequences obtained are compared with the CDC (Atlanta) data bank (www.cdc.gov/ncidod/biotech/strep/strepblast.htm) and results reported to the type level, not the subtype level (emm4.4 is reported as emm4). Antimicrobial susceptibilities were determined by Kirby-Bauer Disc diffusion for chloramphenicol (CHL, 30 µg), erythromycin (ERY, 15 µg), clindamycin (CLI, 2 µg), penicillin (PEN, 10 µg) and vancomycin (VAN, 30, µg) according to CLSI guidelines [Kellner, 2009].
Serotypes of Group B Streptococcus were determined using commercial latex agglutinating antisera (SSI Diagnostica; Statens Serum Institute, Copenhagen, Denmark).
Results and Discussion
Streptococcus pneumoniae
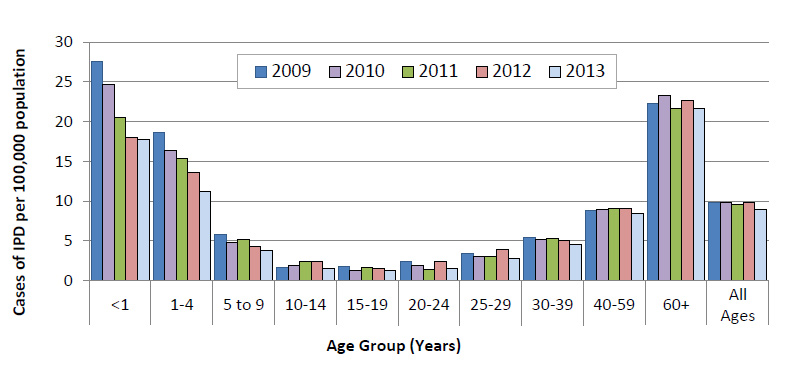
Overall incidence of IPD in Canada has remained relatively stable over the previous 5 years. In 2013, the overall incidence of IPD was 9.0 cases per 100 000 population, with higher rates of disease still seen in infants <1 year of age (17.8 cases per 100 000 population), children 1 – 4 years of age (11.2 cases per 100 000 population) and in the 60+ age group (21.7 cases per 100 000 population) (Figure 2). There has been a steady decline of illness in the < 1 year old age groups from 27.6 to 17.8 cases per 100 000 population, and in the 1 - 4 year olds from 18.7 to 11.2 cases per 100 000 between 2009 and 2013.
Figure 2. Incidence of IPD cases per 100 000 in Canada, 2009 – 2013
Incidence of IPD cases per 100 000 in Canada, 2009 – 2013 - Text Description
This figure represents the number of cases per 100,000 of invasive pneumococcal disease distributed between 2009 and 2013 by age group.
| Age Group | Percentage by Year | ||||
|---|---|---|---|---|---|
| 2009 | 2010 | 2011 | 2012 | 2013 | |
| <1 | 27.6 | 24.7 | 20.5 | 18.1 | 17.8 |
| 1-4 | 18.7 | 16.4 | 15.3 | 13.6 | 11.2 |
| 5 to 9 | 5.8 | 4.8 | 5.2 | 4.4 | 3.8 |
| 10-14 | 1.6 | 1.8 | 2.4 | 2.4 | 1.5 |
| 15-19 | 1.8 | 1.3 | 1.6 | 1.6 | 1.2 |
| 20-24 | 2.4 | 1.9 | 1.4 | 2.5 | 1.5 |
| 25-29 | 3.5 | 3.1 | 3.0 | 4.0 | 2.8 |
| 30-39 | 5.5 | 5.1 | 5.4 | 5.1 | 4.5 |
| 40-59 | 8.9 | 9.0 | 9.1 | 9.1 | 8.4 |
| 60+ | 22.3 | 23.3 | 21.6 | 22.7 | 21.7 |
| All Ages | 9.8 | 9.8 | 9.6 | 9.8 | 9.0 |
| Year | Age Group (Years) | ||||||||||
|---|---|---|---|---|---|---|---|---|---|---|---|
| <1 | 1-4 | 5-9 | 10-14 | 15-19 | 20-24 | 25-29 | 30-39 | 40-59 | 60+ | All Ages | |
| 2009 | 27.6 | 18.7 | 5.8 | 1.6 | 1.8 | 2.4 | 3.5 | 5.5 | 8.9 | 22.3 | 9.8 |
| 2010 | 24.7 | 16.4 | 4.8 | 1.8 | 1.3 | 1.9 | 3.1 | 5.1 | 9 | 23.3 | 9.8 |
| 2011 | 20.5 | 15.3 | 5.2 | 2.4 | 1.6 | 1.4 | 3 | 5.4 | 9.1 | 21.6 | 9.6 |
| 2012 | 18.1 | 13.6 | 4.4 | 2.4 | 1.6 | 2.5 | 4 | 5.1 | 9.1 | 22.7 | 9.8 |
| 2013 | 17.8 | 11.2 | 3.8 | 1.5 | 1.2 | 1.5 | 2.8 | 4.5 | 8.4 | 21.7 | 9.0 |
Population data were obtained from Statistics Canada July 1st annual population estimates, 2009 to 2013. The population of provinces and territories for whom case data were not available were excluded from the denominator.
Distribution of Streptococcus pneumoniae Serotypes
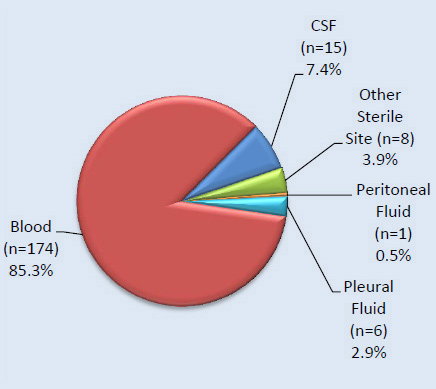
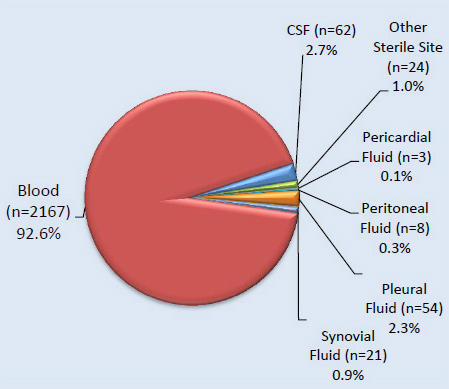
Of the 2577 IPD isolates serotyped in 2013, children <2 years of age accounted for 5.0% (n=129), children aged 2 – 4 years for 2.9% (n=75), children aged 5 – 14 years for 3.0% (n=78), adults aged 15 – 49 years for 20.6% (n=532), adults aged 50 – 64 years for 26.5% (n=682), and seniors aged ≥65 years for 40.6% (n=1047) (Table 2). Blood was the most frequent clinical isolation site accounting for 92.1% (n=2373) of all isolates (Figure 3 and 4). Serotype 22F was evenly prevalent in all sources representing 10% to 12% of isolates from each clinical isolation source, whereas 7F represented a higher proportion of blood (8.9%, n=212) and pleural fluid isolates (11.7%, n=7) than CSF (5.2%, n=4) or other sterile clinical isolation sites (4.5%, n=3). Similarly, serotype 3 was more predominant in blood and pleural fluid representing 9.1% (n=216) and 11.7% (n=7) of the isolates, respectively. Of the 2542 isolates with gender information specified, 55% (n=1390) were from male patients.
The overall most predominant serotypes in 2013 were 22F (12.1%, n=311), 19A (11.6%, n=299), 3 (8.9%, n=229), and 7F (8.8%, n=226), together representing 41.3% (n=1065) of all IPD in Canada (Figure 4). Serotype 22F (a component of PPV23) increased since 2010, becoming the most predominant serotype overall in Canada in 2013. Serotypes 19A, 7F and 6A have continued a steady decline since 2010 with 19A decreasing from 19.0% (n=517) in 2010 to 11.6% (n=299) in 2013; 7F from 14.3% (n=389) to 8.8% (n=226); and 6A from 2.7% (n=72) to 0.6% (n=15). From 2010 to 2013 serotype 3 has increased slightly from 8.3% (n=225) to 8.9% (n=229), despite concurrent decreases in the other additional PCV13-associated serotypes (1, 5, 7F, 6A and 19A).
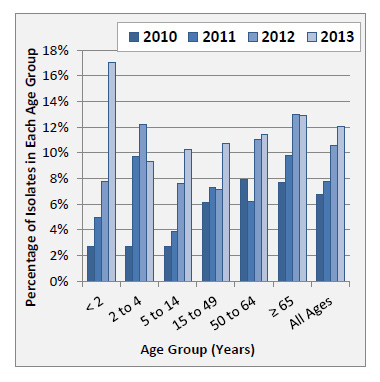
Serotype 22F: The largest increase in the relative proportion of 22F isolates was seen in the < 2 year olds increasing from 7.8% (n=9) in 2012 to 17.1% (n=22) in 2013. Increases from 7.6% (n=8) to 10.3% (n=8) in the 5 – 14 age group, and from 7.2% (n=44) to 10.7% (n=57) in the 15 – 49 year old age groups were also observed between 2012 and 2013, respectively. Serotype 22F has declined slightly in the 2 – 4 year olds from 12.2% (n=15) of the isolates in 2012 to 9.3% (n=7) in 2013, but still considerably elevated from 2010 levels of 2.7% (n=4). Levels of 22F in the 50 – 64 and ≥65 year olds have remained relatively constant since last year at 11.4% (n=78) and 12.9% (n=135), respectively (Figure 18).
Serotype 19A: Continued declines of 19A has been observed in 2013 among all age groups, except the 5 – 14 year olds where proportions have increased to 28.2% (n=22) in 2013 from 27.6% (n=29) in 2012, and more significantly from 12.7% (n=14) in 2010. Dramatic reductions from 2012 levels have been seen in <2 year olds from 20.7% (n=24) to 11.6% (n=15) and in the 2 – 4 year olds from 23.6% (n=29) to 18.7 (n=14). More modest declines were seen in the 15 – 49 year olds from 10.8% (n=66) in 2012 to 9.6% (n=51) in 2013; in the 50 – 64 year olds from 12.8% (n=89) to 12.0% (n=82); and the ≥65 year olds from 12.9% (n=135) to 10.9% (n=114) (Figure 15).
Serotype 7F: There were no serotype 7F isolates reported among the 129 isolates collected from children < 2 years of age during 2013, decreasing from representing 11.4% (n=21) in 2010. Between 2010 and 2013 serotype 7F has also decreased in the 2 – 4 year old age group from 9.5% (n=14) to 2.7% (n=2), the 5 – 14 year olds from 25.5% (n=28) to 9.0% (n=7), 15 – 49 year olds from 24.3% (n=142) to 15.6% (n=83), 50 – 64 year olds from 12.3% (n=85) to 8.7% (n=59), and in the ≥65 year olds from 9.9% (n=96) to 6.9% (n=72). Interestingly in the 5 – 14 year old age group, a concurrent decrease of 7F and increase of 19A has been observed, despite both being PCV13 serotypes (Figure 16).
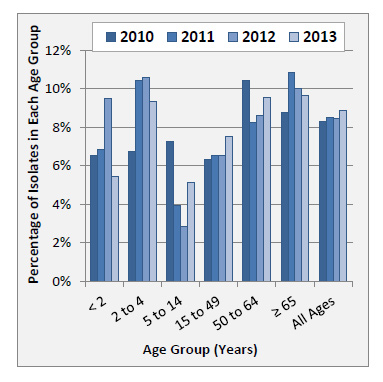
Serotype 3: After increasing in the < 2 year olds from 6.5% (n=12) to 8.6% (n=10) of the isolates from 2010 to 2012, serotype 3 decreased in 2013 to 5.4% (n=7). Conversely in the 5 – 14 year old age group, serotype 3 declined from 7.3% (n=8) to 2.9% (n=3) from 2010 to 2012, then increased during 2013 to 5.1% (n=4). In the other age groups, serotype 3 has remained at relatively similar levels over the past few years at 9.3% (n=7) in the 2 – 4 year old, 7.5% (n=40) in the 15 – 49 year old, 9.5% (n=65) in the 50 – 64 year old, and 9.7% (n=101) in the ≥65 year old age groups during 2013 (Figure 17).
Other Serotypes: Although currently present in low numbers, the PPV23 serotype 15B has increased in <2 year olds from 1.6% (n=3) to 7.8% (n=10), and in 2 – 4 year olds from 3.4% (n=5) to 10.7% (n=8), from 2012 to 2013. Serotype 33F (PPV23) has also increased since 2012 in these age groups from 2.6% (n=3) to 8.5% (n=11) in the <2 year olds and from 1.6% (n=2) to 4.0% (n=3) in the 2 – 4 year olds. Serotype 21 increased in the < 2 year old age group from 1.7% (n=2) to 5.4% (n=7) from 2012 to 2013, and 23B continues to increase in the 2 – 4 year olds from 2.0% (n=3) to 9.0% (n=6).
| Province | < 2 | 2 – 4 | 5 – 14 | 15 – 49 | 50 – 64 | ≥65 | Not Given | Total |
|---|---|---|---|---|---|---|---|---|
| British Columbia | 9 | 8 | 20 | 74 | 83 | 135 | - | 329 |
| Alberta | 14 | 15 | 9 | 93 | 101 | 105 | 5 | 342 |
| Saskatchewan | 9 | 3 | 3 | 42 | 30 | 38 | - | 125 |
| Manitoba | 11 | 3 | 5 | 40 | 23 | 41 | 8 | 131 |
| Ontario | 37 | 27 | 26 | 155 | 244 | 418 | 16 | 923 |
| Québec | 42 | 14 | 11 | 93 | 152 | 219 | - | 531 |
| New Brunswick | 3 | 1 | 1 | 11 | 18 | 39 | 1 | 74 |
| Nova Scotia | 2 | 3 | 1 | 14 | 20 | 33 | - | 73 |
| Prince Edward Island | - | - | - | 5 | 2 | 5 | 3 | 15 |
| Newfoundland and Labrador | - | 1 | 2 | 1 | 4 | 11 | 1 | 20 |
| Yukon Territories | - | - | - | - | 2 | 1 | - | 3 |
| Northwest Territories | - | - | - | 3 | 3 | 2 | - | 8 |
| Nunavut | 2 | - | - | 1 | - | - | - | 3 |
| Canada | 129 | 75 | 78 | 532 | 682 | 1047 | 34 | 2577 |
Figure 3. Clinical isolation sites of S. pneumoniae, 2013
Figure 3a. Isolates from < 5 years of age (N=204)Footnote *
Clinical isolation sites of S. pneumoniae, 2013 - Text Description
This figure represents the clinical isolation sites of S. pneumoniae isolates submitted for testing from individuals < 5 years of age (N=204).
| Source | Percentage of Isolates |
|---|---|
| Blood (n=174) | 85.3% |
| CSF (n=15) | 7.4% |
| Other Sterile Site (n=8) | 3.9% |
| Peritoneal Fluid (n=1) | 0.5% |
| Pleural Fluid (n=6) | 2.9% |
Figure 3b. Isolates from ≥ 5 years of age (N=2339)Footnote *
Clinical isolation sites of S. pneumoniae, 2013 - Text Description
This figure represents the clinical isolation sites of S. pneumoniae isolates submitted for testing from individuals ≥5 years of age (N=2339).
| Source | Percentage of Isolates |
|---|---|
| Blood (n=2167) | 92.6% |
| CSF (n=62) | 2.7% |
| Other Sterile Site (n=24) | 1.0% |
| Pericardial Fluid (n=3) | 0.1% |
| Peritoneal Fluid (n=8) | 0.3% |
| Pleural Fluid (n=54) | 2.3% |
| Synovial Fluid (n=21) | 0.9% |
Figure 4. Distribution of invasive S. pneumoniae serotypes from blood, 2013
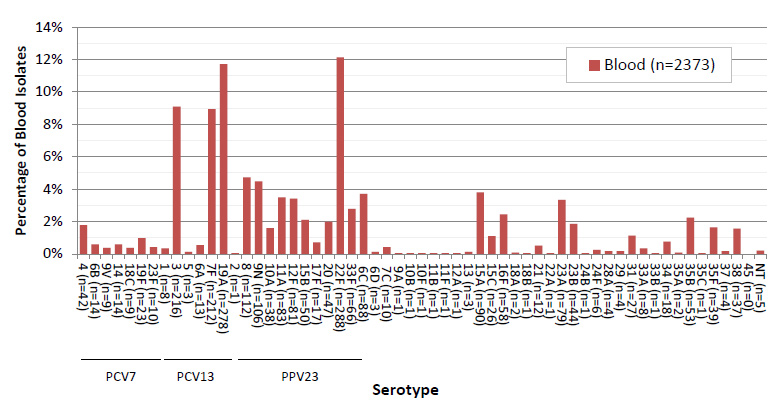
Distribution of invasive S. pneumoniae serotypes from blood, 2013 - Text Description
This figure represents the percentage of isolates distributed within each serotype for all blood isolates in 2013.
| Serotype | Percentage of Blood Isolates (n=2373) |
|---|---|
| 4 (n=42) | 1.8% |
| 6B (n=14) | 0.6% |
| 9V (n=9) | 0.4% |
| 14 (n=14) | 0.6% |
| 18C (n=9) | 0.4% |
| 19F (n=23) | 1.0% |
| 23F (n=10) | 0.4% |
| 1 (n=8) | 0.3% |
| 3 (n=216) | 9.1% |
| 5 (n=3) | 0.1% |
| 6A (n=13) | 0.5% |
| 7F (n=212) | 8.9% |
| 19A (n=278) | 11.7% |
| 2 (n=1) | 0.0% |
| 8 (n=112) | 4.7% |
| 9N (n=106) | 4.5% |
| 10A (n=38) | 1.6% |
| 11A (n=83) | 3.5% |
| 12F (n=81) | 3.4% |
| 15B (n=50) | 2.1% |
| 17F (n=17) | 0.7% |
| 20 (n=47) | 2.0% |
| 22F (n=288) | 12.1% |
| 33F (n=66) | 2.8% |
| 6C (n=88) | 3.7% |
| 6D (n=3) | 0.1% |
| 7C (n=10) | 0.4% |
| 9A (n=1) | 0.0% |
| 10B (n=1) | 0.0% |
| 10F (n=1) | 0.0% |
| 11B (n=1) | 0.0% |
| 11F (n=1) | 0.0% |
| 12A (n=1) | 0.0% |
| 13 (n=3) | 0.1% |
| 15A (n=90) | 3.8% |
| 15C (n=26) | 1.1% |
| 16F (n=58) | 2.4% |
| 18A (n=2) | 0.1% |
| 18B (n=1) | 0.0% |
| 21 (n=12) | 0.5% |
| 22A (n=1) | 0.0% |
| 23A (n=79) | 3.3% |
| 23B (n=44) | 1.9% |
| 24B (n=1) | 0.0% |
| 24F (n=6) | 0.3% |
| 28A (n=4) | 0.2% |
| 29 (n=4) | 0.2% |
| 31 (n=27) | 1.1% |
| 33A (n=8) | 0.3% |
| 33B (n=1) | 0.0% |
| 34 (n=18) | 0.8% |
| 35A (n=2) | 0.1% |
| 35B (n=53) | 2.2% |
| 35C (n=1) | 0.0% |
| 35F (n=39) | 1.6% |
| 37 (n=4) | 0.2% |
| 38 (n=37) | 1.6% |
| 45 (n=0) | 0.0% |
| NT (n=5) | 0.2% |
Figure 5. Distribution of invasive S. pneumoniae serotypes from CSF, 2013
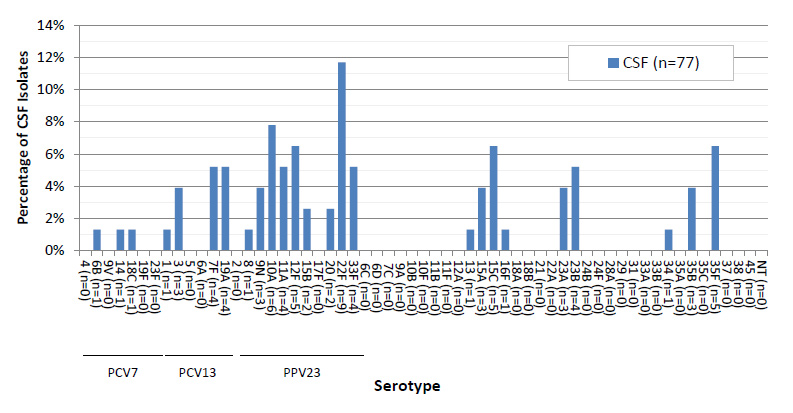
Distribution of invasive S. pneumoniae serotypes from CSF, 2013 - Text Description
This figure represents the percentage of isolates distributed within each serotype for all CSF isolates in 2013 (N=77).
| Serotype | Percentage of CSF Isolates (n=77) |
|---|---|
| 4 (n=0) | 0.0% |
| 6B (n=1) | 1.3% |
| 9V (n=0) | 0.0% |
| 14 (n=1) | 1.3% |
| 18C (n=1) | 1.3% |
| 19F (n=0) | 0.0% |
| 23F (n=0) | 0.0% |
| 1 (n=1) | 1.3% |
| 3 (n=3) | 3.9% |
| 5 (n=0) | 0.0% |
| 6A (n=0) | 0.0% |
| 7F (n=4) | 5.2% |
| 19A (n=4) | 5.2% |
| 2 (n=0) | 0.0% |
| 8 (n=1) | 1.3% |
| 9N (n=3) | 3.9% |
| 10A (n=6) | 7.8% |
| 11A (n=4) | 5.2% |
| 12F (n=5) | 6.5% |
| 15B (n=2) | 2.6% |
| 17F (n=0) | 0.0% |
| 20 (n=2) | 2.6% |
| 22F (n=9) | 11.7% |
| 33F (n=4) | 5.2% |
| 6C (n=0) | 0.0% |
| 6D (n=0) | 0.0% |
| 7C (n=0) | 0.0% |
| 9A (n=0) | 0.0% |
| 10B (n=0) | 0.0% |
| 10F (n=0) | 0.0% |
| 11B (n=0) | 0.0% |
| 11F (n=0) | 0.0% |
| 12A (n=0) | 0.0% |
| 13 (n=1) | 1.3% |
| 15A (n=3) | 3.9% |
| 15C (n=5) | 6.5% |
| 16F (n=1) | 1.3% |
| 18A (n=0) | 0.0% |
| 18B (n=0) | 0.0% |
| 21 (n=0) | 0.0% |
| 22A (n=0) | 0.0% |
| 23A (n=3) | 3.9% |
| 23B (n=4) | 5.2% |
| 24B (n=0) | 0.0% |
| 24F (n=0) | 0.0% |
| 28A (n=0) | 0.0% |
| 29 (n=0) | 0.0% |
| 31 (n=0) | 0.0% |
| 33A (n=0) | 0.0% |
| 33B (n=0) | 0.0% |
| 34 (n=1) | 1.3% |
| 35A (n=0) | 0.0% |
| 35B (n=3) | 3.9% |
| 35C (n=0) | 0.0% |
| 35F (n=5) | 6.5% |
| 37 (n=0) | 0.0% |
| 38 (n=0) | 0.0% |
| 45 (n=0) | 0.0% |
| NT (n=0) | 0.0% |
Figure 6. Distribution of invasive S. pneumoniae serotypes from pleural fluid, 2013
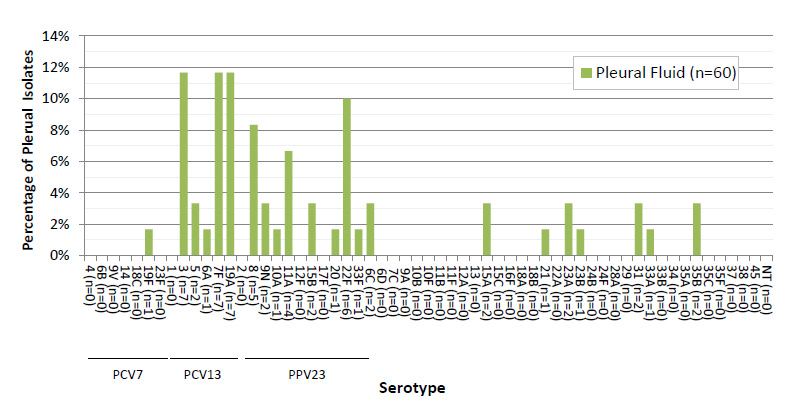
Distribution of invasive S. pneumoniae serotypes from pleural fluid, 2013 - Text Description
This figure represents the percentage of isolates distributed within each serotype for all pleural fluid isolates in 2013 (N=60).
| Serotype | Percentage of Pleural Fluid Isolates (n=60) |
|---|---|
| 4 (n=0) | 0.0% |
| 6B (n=0) | 0.0% |
| 9V (n=0) | 0.0% |
| 14 (n=0) | 0.0% |
| 18C (n=0) | 0.0% |
| 19F (n=1) | 1.7% |
| 23F (n=0) | 0.0% |
| 1 (n=0) | 0.0% |
| 3 (n=7) | 11.7% |
| 5 (n=2) | 3.3% |
| 6A (n=1) | 1.7% |
| 7F (n=7) | 11.7% |
| 19A (n=7) | 11.7% |
| 2 (n=0) | 0.0% |
| 8 (n=5) | 8.3% |
| 9N (n=2) | 3.3% |
| 10A (n=1) | 1.7% |
| 11A (n=4) | 6.7% |
| 12F (n=0) | 0.0% |
| 15B (n=2) | 3.3% |
| 17F (n=0) | 0.0% |
| 20 (n=1) | 1.7% |
| 22F (n=6) | 10.0% |
| 33F (n=1) | 1.7% |
| 6C (n=2) | 3.3% |
| 6D (n=0) | 0.0% |
| 7C (n=0) | 0.0% |
| 9A (n=0) | 0.0% |
| 10B (n=0) | 0.0% |
| 10F (n=0) | 0.0% |
| 11B (n=0) | 0.0% |
| 11F (n=0) | 0.0% |
| 12A (n=0) | 0.0% |
| 13 (n=0) | 0.0% |
| 15A (n=2) | 3.3% |
| 15C (n=0) | 0.0% |
| 16F (n=0) | 0.0% |
| 18A (n=0) | 0.0% |
| 18B (n=0) | 0.0% |
| 21 (n=1) | 1.7% |
| 22A (n=0) | 0.0% |
| 23A (n=2) | 3.3% |
| 23B (n=1) | 1.7% |
| 24B (n=0) | 0.0% |
| 24F (n=0) | 0.0% |
| 28A (n=0) | 0.0% |
| 29 (n=0) | 0.0% |
| 31 (n=2) | 3.3% |
| 33A (n=1) | 1.7% |
| 33B (n=0) | 0.0% |
| 34 (n=0) | 0.0% |
| 35A (n=0) | 0.0% |
| 35B (n=2) | 3.3% |
| 35C (n=0) | 0.0% |
| 35F (n=0) | 0.0% |
| 37 (n=0) | 0.0% |
| 38 (n=0) | 0.0% |
| 45 (n=0) | 0.0% |
| NT (n=0) | 0.0% |
Figure 7. Distribution of invasive S. pneumoniae serotypes from other sterile sites, 2013
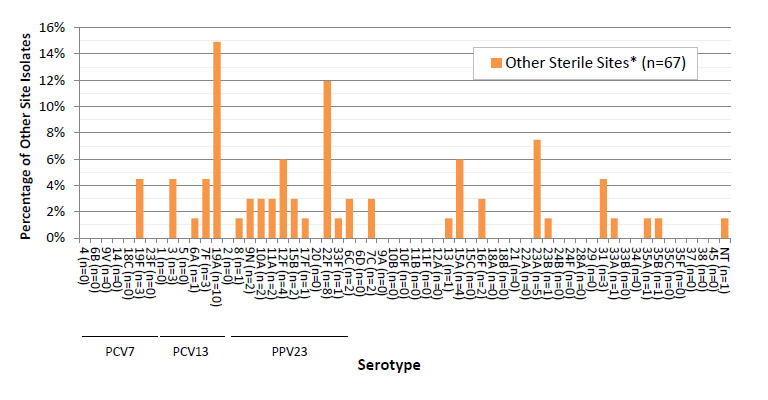
* Other Sterile Sites include: 4 pericardial fluid, 10 peritoneal fluid, 21 synovial fluid and 32 from sites such as deep tissue, biopsy and surgical samples.
Distribution of invasive S. pneumoniae serotypes from other sterile sites, 2013 - Text Description
This figure represents the percentage of isolates distributed within each serotype for all other sterile site isolates in 2013 (N=67).
| Serotype | Percentage of Isolates from Other Sterile Sites* (n=67) |
|---|---|
| 4 (n=0) | 0.0% |
| 6B (n=0) | 0.0% |
| 9V (n=0) | 0.0% |
| 14 (n=0) | 0.0% |
| 18C (n=0) | 0.0% |
| 19F (n=3) | 4.5% |
| 23F (n=0) | 0.0% |
| 1 (n=0) | 0.0% |
| 3 (n=3) | 4.5% |
| 5 (n=0) | 0.0% |
| 6A (n=1) | 1.5% |
| 7F (n=3) | 4.5% |
| 19A (n=10) | 14.9% |
| 2 (n=0) | 0.0% |
| 8 (n=1) | 1.5% |
| 9N (n=2) | 3.0% |
| 10A (n=2) | 3.0% |
| 11A (n=2) | 3.0% |
| 12F (n=4) | 6.0% |
| 15B (n=2) | 3.0% |
| 17F (n=1) | 1.5% |
| 20 (n=0) | 0.0% |
| 22F (n=8) | 11.9% |
| 33F (n=1) | 1.5% |
| 6C (n=2) | 3.0% |
| 6D (n=0) | 0.0% |
| 7C (n=2) | 3.0% |
| 9A (n=0) | 0.0% |
| 10B (n=0) | 0.0% |
| 10F (n=0) | 0.0% |
| 11B (n=0) | 0.0% |
| 11F (n=0) | 0.0% |
| 12A (n=0) | 0.0% |
| 13 (n=1) | 1.5% |
| 15A (n=4) | 6.0% |
| 15C (n=0) | 0.0% |
| 16F (n=2) | 3.0% |
| 18A (n=0) | 0.0% |
| 18B (n=0) | 0.0% |
| 21 (n=0) | 0.0% |
| 22A (n=0) | 0.0% |
| 23A (n=5) | 7.5% |
| 23B (n=1) | 1.5% |
| 24B (n=0) | 0.0% |
| 24F (n=0) | 0.0% |
| 28A (n=0) | 0.0% |
| 29 (n=0) | 0.0% |
| 31 (n=3) | 4.5% |
| 33A (n=1) | 1.5% |
| 33B (n=0) | 0.0% |
| 34 (n=0) | 0.0% |
| 35A (n=1) | 1.5% |
| 35B (n=1) | 1.5% |
| 35C (n=0) | 0.0% |
| 35F (n=0) | 0.0% |
| 37 (n=0) | 0.0% |
| 38 (n=0) | 0.0% |
| 45 (n=0) | 0.0% |
| NT (n=1) | 1.5% |
* Other Sterile Sites include: 4 pericardial fluid, 10 peritoneal fluid, 21 synovial fluid and 32 from sites such as deep tissue, biopsy and surgical samples. |
|
Figure 8. Invasive S. pneumoniae serotypes in all combined age groups, 2010 – 2013
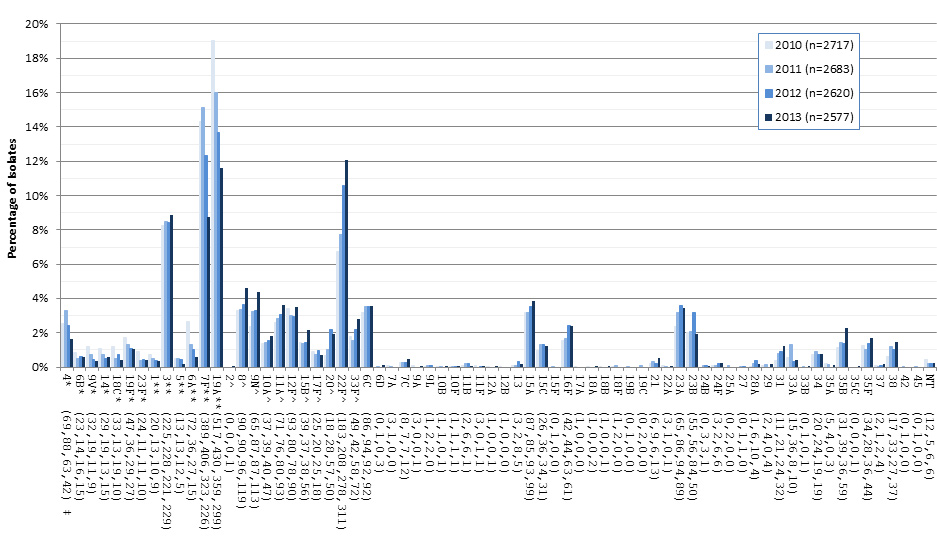
*Component of PCV7; ** Component of PCV13; ^ Component of PPV23; ‡ Number of isolates for 2010, 2011, 2012 and 2013, respectively.
Invasive S. pneumoniae serotypes in all combined age groups, 2010 – 2013 - Text Description
This figure represents the number of isolates of each serotype from all isolates collected between 2010-2013
| Serotype | 2010 (n=2717) | 2011 (n=2683) | 2012 (n=2620) | 2013 (n=2577) |
|---|---|---|---|---|
| 4* (69,88,63,42) ‡ | 2.54% | 3.28% | 2.40% | 1.63% |
| 6B* (23,14,16,15) | 0.85% | 0.52% | 0.61% | 0.58% |
| 9V* (32,19,11,9) | 1.18% | 0.71% | 0.42% | 0.35% |
| 14* (29,19,13,15) | 1.07% | 0.71% | 0.50% | 0.58% |
| 18C* (33,13,19,10) | 1.21% | 0.48% | 0.73% | 0.39% |
| 19F* (47,36,29,27) | 1.73% | 1.34% | 1.11% | 1.05% |
| 23F* (24,11,11,10) | 0.88% | 0.41% | 0.42% | 0.39% |
| 1** (20,13,10,9) | 0.74% | 0.48% | 0.38% | 0.35% |
| 3** (225,228,221,229) | 8.28% | 8.50% | 8.44% | 8.89% |
| 5** (13,13,12,5) | 0.48% | 0.48% | 0.46% | 0.19% |
| 6A** (72,36,27,15) | 2.65% | 1.34% | 1.03% | 0.58% |
| 7F** (389,406,323,226) | 14.32% | 15.13% | 12.33% | 8.77% |
| 19A**(517,430,359,299) | 19.03% | 16.03% | 13.70% | 11.60% |
| 2^ (0,0,0,1) | 0.00% | 0.00% | 0.00% | 0.04% |
| 8^ (90,90,96,119) | 3.31% | 3.35% | 3.66% | 4.62% |
| 9N^ (65,87,87,113) | 2.39% | 3.24% | 3.32% | 4.38% |
| 10A^ (37,39,40,47) | 1.36% | 1.45% | 1.53% | 1.82% |
| 11A^ (71,76,80,93) | 2.61% | 2.83% | 3.05% | 3.61% |
| 12F^ (93,80,78,90) | 3.42% | 2.98% | 2.98% | 3.49% |
| 15B^ (39,37,38,56) | 1.44% | 1.38% | 1.45% | 2.17% |
| 17F^ (25,20,25,18) | 0.92% | 0.75% | 0.95% | 0.70% |
| 20^ (18,28,57,50) | 0.66% | 1.04% | 2.18% | 1.94% |
| 22F^ (183,208,278,311) | 6.74% | 7.75% | 10.61% | 12.07% |
| 33F^ (49,42,58,72) | 1.80% | 1.57% | 2.21% | 2.79% |
| 6C (86,94,92,92) | 3.17% | 3.50% | 3.51% | 3.57% |
| 6D (0,1,0,3) | 0.00% | 0.04% | 0.00% | 0.12% |
| 7A (3,1,0,0) | 0.11% | 0.04% | 0.00% | 0.00% |
| 7C (8,7,7,12) | 0.29% | 0.26% | 0.27% | 0.47% |
| 9A (3,0,0,1) | 0.11% | 0.00% | 0.00% | 0.04% |
| 9L (1,2,2,0) | 0.04% | 0.07% | 0.08% | 0.00% |
| 10B (1,1,0,1) | 0.04% | 0.04% | 0.00% | 0.04% |
| 10F (1,1,1,1) | 0.04% | 0.04% | 0.04% | 0.04% |
| 11B (2,6,6,1) | 0.07% | 0.22% | 0.23% | 0.04% |
| 11F (3,0,1,1) | 0.11% | 0.00% | 0.04% | 0.04% |
| 12A (1,0,0,1) | 0.04% | 0.00% | 0.00% | 0.04% |
| 12B (1,0,0,0) | 0.04% | 0.00% | 0.00% | 0.00% |
| 13 (3,2,8,5) | 0.11% | 0.07% | 0.31% | 0.19% |
| 15A (87,85,93,99) | 3.20% | 3.17% | 3.55% | 3.84% |
| 15C (26,36,34,31) | 0.96% | 1.34% | 1.30% | 1.20% |
| 15F (0,1,0,0) | 0.00% | 0.04% | 0.00% | 0.00% |
| 16F (42,44,63,61) | 1.55% | 1.64% | 2.40% | 2.37% |
| 17A (1,0,0,0) | 0.04% | 0.00% | 0.00% | 0.00% |
| 18A (1,0,0,2) | 0.04% | 0.00% | 0.00% | 0.08% |
| 18B (1,0,0,1) | 0.04% | 0.00% | 0.00% | 0.04% |
| 18F (1,2,0,0) | 0.04% | 0.07% | 0.00% | 0.00% |
| 19B (0,1,0,0) | 0.00% | 0.04% | 0.00% | 0.00% |
| 19C (0,2,0,0) | 0.00% | 0.07% | 0.00% | 0.00% |
| 21 (6,9,6,13) | 0.22% | 0.34% | 0.23% | 0.50% |
| 22A (3,1,0,1) | 0.11% | 0.04% | 0.00% | 0.04% |
| 23A (65,86,94,89) | 2.39% | 3.21% | 3.59% | 3.45% |
| 23B (55,56,84,50) | 2.02% | 2.09% | 3.21% | 1.94% |
| 24B (0,3,3,1) | 0.00% | 0.11% | 0.11% | 0.04% |
| 24F (3,2,6,6) | 0.11% | 0.07% | 0.23% | 0.23% |
| 25A (0,2,0,0) | 0.00% | 0.07% | 0.00% | 0.00% |
| 27 (0,1,1,0) | 0.00% | 0.04% | 0.04% | 0.00% |
| 28A (1,6,10,4) | 0.04% | 0.22% | 0.38% | 0.16% |
| 29 (2,4,0,4) | 0.07% | 0.15% | 0.00% | 0.16% |
| 31 (11,21,24,32) | 0.40% | 0.78% | 0.92% | 1.24% |
| 33A (15,36,8,10) | 0.55% | 1.34% | 0.31% | 0.39% |
| 33B (0,1,0,1) | 0.00% | 0.04% | 0.00% | 0.04% |
| 34 (20,24,19,19) | 0.74% | 0.89% | 0.73% | 0.74% |
| 35A (5,4,0,3) | 0.18% | 0.15% | 0.00% | 0.12% |
| 35B (31,39,36,59) | 1.14% | 1.45% | 1.37% | 2.29% |
| 35C (0,0,0,1) | 0.00% | 0.00% | 0.00% | 0.04% |
| 35F (34,28,36,44) | 1.25% | 1.04% | 1.37% | 1.71% |
| 37 (2,1,2,4) | 0.07% | 0.04% | 0.08% | 0.16% |
| 38 (17,33,27,37) | 0.63% | 1.23% | 1.03% | 1.44% |
| 42 (0,1,0,0) | 0.00% | 0.04% | 0.00% | 0.00% |
| 45 (0,1,0,0) | 0.00% | 0.04% | 0.00% | 0.00% |
| NT (12,5,6,6) | 0.44% | 0.19% | 0.23% | 0.23% |
| *Component of PCV7; ** Component of PCV13; ^ Component of PPV23; ‡ Number of isolates for 2010, 2011, 2012 and 2013, respectively | ||||
Figure 9. Invasive S. pneumoniae serotypes in < 2 year olds, 2010 – 2013
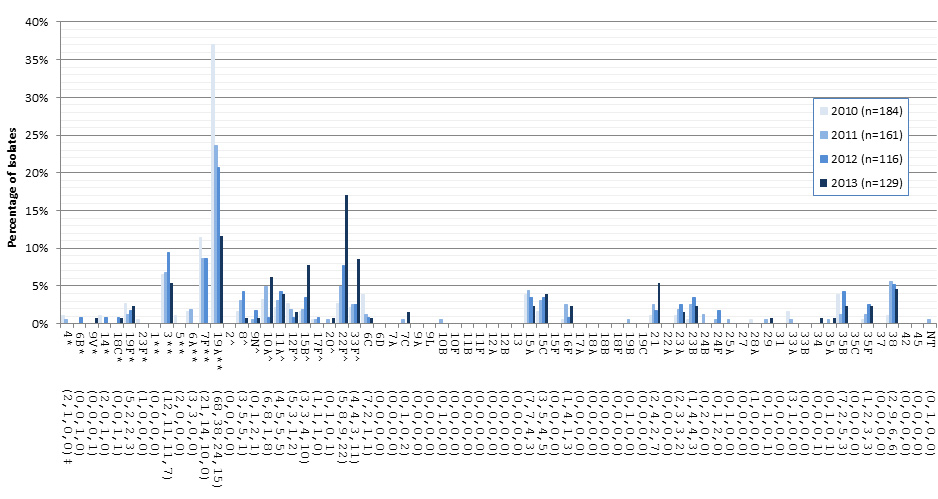
*Component of PCV7; ** Component of PCV13; ^ Component of PPV23; ‡ Number of isolates for 2010, 2011, 2012 and 2013, respectively.
Invasive S. pneumoniae serotypes in < 2 year olds, 2010 – 2013 - Text Description
This figure represents the number of isolates of each serotype from < 2 year olds collected between 2010-2013.
| Serotype | 2010 (n=184) | 2011 (n=161) | 2012 (n=116) | 2013 (n=129) |
|---|---|---|---|---|
| 4* (2,1,0,0)‡ | 1.09% | 0.62% | 0.00% | 0.00% |
| 6B* (0,0,1,0) | 0.00% | 0.00% | 0.86% | 0.00% |
| 9V* (0,0,0,1) | 0.00% | 0.00% | 0.00% | 0.78% |
| 14* (2,0,1,0) | 1.09% | 0.00% | 0.86% | 0.00% |
| 18C* (0,0,1,1) | 0.00% | 0.00% | 0.86% | 0.78% |
| 19F* (5,2,2,3) | 2.72% | 1.24% | 1.72% | 2.33% |
| 23F* (1,0,0,0) | 0.54% | 0.00% | 0.00% | 0.00% |
| 1** (0,0,0,0) | 0.00% | 0.00% | 0.00% | 0.00% |
| 3** (12,11,11,7) | 6.52% | 6.83% | 9.48% | 5.43% |
| 5** (2,0,0,0) | 1.09% | 0.00% | 0.00% | 0.00% |
| 6A** (3,3,0,0) | 1.63% | 1.86% | 0.00% | 0.00% |
| 7F** (21,14,10,0) | 11.41% | 8.70% | 8.62% | 0.00% |
| 19A** (68,38,24,15) | 36.96% | 23.60% | 20.69% | 11.63% |
| 2^ (0,0,0,0) | 0.00% | 0.00% | 0.00% | 0.00% |
| 8^ (3,5,5,1) | 1.63% | 3.11% | 4.31% | 0.78% |
| 9N^ (0,1,2,1) | 0.00% | 0.62% | 1.72% | 0.78% |
| 10A^ (6,8,1,8) | 3.26% | 4.97% | 0.86% | 6.20% |
| 11A^ (4,5,5,5) | 2.17% | 3.11% | 4.31% | 3.88% |
| 12F^ (5,3,1,2) | 2.72% | 1.86% | 0.86% | 1.55% |
| 15B^ (3,3,4,10) | 1.63% | 1.86% | 3.45% | 7.75% |
| 17F^ (1,1,1,0) | 0.54% | 0.62% | 0.86% | 0.00% |
| 20^ (0,1,0,1) | 0.00% | 0.62% | 0.00% | 0.78% |
| 22F^ (5,8,9,22) | 2.72% | 4.97% | 7.76% | 17.05% |
| 33F^ (4,4,3,11) | 2.17% | 2.48% | 2.59% | 8.53% |
| 6C (7,2,1,1) | 3.80% | 1.24% | 0.86% | 0.78% |
| 6D (0,0,0,0) | 0.00% | 0.00% | 0.00% | 0.00% |
| 7A (0,0,0,0) | 0.00% | 0.00% | 0.00% | 0.00% |
| 7C (0,1,0,2) | 0.00% | 0.62% | 0.00% | 1.55% |
| 9A (0,0,0,0) | 0.00% | 0.00% | 0.00% | 0.00% |
| 9L (0,0,0,0) | 0.00% | 0.00% | 0.00% | 0.00% |
| 10B (0,1,0,0) | 0.00% | 0.62% | 0.00% | 0.00% |
| 10F (0,0,0,0) | 0.00% | 0.00% | 0.00% | 0.00% |
| 11B (0,0,0,0) | 0.00% | 0.00% | 0.00% | 0.00% |
| 11F (0,0,0,0) | 0.00% | 0.00% | 0.00% | 0.00% |
| 12A (0,0,0,0) | 0.00% | 0.00% | 0.00% | 0.00% |
| 12B (0,0,0,0) | 0.00% | 0.00% | 0.00% | 0.00% |
| 13 (0,0,0,0) | 0.00% | 0.00% | 0.00% | 0.00% |
| 15A (7,7,4,3) | 3.80% | 4.35% | 3.45% | 2.33% |
| 15C (3,5,4,5) | 1.63% | 3.11% | 3.45% | 3.88% |
| 15F (0,0,0,0) | 0.00% | 0.00% | 0.00% | 0.00% |
| 16F (1,4,1,3) | 0.54% | 2.48% | 0.86% | 2.33% |
| 17A (0,0,0,0) | 0.00% | 0.00% | 0.00% | 0.00% |
| 18A (0,0,0,0) | 0.00% | 0.00% | 0.00% | 0.00% |
| 18B (0,0,0,0) | 0.00% | 0.00% | 0.00% | 0.00% |
| 18F (0,0,0,0) | 0.00% | 0.00% | 0.00% | 0.00% |
| 19B (0,1,0,0) | 0.00% | 0.62% | 0.00% | 0.00% |
| 19C (0,0,0,0) | 0.00% | 0.00% | 0.00% | 0.00% |
| 21 (2,4,2,7) | 1.09% | 2.48% | 1.72% | 5.43% |
| 22A (0,0,0,0) | 0.00% | 0.00% | 0.00% | 0.00% |
| 23A (2,3,3,2) | 1.09% | 1.86% | 2.59% | 1.55% |
| 23B (1,4,4,3) | 0.54% | 2.48% | 3.45% | 2.33% |
| 24B (0,2,0,0) | 0.00% | 1.24% | 0.00% | 0.00% |
| 24F (0,1,2,0) | 0.00% | 0.62% | 1.72% | 0.00% |
| 25A (0,1,0,0) | 0.00% | 0.62% | 0.00% | 0.00% |
| 27 (0,0,0,0) | 0.00% | 0.00% | 0.00% | 0.00% |
| 28A (1,0,0,0) | 0.54% | 0.00% | 0.00% | 0.00% |
| 29 (0,1,0,1) | 0.00% | 0.62% | 0.00% | 0.78% |
| 31 (0,0,0,0) | 0.00% | 0.00% | 0.00% | 0.00% |
| 33A (3,1,0,0) | 1.63% | 0.62% | 0.00% | 0.00% |
| 33B (0,0,0,0) | 0.00% | 0.00% | 0.00% | 0.00% |
| 34 (0,0,0,1) | 0.00% | 0.00% | 0.00% | 0.78% |
| 35A (0,1,0,1) | 0.00% | 0.62% | 0.00% | 0.78% |
| 35B (7,2,5,3) | 3.80% | 1.24% | 4.31% | 2.33% |
| 35C (0,0,0,0) | 0.00% | 0.00% | 0.00% | 0.00% |
| 35F (1,2,3,3) | 0.54% | 1.24% | 2.59% | 2.33% |
| 37 (0,0,0,0) | 0.00% | 0.00% | 0.00% | 0.00% |
| 38 (2,9,6,6) | 1.09% | 5.59% | 5.17% | 4.65% |
| 42 (0,0,0,0) | 0.00% | 0.00% | 0.00% | 0.00% |
| 45 (0,0,0,0) | 0.00% | 0.00% | 0.00% | 0.00% |
| NT (0,1,0,0) | 0.00% | 0.62% | 0.00% | 0.00% |
| *Component of PCV7; ** Component of PCV13; ^ Component of PPV23; ‡ Number of isolates for 2010, 2011, 2012 and 2013, respectively | ||||
Figure 10. Invasive S. pneumoniae serotypes in 2 – 4 year olds, 2010 – 2013
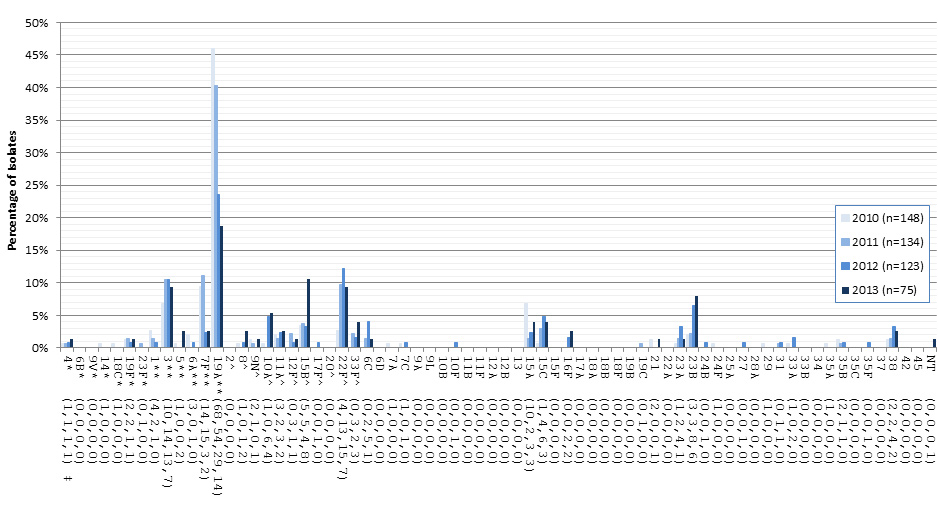
*Component of PCV7; ** Component of PCV13; ^ Component of PPV23; ‡ Number of isolates for 2010, 2011, 2012 and 2013, respectively.
Invasive S. pneumoniae serotypes in 2 – 4 year olds, 2010 – 2013 - Text Description
This figure represents the number of isolates of each serotype from 2-4 year olds collected between 2010-2013.
| Serotype | 2010 (n=148) | 2011 (n=134) | 2012 (n=123) | 2013 (n=75) |
|---|---|---|---|---|
| 4* (1,1,1,1) ‡ | 0.68% | 0.75% | 0.81% | 1.33% |
| 6B* (0,0,0,0) | 0.00% | 0.00% | 0.00% | 0.00% |
| 9V* (0,0,0,0) | 0.00% | 0.00% | 0.00% | 0.00% |
| 14* (1,0,0,0) | 0.68% | 0.00% | 0.00% | 0.00% |
| 18C* (1,0,0,0) | 0.68% | 0.00% | 0.00% | 0.00% |
| 19F* (2,2,1,1) | 1.35% | 1.49% | 0.81% | 1.33% |
| 23F* (0,1,0,0) | 0.00% | 0.75% | 0.00% | 0.00% |
| 1** (4,2,1,0) | 2.70% | 1.49% | 0.81% | 0.00% |
| 3** (10,14,13,7) | 6.76% | 10.45% | 10.57% | 9.33% |
| 5** (1,0,0,2) | 0.68% | 0.00% | 0.00% | 2.67% |
| 6A** (3,0,1,0) | 2.03% | 0.00% | 0.81% | 0.00% |
| 7F** (14,15,3,2) | 9.46% | 11.19% | 2.44% | 2.67% |
| 19A**(68,54,29,14) | 45.95% | 40.30% | 23.58% | 18.67% |
| 2^ (0,0,0,0) | 0.00% | 0.00% | 0.00% | 0.00% |
| 8^ (1,0,1,2) | 0.68% | 0.00% | 0.81% | 2.67% |
| 9N^ (2,1,0,1) | 1.35% | 0.75% | 0.00% | 1.33% |
| 10A^ (1,0,6,4) | 0.68% | 0.00% | 4.88% | 5.33% |
| 11A^ (3,2,3,2) | 2.03% | 1.49% | 2.44% | 2.67% |
| 12F^ (0,3,1,1) | 0.00% | 2.24% | 0.81% | 1.33% |
| 15B^ (5,5,4,8) | 3.38% | 3.73% | 3.25% | 10.67% |
| 17F^ (0,0,1,0) | 0.00% | 0.00% | 0.81% | 0.00% |
| 20^ (0,0,0,0) | 0.00% | 0.00% | 0.00% | 0.00% |
| 22F^ (4,13,15,7) | 2.70% | 9.70% | 12.20% | 9.33% |
| 33F^ (0,3,2,3) | 0.00% | 2.24% | 1.63% | 4.00% |
| 6C (0,2,5,1) | 0.00% | 1.49% | 4.07% | 1.33% |
| 6D (0,0,0,0) | 0.00% | 0.00% | 0.00% | 0.00% |
| 7A (1,0,0,0) | 0.68% | 0.00% | 0.00% | 0.00% |
| 7C (1,0,1,0) | 0.68% | 0.00% | 0.81% | 0.00% |
| 9A (0,0,0,0) | 0.00% | 0.00% | 0.00% | 0.00% |
| 9L (0,0,0,0) | 0.00% | 0.00% | 0.00% | 0.00% |
| 10B (0,0,0,0) | 0.00% | 0.00% | 0.00% | 0.00% |
| 10F (0,0,1,0) | 0.00% | 0.00% | 0.81% | 0.00% |
| 11B (0,0,0,0) | 0.00% | 0.00% | 0.00% | 0.00% |
| 11F (0,0,0,0) | 0.00% | 0.00% | 0.00% | 0.00% |
| 12A (0,0,0,0) | 0.00% | 0.00% | 0.00% | 0.00% |
| 12B (0,0,0,0) | 0.00% | 0.00% | 0.00% | 0.00% |
| 13 (0,0,0,0) | 0.00% | 0.00% | 0.00% | 0.00% |
| 15A (10,2,3,3) | 6.76% | 1.49% | 2.44% | 4.00% |
| 15C (1,4,6,3) | 0.68% | 2.99% | 4.88% | 4.00% |
| 15F (0,0,0,0) | 0.00% | 0.00% | 0.00% | 0.00% |
| 16F (0,0,2,2) | 0.00% | 0.00% | 1.63% | 2.67% |
| 17A (0,0,0,0) | 0.00% | 0.00% | 0.00% | 0.00% |
| 18A (0,0,0,0) | 0.00% | 0.00% | 0.00% | 0.00% |
| 18B (0,0,0,0) | 0.00% | 0.00% | 0.00% | 0.00% |
| 18F (0,0,0,0) | 0.00% | 0.00% | 0.00% | 0.00% |
| 19B (0,0,0,0) | 0.00% | 0.00% | 0.00% | 0.00% |
| 19C (0,1,0,0) | 0.00% | 0.75% | 0.00% | 0.00% |
| 21 (2,0,0,1) | 1.35% | 0.00% | 0.00% | 1.33% |
| 22A (0,0,0,0) | 0.00% | 0.00% | 0.00% | 0.00% |
| 23A (1,2,4,1) | 0.68% | 1.49% | 3.25% | 1.33% |
| 23B (3,3,8,6) | 2.03% | 2.24% | 6.50% | 8.00% |
| 24B (0,0,1,0) | 0.00% | 0.00% | 0.81% | 0.00% |
| 24F (1,0,0,0) | 0.68% | 0.00% | 0.00% | 0.00% |
| 25A (0,0,0,0) | 0.00% | 0.00% | 0.00% | 0.00% |
| 27 (0,0,1,0) | 0.00% | 0.00% | 0.81% | 0.00% |
| 28A (0,0,0,0) | 0.00% | 0.00% | 0.00% | 0.00% |
| 29 (1,0,0,0) | 0.68% | 0.00% | 0.00% | 0.00% |
| 31 (0,1,1,0) | 0.00% | 0.75% | 0.81% | 0.00% |
| 33A (1,0,2,0) | 0.68% | 0.00% | 1.63% | 0.00% |
| 33B (0,0,0,0) | 0.00% | 0.00% | 0.00% | 0.00% |
| 34 (0,0,0,0) | 0.00% | 0.00% | 0.00% | 0.00% |
| 35A (1,0,0,0) | 0.68% | 0.00% | 0.00% | 0.00% |
| 35B (2,1,1,0) | 1.35% | 0.75% | 0.81% | 0.00% |
| 35C (0,0,0,0) | 0.00% | 0.00% | 0.00% | 0.00% |
| 35F (0,0,1,0) | 0.00% | 0.00% | 0.81% | 0.00% |
| 37 (0,0,0,0) | 0.00% | 0.00% | 0.00% | 0.00% |
| 38 (2,2,4,2) | 1.35% | 1.49% | 3.25% | 2.67% |
| 42 (0,0,0,0) | 0.00% | 0.00% | 0.00% | 0.00% |
| 45 (0,0,0,0) | 0.00% | 0.00% | 0.00% | 0.00% |
| NT (0,0,0,1) | 0.00% | 0.00% | 0.00% | 1.33% |
| *Component of PCV7; ** Component of PCV13; ^ Component of PPV23; ‡ Number of isolates for 2010, 2011, 2012 and 2013, respectively | ||||
Figure 11. Invasive S. pneumoniae serotypes in 5 - 14 year olds, 2010 - 2013
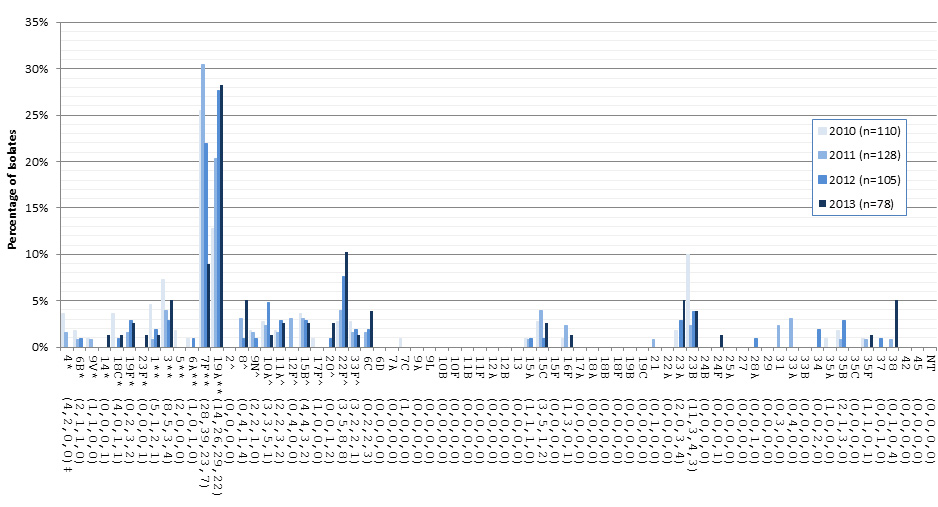
*Component of PCV7; ** Component of PCV13; ^ Component of PPV23; ‡ Number of isolates for 2010, 2011, 2012 and 2013, respectively.
Invasive S. pneumoniae serotypes in 5 - 14 year olds, 2010 - 2013 - Text Description
This figure represents the number of isolates of each serotype from 5-14 year olds collected between 2010-2013.
| Serotype | 2010 (n=110) | 2011 (n=128) | 2012 (n=105) | 2013 (n=78) |
|---|---|---|---|---|
| 4* (4,2,0,0)‡ | 3.64% | 1.56% | 0.00% | 0.00% |
| 6B* (2,1,1,0) | 1.82% | 0.78% | 0.95% | 0.00% |
| 9V* (1,1,0,0) | 0.91% | 0.78% | 0.00% | 0.00% |
| 14* (0,0,0,1) | 0.00% | 0.00% | 0.00% | 1.28% |
| 18C* (4,0,1,1) | 3.64% | 0.00% | 0.95% | 1.28% |
| 19F* (0,2,3,2) | 0.00% | 1.56% | 2.86% | 2.56% |
| 23F* (0,0,0,1) | 0.00% | 0.00% | 0.00% | 1.28% |
| 1** (5,1,2,1) | 4.55% | 0.78% | 1.90% | 1.28% |
| 3** (8,5,3,4) | 7.27% | 3.91% | 2.86% | 5.13% |
| 5** (2,0,0,0) | 1.82% | 0.00% | 0.00% | 0.00% |
| 6A** (1,0,1,0) | 0.91% | 0.00% | 0.95% | 0.00% |
| 7F** (28,39,23,7) | 25.45% | 30.47% | 21.90% | 8.97% |
| 19A**(14,26,29,22) | 12.73% | 20.31% | 27.62% | 28.21% |
| 2^ (0,0,0,0) | 0.00% | 0.00% | 0.00% | 0.00% |
| 8^ (0,4,1,4) | 0.00% | 3.13% | 0.95% | 5.13% |
| 9N^ (2,2,1,0) | 1.82% | 1.56% | 0.95% | 0.00% |
| 10A^ (3,3,5,1) | 2.73% | 2.34% | 4.76% | 1.28% |
| 11A^ (2,2,3,2) | 1.82% | 1.56% | 2.86% | 2.56% |
| 12F^ (0,4,0,0) | 0.00% | 3.13% | 0.00% | 0.00% |
| 15B^ (4,4,3,2) | 3.64% | 3.13% | 2.86% | 2.56% |
| 17F^ (1,0,0,0) | 0.91% | 0.00% | 0.00% | 0.00% |
| 20^ (0,0,1,2) | 0.00% | 0.00% | 0.95% | 2.56% |
| 22F^ (3,5,8,8) | 2.73% | 3.91% | 7.62% | 10.26% |
| 33F^ (3,2,2,1) | 2.73% | 1.56% | 1.90% | 1.28% |
| 6C (0,2,2,3) | 0.00% | 1.56% | 1.90% | 3.85% |
| 6D (0,0,0,0) | 0.00% | 0.00% | 0.00% | 0.00% |
| 7A (0,0,0,0) | 0.00% | 0.00% | 0.00% | 0.00% |
| 7C (1,0,0,0) | 0.91% | 0.00% | 0.00% | 0.00% |
| 9A (0,0,0,0) | 0.00% | 0.00% | 0.00% | 0.00% |
| 9L (0,0,0,0) | 0.00% | 0.00% | 0.00% | 0.00% |
| 10B (0,0,0,0) | 0.00% | 0.00% | 0.00% | 0.00% |
| 10F (0,0,0,0) | 0.00% | 0.00% | 0.00% | 0.00% |
| 11B (0,0,0,0) | 0.00% | 0.00% | 0.00% | 0.00% |
| 11F (0,0,0,0) | 0.00% | 0.00% | 0.00% | 0.00% |
| 12A (0,0,0,0) | 0.00% | 0.00% | 0.00% | 0.00% |
| 12B (0,0,0,0) | 0.00% | 0.00% | 0.00% | 0.00% |
| 13 (0,0,0,0) | 0.00% | 0.00% | 0.00% | 0.00% |
| 15A (1,1,1,0) | 0.91% | 0.78% | 0.95% | 0.00% |
| 15C (3,5,1,2) | 2.73% | 3.91% | 0.95% | 2.56% |
| 15F (0,0,0,0) | 0.00% | 0.00% | 0.00% | 0.00% |
| 16F (1,3,0,1) | 0.91% | 2.34% | 0.00% | 1.28% |
| 17A (0,0,0,0) | 0.00% | 0.00% | 0.00% | 0.00% |
| 18A (0,0,0,0) | 0.00% | 0.00% | 0.00% | 0.00% |
| 18B (0,0,0,0) | 0.00% | 0.00% | 0.00% | 0.00% |
| 18F (0,0,0,0) | 0.00% | 0.00% | 0.00% | 0.00% |
| 19B (0,0,0,0) | 0.00% | 0.00% | 0.00% | 0.00% |
| 19C (0,0,0,0) | 0.00% | 0.00% | 0.00% | 0.00% |
| 21 (0,1,0,0) | 0.00% | 0.78% | 0.00% | 0.00% |
| 22A (0,0,0,0) | 0.00% | 0.00% | 0.00% | 0.00% |
| 23A (2,0,3,4) | 1.82% | 0.00% | 2.86% | 5.13% |
| 23B (11,3,4,3) | 10.00% | 2.34% | 3.81% | 3.85% |
| 24B (0,0,0,0) | 0.00% | 0.00% | 0.00% | 0.00% |
| 24F (0,0,0,1) | 0.00% | 0.00% | 0.00% | 1.28% |
| 25A (0,0,0,0) | 0.00% | 0.00% | 0.00% | 0.00% |
| 27 (0,0,0,0) | 0.00% | 0.00% | 0.00% | 0.00% |
| 28A (0,0,1,0) | 0.00% | 0.00% | 0.95% | 0.00% |
| 29 (0,0,0,0) | 0.00% | 0.00% | 0.00% | 0.00% |
| 31 (0,3,0,0) | 0.00% | 2.34% | 0.00% | 0.00% |
| 33A (0,4,0,0) | 0.00% | 3.13% | 0.00% | 0.00% |
| 33B (0,0,0,0) | 0.00% | 0.00% | 0.00% | 0.00% |
| 34 (0,0,2,0) | 0.00% | 0.00% | 1.90% | 0.00% |
| 35A (1,0,0,0) | 0.91% | 0.00% | 0.00% | 0.00% |
| 35B (2,1,3,0) | 1.82% | 0.78% | 2.86% | 0.00% |
| 35C (0,0,0,0) | 0.00% | 0.00% | 0.00% | 0.00% |
| 35F (1,1,0,1) | 0.91% | 0.78% | 0.00% | 1.28% |
| 37 (0,0,1,0) | 0.00% | 0.00% | 0.95% | 0.00% |
| 38 (0,1,0,4) | 0.00% | 0.78% | 0.00% | 5.13% |
| 42 (0,0,0,0) | 0.00% | 0.00% | 0.00% | 0.00% |
| 45 (0,0,0,0) | 0.00% | 0.00% | 0.00% | 0.00% |
| NT (0,0,0,0) | 0.00% | 0.00% | 0.00% | 0.00% |
| *Component of PCV7; ** Component of PCV13; ^ Component of PPV23; ‡ Number of isolates for 2010, 2011, 2012 and 2013, respectively | ||||
Figure 12. Invasive S. pneumoniae serotypes in 15 – 49 year olds, 2010 - 2013
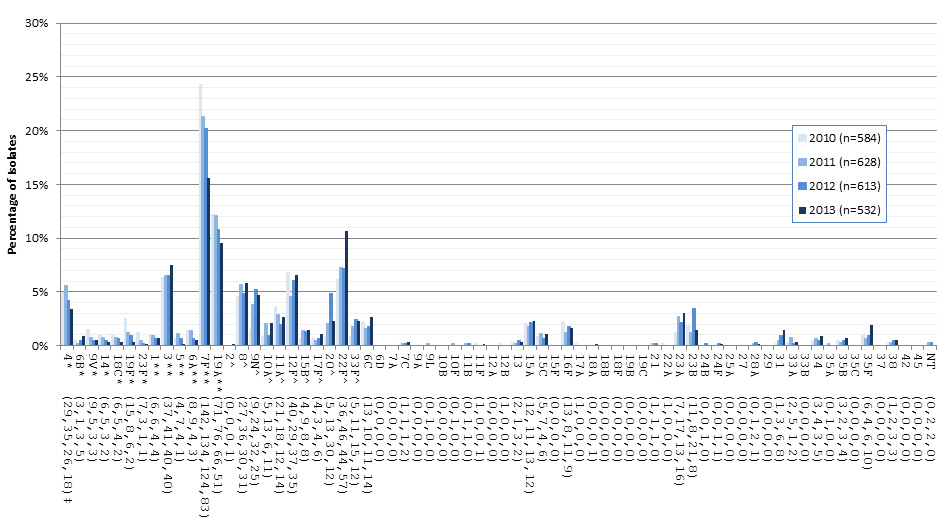
*Component of PCV7; ** Component of PCV13; ^ Component of PPV23; ‡ Number of isolates for 2010, 2011, 2012 and 2013, respectively.
Invasive S. pneumoniae serotypes in 15 – 49 year olds, 2010 - 2013 - Text Description
This figure represents the number of isolates of each serotype from 15-49 year olds collected between 2010-2013.
| Serotype | 2010 (n=584) | 2011 (n=628) | 2012 (n=613) | 2013 (n=532) |
|---|---|---|---|---|
| 4* (29,35,26,18) | 4.97% | 5.57% | 4.24% | 3.38% |
| 6B* (3,1,3,5) | 0.51% | 0.16% | 0.49% | 0.94% |
| 9V* (9,5,3,3) | 1.54% | 0.80% | 0.49% | 0.56% |
| 14* (6,5,3,2) | 1.03% | 0.80% | 0.49% | 0.38% |
| 18C* (6,5,4,2) | 1.03% | 0.80% | 0.65% | 0.38% |
| 19F* (15,8,6,2) | 2.57% | 1.27% | 0.98% | 0.38% |
| 23F* (7,3,1,1) | 1.20% | 0.48% | 0.16% | 0.19% |
| 1** (6,6,4,4) | 1.03% | 0.96% | 0.65% | 0.75% |
| 3** (37,41,40,40) | 6.34% | 6.53% | 6.53% | 7.52% |
| 5** (4,7,4,1) | 0.68% | 1.11% | 0.65% | 0.19% |
| 6A** (8,9,4,3) | 1.37% | 1.43% | 0.65% | 0.56% |
| 7F** (142,134,124,83) | 24.32% | 21.34% | 20.23% | 15.60% |
| 19A**(71,76,66,51) | 12.16% | 12.10% | 10.77% | 9.59% |
| 2^ (0,0,0,1) | 0.00% | 0.00% | 0.00% | 0.19% |
| 8^ (27,36,30,31) | 4.62% | 5.73% | 4.89% | 5.83% |
| 9N^ (9,24,32,25) | 1.54% | 3.82% | 5.22% | 4.70% |
| 10A^ (5,13,6,11) | 0.86% | 2.07% | 0.98% | 2.07% |
| 11A^ (21,18,12,14) | 3.60% | 2.87% | 1.96% | 2.63% |
| 12F^ (40,29,37,35) | 6.85% | 4.62% | 6.04% | 6.58% |
| 15B^ (4,9,8,8) | 0.68% | 1.43% | 1.31% | 1.50% |
| 17F^ (4,3,4,6) | 0.68% | 0.48% | 0.65% | 1.13% |
| 20^ (5,13,30,12) | 0.86% | 2.07% | 4.89% | 2.26% |
| 22F^ (36,46,44,57) | 6.16% | 7.32% | 7.18% | 10.71% |
| 33F^ (5,11,15,12) | 0.86% | 1.75% | 2.45% | 2.26% |
| 6C (13,10,11,14) | 2.23% | 1.59% | 1.79% | 2.63% |
| 6D (0,0,0,0) | 0.00% | 0.00% | 0.00% | 0.00% |
| 7A (0,0,0,0) | 0.00% | 0.00% | 0.00% | 0.00% |
| 7C (1,1,1,2) | 0.17% | 0.16% | 0.16% | 0.38% |
| 9A (0,0,0,0) | 0.00% | 0.00% | 0.00% | 0.00% |
| 9L (0,1,0,0) | 0.00% | 0.16% | 0.00% | 0.00% |
| 10B (0,0,0,0) | 0.00% | 0.00% | 0.00% | 0.00% |
| 10F (0,1,0,0) | 0.00% | 0.16% | 0.00% | 0.00% |
| 11B (0,1,1,0) | 0.00% | 0.16% | 0.16% | 0.00% |
| 11F (1,0,0,1) | 0.17% | 0.00% | 0.00% | 0.19% |
| 12A (0,0,0,0) | 0.00% | 0.00% | 0.00% | 0.00% |
| 12B (1,0,0,0) | 0.17% | 0.00% | 0.00% | 0.00% |
| 13 (2,1,3,2) | 0.34% | 0.16% | 0.49% | 0.38% |
| 15A (12,11,13,12) | 2.05% | 1.75% | 2.12% | 2.26% |
| 15C (5,7,4,6) | 0.86% | 1.11% | 0.65% | 1.13% |
| 15F (0,0,0,0) | 0.00% | 0.00% | 0.00% | 0.00% |
| 16F (13,8,11,9) | 2.23% | 1.27% | 1.79% | 1.69% |
| 17A (1,0,0,0) | 0.17% | 0.00% | 0.00% | 0.00% |
| 18A (0,0,0,1) | 0.00% | 0.00% | 0.00% | 0.19% |
| 18B (0,0,0,0) | 0.00% | 0.00% | 0.00% | 0.00% |
| 18F (0,0,0,0) | 0.00% | 0.00% | 0.00% | 0.00% |
| 19B (0,0,0,0) | 0.00% | 0.00% | 0.00% | 0.00% |
| 19C (0,0,0,0) | 0.00% | 0.00% | 0.00% | 0.00% |
| 21 (1,1,1,0) | 0.17% | 0.16% | 0.16% | 0.00% |
| 22A (1,0,0,0) | 0.17% | 0.00% | 0.00% | 0.00% |
| 23A (7,17,13,16) | 1.20% | 2.71% | 2.12% | 3.01% |
| 23B (11,8,21,8) | 1.88% | 1.27% | 3.43% | 1.50% |
| 24B (0,0,1,0) | 0.00% | 0.00% | 0.16% | 0.00% |
| 24F (0,0,1,1) | 0.00% | 0.00% | 0.16% | 0.19% |
| 25A (0,0,0,0) | 0.00% | 0.00% | 0.00% | 0.00% |
| 27 (0,0,0,0) | 0.00% | 0.00% | 0.00% | 0.00% |
| 28A (0,1,2,1) | 0.00% | 0.16% | 0.33% | 0.19% |
| 29 (0,0,0,0) | 0.00% | 0.00% | 0.00% | 0.00% |
| 31 (1,3,6,8) | 0.17% | 0.48% | 0.98% | 1.50% |
| 33A (2,5,1,2) | 0.34% | 0.80% | 0.16% | 0.38% |
| 33B (0,0,0,0) | 0.00% | 0.00% | 0.00% | 0.00% |
| 34 (3,4,3,5) | 0.51% | 0.64% | 0.49% | 0.94% |
| 35A (0,1,0,0) | 0.00% | 0.16% | 0.00% | 0.00% |
| 35B (3,2,3,4) | 0.51% | 0.32% | 0.49% | 0.75% |
| 35C (0,0,0,0) | 0.00% | 0.00% | 0.00% | 0.00% |
| 35F (6,4,6,10) | 1.03% | 0.64% | 0.98% | 1.88% |
| 37 (0,0,0,0) | 0.00% | 0.00% | 0.00% | 0.00% |
| 38 (1,2,3,3) | 0.17% | 0.32% | 0.49% | 0.56% |
| 42 (0,0,0,0) | 0.00% | 0.00% | 0.00% | 0.00% |
| 45 (0,0,0,0) | 0.00% | 0.00% | 0.00% | 0.00% |
| NT (0,2,2,0) | 0.00% | 0.32% | 0.33% | 0.00% |
| *Component of PCV7; ** Component of PCV13; ^ Component of PPV23; ‡ Number of isolates for 2010, 2011, 2012 and 2013, respectively | ||||
Figure 13. Invasive S. pneumoniae serotypes in 50 – 64 year olds, 2010 - 2013
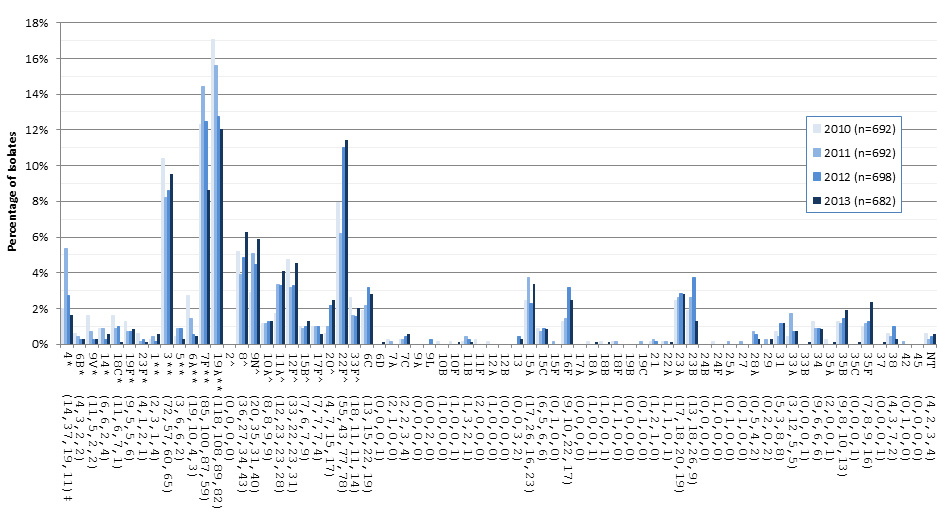
* Component of PCV7; ** Component of PCV13; ^ Component of PPV23; ‡ Number of isolates for 2010, 2011, 2012 and 2013, respectively
Invasive S. pneumoniae serotypes in 50 – 64 year olds, 2010 - 2013 - Text Description
This figure represents the number of isolates of each serotype from 50-64 year olds collected between 2010-2013.
| Serotype | 2010 (n=692) | 2011 (n=692) | 2012 (n=698) | 2013 (n=682) |
|---|---|---|---|---|
| 4* (14,37,19,11) | 2.02% | 5.35% | 2.72% | 1.61% |
| 6B* (4,3,2,2) | 0.58% | 0.43% | 0.29% | 0.29% |
| 9V* (11,5,2,2) | 1.59% | 0.72% | 0.29% | 0.29% |
| 14* (6,6,2,4) | 0.87% | 0.87% | 0.29% | 0.59% |
| 18C* (11,6,7,1) | 1.59% | 0.87% | 1.00% | 0.15% |
| 19F* (9,5,5,6) | 1.30% | 0.72% | 0.72% | 0.88% |
| 23F* (4,1,2,1) | 0.58% | 0.14% | 0.29% | 0.15% |
| 1** (2,3,1,4) | 0.29% | 0.43% | 0.14% | 0.59% |
| 3** (72,57,60,65) | 10.40% | 8.24% | 8.60% | 9.53% |
| 5** (3,6,6,2) | 0.43% | 0.87% | 0.86% | 0.29% |
| 6A** (19,10,4,3) | 2.75% | 1.45% | 0.57% | 0.44% |
| 7F** (85,100,87,59) | 12.28% | 14.45% | 12.46% | 8.65% |
| 19A**(118,108,89,82) | 17.05% | 15.61% | 12.75% | 12.02% |
| 2^ (0,0,0,0) | 0.00% | 0.00% | 0.00% | 0.00% |
| 8^ (36,27,34,43) | 5.20% | 3.90% | 4.87% | 6.30% |
| 9N^ (20,35,31,40) | 2.89% | 5.06% | 4.44% | 5.87% |
| 10A^ (8,8,9,9) | 1.16% | 1.16% | 1.29% | 1.32% |
| 11A^ (12,23,23,28) | 1.73% | 3.32% | 3.30% | 4.11% |
| 12F^ (33,22,23,31) | 4.77% | 3.18% | 3.30% | 4.55% |
| 15B^ (7,6,7,9) | 1.01% | 0.87% | 1.00% | 1.32% |
| 17F^ (7,7,7,4) | 1.01% | 1.01% | 1.00% | 0.59% |
| 20^ (4,7,15,17) | 0.58% | 1.01% | 2.15% | 2.49% |
| 22F^ (55,43,77,78) | 7.95% | 6.21% | 11.03% | 11.44% |
| 33F^ (18,11,11,14) | 2.60% | 1.59% | 1.58% | 2.05% |
| 6C (13,15,22,19) | 1.88% | 2.17% | 3.15% | 2.79% |
| 6D (0,0,0,1) | 0.00% | 0.00% | 0.00% | 0.15% |
| 7A (2,1,0,0) | 0.29% | 0.14% | 0.00% | 0.00% |
| 7C (2,2,3,4) | 0.29% | 0.29% | 0.43% | 0.59% |
| 9A (0,0,0,0) | 0.00% | 0.00% | 0.00% | 0.00% |
| 9L (0,0,2,0) | 0.00% | 0.00% | 0.29% | 0.00% |
| 10B (1,0,0,0) | 0.14% | 0.00% | 0.00% | 0.00% |
| 10F (1,0,0,1) | 0.14% | 0.00% | 0.00% | 0.15% |
| 11B (1,3,2,1) | 0.14% | 0.43% | 0.29% | 0.15% |
| 11F (2,0,0,0) | 0.29% | 0.00% | 0.00% | 0.00% |
| 12A (1,0,0,0) | 0.14% | 0.00% | 0.00% | 0.00% |
| 12B (0,0,0,0) | 0.00% | 0.00% | 0.00% | 0.00% |
| 13 (0,0,3,2) | 0.00% | 0.00% | 0.43% | 0.29% |
| 15A (17,26,16,23) | 2.46% | 3.76% | 2.29% | 3.37% |
| 15C (6,5,6,6) | 0.87% | 0.72% | 0.86% | 0.88% |
| 15F (0,1,0,0) | 0.00% | 0.14% | 0.00% | 0.00% |
| 16F (9,10,22,17) | 1.30% | 1.45% | 3.15% | 2.49% |
| 17A (0,0,0,0) | 0.00% | 0.00% | 0.00% | 0.00% |
| 18A (1,0,0,1) | 0.14% | 0.00% | 0.00% | 0.15% |
| 18B (1,0,0,1) | 0.14% | 0.00% | 0.00% | 0.15% |
| 18F (1,1,0,0) | 0.14% | 0.14% | 0.00% | 0.00% |
| 19B (0,0,0,0) | 0.00% | 0.00% | 0.00% | 0.00% |
| 19C (0,1,0,0) | 0.00% | 0.14% | 0.00% | 0.00% |
| 21 (1,2,1,0) | 0.14% | 0.29% | 0.14% | 0.00% |
| 22A (1,1,0,1) | 0.14% | 0.14% | 0.00% | 0.15% |
| 23A (17,18,20,19) | 2.46% | 2.60% | 2.87% | 2.79% |
| 23B (13,18,26,9) | 1.88% | 2.60% | 3.72% | 1.32% |
| 24B (0,0,0,0) | 0.00% | 0.00% | 0.00% | 0.00% |
| 24F (1,0,0,0) | 0.14% | 0.00% | 0.00% | 0.00% |
| 25A (0,1,0,0) | 0.00% | 0.14% | 0.00% | 0.00% |
| 27 (0,1,0,0) | 0.00% | 0.14% | 0.00% | 0.00% |
| 28A (0,5,4,2) | 0.00% | 0.72% | 0.57% | 0.29% |
| 29 (0,2,0,2) | 0.00% | 0.29% | 0.00% | 0.29% |
| 31 (5,3,8,8) | 0.72% | 0.43% | 1.15% | 1.17% |
| 33A (3,12,5,5) | 0.43% | 1.73% | 0.72% | 0.73% |
| 33B (0,0,0,1) | 0.00% | 0.00% | 0.00% | 0.15% |
| 34 (9,6,6,6) | 1.30% | 0.87% | 0.86% | 0.88% |
| 35A (2,0,0,1) | 0.29% | 0.00% | 0.00% | 0.15% |
| 35B (9,8,10,13) | 1.30% | 1.16% | 1.43% | 1.91% |
| 35C (0,0,0,1) | 0.00% | 0.00% | 0.00% | 0.15% |
| 35F (7,8,9,16) | 1.01% | 1.16% | 1.29% | 2.35% |
| 37 (0,0,0,1) | 0.00% | 0.00% | 0.00% | 0.15% |
| 38 (4,3,7,2) | 0.58% | 0.43% | 1.00% | 0.29% |
| 42 (0,1,0,0) | 0.00% | 0.14% | 0.00% | 0.00% |
| 45 (0,0,0,0) | 0.00% | 0.00% | 0.00% | 0.00% |
| NT (4,2,3,4) | 0.58% | 0.29% | 0.43% | 0.59% |
| *Component of PCV7; ** Component of PCV13; ^ Component of PPV23; ‡ Number of isolates for 2010, 2011, 2012 and 2013, respectively | ||||
Figure 14. Invasive S. pneumoniae serotypes in ≥ 65 year olds, 2010 - 2013

* Component of PCV7; ** Component of PCV13; ^ Component of PPV23; ‡ Number of isolates for 2010, 2011, 2012 and 2013, respectively
Invasive S. pneumoniae serotypes in ≥ 65 year olds, 2010 - 2013 - Text Description
This figure represents the number of isolates of each serotype from ≥ 65 year olds collected between 2010-2013.
| Serotype | 2010 (n=971) | 2011 (n=915) | 2012 (n=940) | 2013 (n=1047) |
|---|---|---|---|---|
| 4* (19,11,17,12) | 1.96% | 1.20% | 1.81% | 1.15% |
| 6B* (13,8,9,8) | 1.34% | 0.87% | 0.96% | 0.76% |
| 9V* (11,8,6,3) | 1.13% | 0.87% | 0.64% | 0.29% |
| 14* (14,8,7,8) | 1.44% | 0.87% | 0.74% | 0.76% |
| 18C* (11,2,6,4) | 1.13% | 0.22% | 0.64% | 0.38% |
| 19F* (15,17,11,13) | 1.54% | 1.86% | 1.17% | 1.24% |
| 23F* (11,6,8,7) | 1.13% | 0.66% | 0.85% | 0.67% |
| 1** (3,1,2,0) | 0.31% | 0.11% | 0.21% | 0.00% |
| 3** (85,99,94,101) | 8.75% | 10.82% | 10.00% | 9.65% |
| 5** (1,0,2,0) | 0.10% | 0.00% | 0.21% | 0.00% |
| 6A** (37,14,17,9) | 3.81% | 1.53% | 1.81% | 0.86% |
| 7F** (96,97,72,72) | 9.89% | 10.60% | 7.66% | 6.88% |
| 19A**(172,126,121,114) | 17.71% | 13.77% | 12.87% | 10.89% |
| 2^ (0,0,0,0) | 0.00% | 0.00% | 0.00% | 0.00% |
| 8^ (23,18,24,37) | 2.37% | 1.97% | 2.55% | 3.53% |
| 9N^ (31,24,19,45) | 3.19% | 2.62% | 2.02% | 4.30% |
| 10A^ (14,7,13,14) | 1.44% | 0.77% | 1.38% | 1.34% |
| 11A^ (29,25,33,39) | 2.99% | 2.73% | 3.51% | 3.72% |
| 12F^ (13,18,16,20) | 1.34% | 1.97% | 1.70% | 1.91% |
| 15B^ (16,10,12,19) | 1.65% | 1.09% | 1.28% | 1.81% |
| 17F^ (12,9,12,6) | 1.24% | 0.98% | 1.28% | 0.57% |
| 20^ (8,7,10,17) | 0.82% | 0.77% | 1.06% | 1.62% |
| 22F^ (75,90,122,135) | 7.72% | 9.84% | 12.98% | 12.89% |
| 33F^ (19,11,25,30) | 1.96% | 1.20% | 2.66% | 2.87% |
| 6C (53,60,49,53) | 5.46% | 6.56% | 5.21% | 5.06% |
| 6D (0,1,0,2) | 0.00% | 0.11% | 0.00% | 0.19% |
| 7A (0,0,0,0) | 0.00% | 0.00% | 0.00% | 0.00% |
| 7C (3,3,2,4) | 0.31% | 0.33% | 0.21% | 0.38% |
| 9A (3,0,0,1) | 0.31% | 0.00% | 0.00% | 0.10% |
| 9L (1,1,0,0) | 0.10% | 0.11% | 0.00% | 0.00% |
| 10B (0,0,0,1) | 0.00% | 0.00% | 0.00% | 0.10% |
| 10F (0,0,0,0) | 0.00% | 0.00% | 0.00% | 0.00% |
| 11B (1,2,3,0) | 0.10% | 0.22% | 0.32% | 0.00% |
| 11F (0,0,1,0) | 0.00% | 0.00% | 0.11% | 0.00% |
| 12A (0,0,0,1) | 0.00% | 0.00% | 0.00% | 0.10% |
| 12B (0,0,0,0) | 0.00% | 0.00% | 0.00% | 0.00% |
| 13 (1,1,1,0) | 0.10% | 0.11% | 0.11% | 0.00% |
| 15A (39,38,55,58) | 4.02% | 4.15% | 5.85% | 5.54% |
| 15C (7,10,12,9) | 0.72% | 1.09% | 1.28% | 0.86% |
| 15F (0,0,0,0) | 0.00% | 0.00% | 0.00% | 0.00% |
| 16F (18,16,27,28) | 1.85% | 1.75% | 2.87% | 2.67% |
| 17A (0,0,0,0) | 0.00% | 0.00% | 0.00% | 0.00% |
| 18A (0,0,0,0) | 0.00% | 0.00% | 0.00% | 0.00% |
| 18B (0,0,0,0) | 0.00% | 0.00% | 0.00% | 0.00% |
| 18F (0,1,0,0) | 0.00% | 0.11% | 0.00% | 0.00% |
| 19B (0,0,0,0) | 0.00% | 0.00% | 0.00% | 0.00% |
| 19C (0,0,0,0) | 0.00% | 0.00% | 0.00% | 0.00% |
| 21 (0,1,1,4) | 0.00% | 0.11% | 0.11% | 0.38% |
| 22A (1,0,0,0) | 0.10% | 0.00% | 0.00% | 0.00% |
| 23A (36,46,50,46) | 3.71% | 5.03% | 5.32% | 4.39% |
| 23B (15,20,21,18) | 1.54% | 2.19% | 2.23% | 1.72% |
| 24B (0,1,1,1) | 0.00% | 0.11% | 0.11% | 0.10% |
| 24F (1,1,2,3) | 0.10% | 0.11% | 0.21% | 0.29% |
| 25A (0,0,0,0) | 0.00% | 0.00% | 0.00% | 0.00% |
| 27 (0,0,0,0) | 0.00% | 0.00% | 0.00% | 0.00% |
| 28A (0,0,1,1) | 0.00% | 0.00% | 0.11% | 0.10% |
| 29 (1,1,0,1) | 0.10% | 0.11% | 0.00% | 0.10% |
| 31 (5,11,9,16) | 0.51% | 1.20% | 0.96% | 1.53% |
| 33A (6,13,0,2) | 0.62% | 1.42% | 0.00% | 0.19% |
| 33B (0,1,0,0) | 0.00% | 0.11% | 0.00% | 0.00% |
| 34 (8,14,8,7) | 0.82% | 1.53% | 0.85% | 0.67% |
| 35A (1,2,0,1) | 0.10% | 0.22% | 0.00% | 0.10% |
| 35B (8,24,14,39) | 0.82% | 2.62% | 1.49% | 3.72% |
| 35C (0,0,0,0) | 0.00% | 0.00% | 0.00% | 0.00% |
| 35F (18,13,17,14) | 1.85% | 1.42% | 1.81% | 1.34% |
| 37 (2,1,0,3) | 0.21% | 0.11% | 0.00% | 0.29% |
| 38 (8,16,7,20) | 0.82% | 1.75% | 0.74% | 1.91% |
| 42 (0,0,0,0) | 0.00% | 0.00% | 0.00% | 0.00% |
| 45 (0,1,0,0) | 0.00% | 0.11% | 0.00% | 0.00% |
| NT (7,0,1,1) | 0.72% | 0.00% | 0.11% | 0.10% |
| *Component of PCV7; ** Component of PCV13; ^ Component of PPV23; ‡ Number of isolates for 2010, 2011, 2012 and 2013, respectively | ||||
Figure 15. Serotype 19A by age
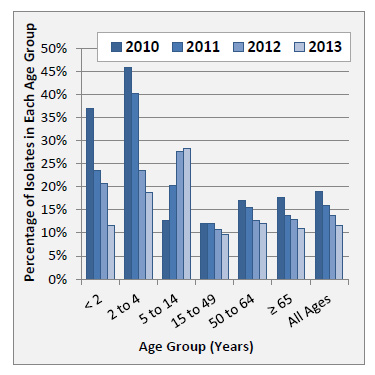
Serotype 19A by age - Text Description
This figure represents the percentage of isolates within serotype 19A for each age group between 2010-2013.
| Year | Percentage of 19A in each age group | ||||||
|---|---|---|---|---|---|---|---|
| < 2 | 2 to 4 | 5 to 14 | 15 to 49 | 50 to 64 | ≥ 65 | All Ages | |
| 2010 | 37.0% | 45.9% | 12.7% | 12.2% | 17.1% | 17.7% | 19.0% |
| 2011 | 23.6% | 40.3% | 20.3% | 12.1% | 15.6% | 13.8% | 16.0% |
| 2012 | 20.7% | 23.6% | 27.6% | 10.8% | 12.8% | 12.9% | 13.7% |
| 2013 | 11.6% | 18.7% | 28.2% | 9.6% | 12.0% | 10.9% | 11.6% |
Figure 16. Serotype 7F by age
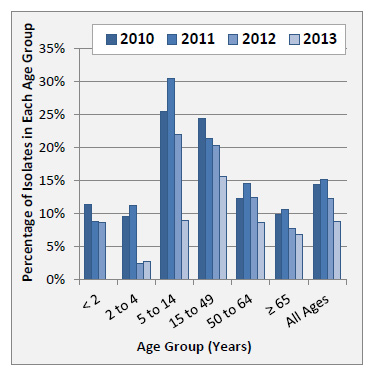
Serotype 7F by age - Text Description
This figure represents the percentage of isolates within serotype 7F for each age group between 2010-2013.
| Year | Percentage of 7F in each age group | ||||||
|---|---|---|---|---|---|---|---|
| < 2 | 2 to 4 | 5 to 14 | 15 to 49 | 50 to 64 | ≥ 65 | All Ages | |
| 2010 | 11.4% | 9.5% | 25.5% | 24.3% | 12.3% | 9.9% | 14.3% |
| 2011 | 8.7% | 11.2% | 30.5% | 21.3% | 14.5% | 10.6% | 15.1% |
| 2012 | 8.6% | 2.4% | 21.9% | 20.2% | 12.5% | 7.7% | 12.3% |
| 2013 | 0.0% | 2.7% | 9.0% | 15.6% | 8.7% | 6.9% | 8.8% |
Figure 17. Serotype 3 by age
Serotype 3 by age - Text Description
This figure represents the percentage of isolates within serotype 3 for each age group between 2010-2013.
| Year | Percentage of 3 in each age group | ||||||
|---|---|---|---|---|---|---|---|
| < 2 | 2 to 4 | 5 to 14 | 15 to 49 | 50 to 64 | ≥ 65 | All Ages | |
| 2010 | 6.5% | 6.8% | 7.3% | 6.3% | 10.4% | 8.8% | 8.3% |
| 2011 | 6.8% | 10.4% | 3.9% | 6.5% | 8.2% | 10.8% | 8.5% |
| 2012 | 9.5% | 10.6% | 2.9% | 6.5% | 8.6% | 10.0% | 8.4% |
| 2013 | 5.4% | 9.3% | 5.1% | 7.5% | 9.5% | 9.6% | 8.9% |
Figure 18. Serotype 22F by age
Serotype 22F by age - Text Description
This figure represents the percentage of isolates within serotype 22F for each age group between 2010-2013.
| Year | Percentage of 22F in each age group | ||||||
|---|---|---|---|---|---|---|---|
| < 2 | 2 to 4 | 5 to 14 | 15 to 49 | 50 to 64 | ≥ 65 | All Ages | |
| 2010 | 2.7% | 2.7% | 2.7% | 6.2% | 7.9% | 7.7% | 6.7% |
| 2011 | 5.0% | 9.7% | 3.9% | 7.3% | 6.2% | 9.8% | 7.8% |
| 2012 | 7.8% | 12.2% | 7.6% | 7.2% | 11.0% | 13.0% | 10.6% |
| 2013 | 17.1% | 9.3% | 10.3% | 10.7% | 11.4% | 12.9% | 12.1% |
Regional Distribution of S. pneumoniae Serotypes
Serotype 19A was the most prevalent serotype in Western and Central regions in 2013 representing 8.2% (n=77) and 13.6% (n=197), whereas in Eastern regions 7F was most predominant with 15.4% (n=28). Serotype 7F was also prominent in Central Canada with 8.4% (n=122), but only represented 8.1% (n=76) of the Western isolates. Serotype 22F was evenly distributed among the regions with 11.5% (n=108), 12.8% (n=186), and 9.3% (n=17) of the Western, Central and Eastern regional totals, respectively. Serotype 3 was also relatively evenly distributed through the regions representing 8.7% (n=82) of Western, 9.0% (n=131) of Central, and 8.8% (n=16) of Eastern (Figure 19) Canadian isolates.
Among isolates from children <2 years of age (Figure 20), serotype 19A represented a higher proportion of Central region isolates (15.2%, n=12) than of Western isolates (4.4%, n=2). In Western Canada, serotype 33F represented a relatively high proportion of isolates in this age group (13.3%, n=6).
Among isolates from the 2 – 4 year old age group (Figure 21) serotype 19A is prominent in Central regions representing 22.0% (n=9) of the isolates. In the West serotypes 23B (13.8%, n=4), 33F (10.3%, n=3) and 15A (6.9%, n=2) are more prevalent than in other regions.
Serotypes of isolates from the 5 – 14 (Figure 22) and 15 – 49 (Figure 23) year old age groups were relatively evenly distributed regionally with slightly higher proportions of serotypes 3, 19A and 22F in Central Canada and in Western regions serotypes 8, 9N, 12F and 20 were slightly elevated.
In the 50 – 64 year old age group (Figure 24), serotype 19A and 7F were present in lower proportions in Western Canada (7.4%, n=18 and 6.2%, n=15; respectively) than in Central (14.9%, n=59 and 9.3%, n=37; respectively) and Eastern (11.4%, n=5 and 15.9%, n=7; respectively) regions. Serotype 3 was present at similar levels in Western (10.7%, n=26) and Central Canada (9.3%, n=37), and lower levels were seen in the East (4.6%, n=2). Similarly, 22F was evenly distributed in Western (12.0%, n=29) and Central regions (11.9%, n=47), and in lower proportions in Eastern Canada (4.6%, n=2). Other serotypes with greater relative prevalence include serotypes 12F, 20 and 23B in Western (7.4%, n=18; 6.2% n=15; and 2.5%, n=6; respectively); 15A and 23A in Central (4.8%, n=19; 3.5%, n=14; respectively); and 8, 33F, and 6C in Eastern regions (13.6%, n=6; 6.8%, n=3; and 6.8%, n=3; respectively).
The regional distribution of serotypes in the senior age group of ≥ 65 years of age (Figure 25) reflects that of the 50 – 64 year olds. Serotypes 19A and 7F are lower in the West (8.4%, n=27; 5.9%, n=19; respectively) than in the East (14.8%, n=13; 11.6%, n=74; respectively) and Central Canada (11.6%, n=74; 7.1%, n=45; respectively). Serotypes 3 and 22F were evenly distributed across Canada in this age group at about 10% and 13%, respectively. Similar to the regional distribution of serotypes in the 50 – 64 year old age group, the West had elevated proportions of serotypes 12F, 20 and 23B (4.7%, n=15; 4.0%, n=13; and 3.1%, n=10; respectively); and in Central Canada proportions of 15A and 23A (6.9%, n=44; 5.2%, n=33; respectively) were elevated with respect to other regions.
Figure 19. Regional distribution of invasive S. pneumoniae serotypes in all combined age groups, 2013

*Component of PCV7; ** Component of PCV13; ^ Component of PPV23; ‡ Number of isolates for Western, Central and Eastern regions, respectively.
Regional distribution of invasive S. pneumoniae serotypes in all combined age groups, 2013 - Text Description
This figure represents the number of isolates of all serotypes distributed regionally, collected in 2013.
| Serotype | Western (n=941) | Central (n=1454) | Eastern (n=182) |
|---|---|---|---|
| 4* (22,20,0)‡ | 2.30% | 1.40% | 0.00% |
| 6B* (5,10,0) | 0.50% | 0.70% | 0.00% |
| 9V* (2,7,0) | 0.20% | 0.50% | 0.00% |
| 14* (9,5,1) | 1.00% | 0.30% | 0.50% |
| 18C* (1,9,0) | 0.10% | 0.60% | 0.00% |
| 19F* (10,13,4) | 1.10% | 0.90% | 2.20% |
| 23F* (3,6,1) | 0.30% | 0.40% | 0.50% |
| 1** (3,5,1) | 0.30% | 0.30% | 0.50% |
| 3** (82,131,16) | 8.70% | 9.00% | 8.80% |
| 5** (4,1,0) | 0.40% | 0.10% | 0.00% |
| 6A** (3,10,2) | 0.30% | 0.70% | 1.10% |
| 7F** (76,122,28) | 8.10% | 8.40% | 15.40% |
| 19A**(77,197,25) | 8.20% | 13.50% | 13.70% |
| 2^ (1,0,0) | 0.10% | 0.00% | 0.00% |
| 8^ (52,59,8) | 5.50% | 4.10% | 4.40% |
| 9N^ (39,66,8) | 4.10% | 4.50% | 4.40% |
| 10A^ (20,24,3) | 2.10% | 1.70% | 1.60% |
| 11A^ (41,47,5) | 4.40% | 3.20% | 2.70% |
| 12F^ (55,31,4) | 5.80% | 2.10% | 2.20% |
| 15B^ (13,41,2) | 1.40% | 2.80% | 1.10% |
| 17F^ (9,7,2) | 1.00% | 0.50% | 1.10% |
| 20^ (42,8,0) | 4.50% | 0.60% | 0.00% |
| 22F^ (108,186,17) | 11.50% | 12.80% | 9.30% |
| 33F^ (30,35,7) | 3.20% | 2.40% | 3.80% |
| 6C (29,55,8) | 3.10% | 3.80% | 4.40% |
| 6D (1,1,1) | 0.10% | 0.10% | 0.50% |
| 7C (3,9,0) | 0.30% | 0.60% | 0.00% |
| 9A (0,1,0) | 0.00% | 0.10% | 0.00% |
| 10B (1,0,0) | 0.10% | 0.00% | 0.00% |
| 10F (0,1,0) | 0.00% | 0.10% | 0.00% |
| 11B (1,0,0) | 0.10% | 0.00% | 0.00% |
| 11F (1,0,0) | 0.10% | 0.00% | 0.00% |
| 12A (1,0,0) | 0.10% | 0.00% | 0.00% |
| 13 (4,1,0) | 0.40% | 0.10% | 0.00% |
| 15A (23,72,4) | 2.40% | 5.00% | 2.20% |
| 15C (14,16,1) | 1.50% | 1.10% | 0.50% |
| 16F (22,35,4) | 2.30% | 2.40% | 2.20% |
| 18A (0,2,0) | 0.00% | 0.10% | 0.00% |
| 18B (1,0,0) | 0.10% | 0.00% | 0.00% |
| 21 (4,9,0) | 0.40% | 0.60% | 0.00% |
| 22A (1,0,0) | 0.10% | 0.00% | 0.00% |
| 23A (24,61,4) | 2.60% | 4.20% | 2.20% |
| 23B (30,17,3) | 3.20% | 1.20% | 1.60% |
| 24B (0,1,0) | 0.00% | 0.10% | 0.00% |
| 24F (1,3,2) | 0.10% | 0.20% | 1.10% |
| 28A (0,4,0) | 0.00% | 0.30% | 0.00% |
| 29 (1,2,1) | 0.10% | 0.10% | 0.50% |
| 31 (8,19,5) | 0.90% | 1.30% | 2.70% |
| 33A (3,7,0) | 0.30% | 0.50% | 0.00% |
| 33B (1,0,0) | 0.10% | 0.00% | 0.00% |
| 34 (8,10,1) | 0.90% | 0.70% | 0.50% |
| 35A (0,2,1) | 0.00% | 0.10% | 0.50% |
| 35B (25,29,5) | 2.70% | 2.00% | 2.70% |
| 35C (1,0,0) | 0.10% | 0.00% | 0.00% |
| 35F (16,25,3) | 1.70% | 1.70% | 1.60% |
| 37 (1,1,2) | 0.10% | 0.10% | 1.10% |
| 38 (7,28,2) | 0.70% | 1.90% | 1.10% |
| NT (2,3,1) | 0.20% | 0.20% | 0.50% |
| *Component of PCV7; ** Component of PCV13; ^ Component of PPV23; ‡ Number of isolates for Western, Central and Eastern regions, respectively | |||
Figure 20. Regional distribution of invasive S. pneumoniae serotypes in <2 year olds, 2013
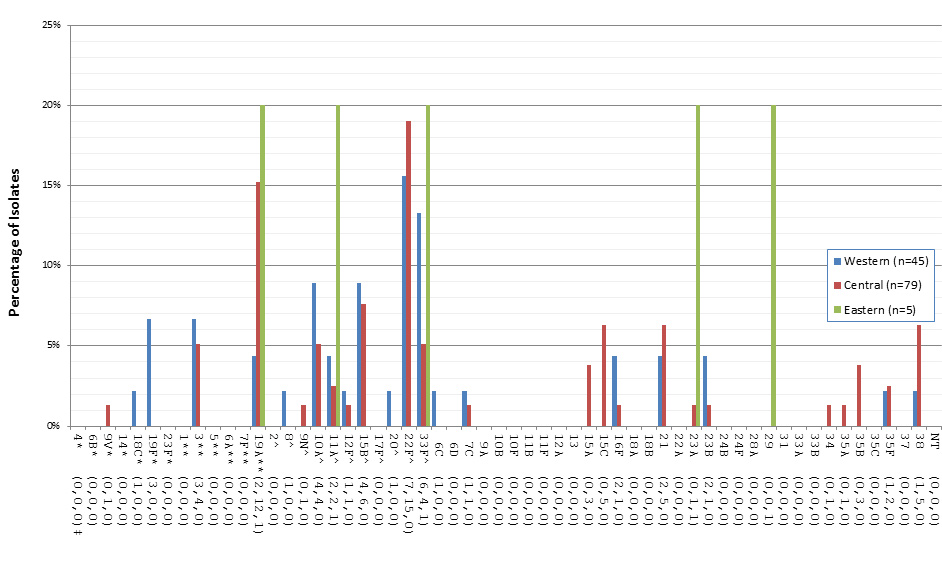
*Component of PCV7; ** Component of PCV13; ^ Component of PPV23; ‡ Number of isolates for Western, Central and Eastern regions, respectively.
Regional distribution of invasive S. pneumoniae serotypes in <2 year olds, 2013 - Text Description
This figure represents the number of isolates of each serotype from <2 year olds distributed regionally, collected in 2013.
| Serotype | Western (n=45) | Central (n=79) | Eastern (n=5) |
|---|---|---|---|
| 4* (0,0,0)‡ | 0.00% | 0.00% | 0.00% |
| 6B* (0,0,0) | 0.00% | 0.00% | 0.00% |
| 9V* (0,1,0) | 0.00% | 1.30% | 0.00% |
| 14* (0,0,0) | 0.00% | 0.00% | 0.00% |
| 18C* (1,0,0) | 2.20% | 0.00% | 0.00% |
| 19F* (3,0,0) | 6.70% | 0.00% | 0.00% |
| 23F* (0,0,0) | 0.00% | 0.00% | 0.00% |
| 1** (0,0,0) | 0.00% | 0.00% | 0.00% |
| 3** (3,4,0) | 6.70% | 5.10% | 0.00% |
| 5** (0,0,0) | 0.00% | 0.00% | 0.00% |
| 6A** (0,0,0) | 0.00% | 0.00% | 0.00% |
| 7F** (0,0,0) | 0.00% | 0.00% | 0.00% |
| 19A**(2,12,1) | 4.40% | 15.20% | 20.00% |
| 2^ (0,0,0) | 0.00% | 0.00% | 0.00% |
| 8^ (1,0,0) | 2.20% | 0.00% | 0.00% |
| 9N^ (0,1,0) | 0.00% | 1.30% | 0.00% |
| 10A^ (4,4,0) | 8.90% | 5.10% | 0.00% |
| 11A^ (2,2,1) | 4.40% | 2.50% | 20.00% |
| 12F^ (1,1,0) | 2.20% | 1.30% | 0.00% |
| 15B^ (4,6,0) | 8.90% | 7.60% | 0.00% |
| 17F^ (0,0,0) | 0.00% | 0.00% | 0.00% |
| 20^ (1,0,0) | 2.20% | 0.00% | 0.00% |
| 22F^ (7,15,0) | 15.60% | 19.00% | 0.00% |
| 33F^ (6,4,1) | 13.30% | 5.10% | 20.00% |
| 6C (1,0,0) | 2.20% | 0.00% | 0.00% |
| 6D (0,0,0) | 0.00% | 0.00% | 0.00% |
| 7C (1,1,0) | 2.20% | 1.30% | 0.00% |
| 9A (0,0,0) | 0.00% | 0.00% | 0.00% |
| 10B (0,0,0) | 0.00% | 0.00% | 0.00% |
| 10F (0,0,0) | 0.00% | 0.00% | 0.00% |
| 11B (0,0,0) | 0.00% | 0.00% | 0.00% |
| 11F (0,0,0) | 0.00% | 0.00% | 0.00% |
| 12A (0,0,0) | 0.00% | 0.00% | 0.00% |
| 13 (0,0,0) | 0.00% | 0.00% | 0.00% |
| 15A (0,3,0) | 0.00% | 3.80% | 0.00% |
| 15C (0,5,0) | 0.00% | 6.30% | 0.00% |
| 16F (2,1,0) | 4.40% | 1.30% | 0.00% |
| 18A (0,0,0) | 0.00% | 0.00% | 0.00% |
| 18B (0,0,0) | 0.00% | 0.00% | 0.00% |
| 21 (2,5,0) | 4.40% | 6.30% | 0.00% |
| 22A (0,0,0) | 0.00% | 0.00% | 0.00% |
| 23A (0,1,1) | 0.00% | 1.30% | 20.00% |
| 23B (2,1,0) | 4.40% | 1.30% | 0.00% |
| 24B (0,0,0) | 0.00% | 0.00% | 0.00% |
| 24F (0,0,0) | 0.00% | 0.00% | 0.00% |
| 28A (0,0,0) | 0.00% | 0.00% | 0.00% |
| 29 (0,0,1) | 0.00% | 0.00% | 20.00% |
| 31 (0,0,0) | 0.00% | 0.00% | 0.00% |
| 33A (0,0,0) | 0.00% | 0.00% | 0.00% |
| 33B (0,0,0) | 0.00% | 0.00% | 0.00% |
| 34 (0,1,0) | 0.00% | 1.30% | 0.00% |
| 35A (0,1,0) | 0.00% | 1.30% | 0.00% |
| 35B (0,3,0) | 0.00% | 3.80% | 0.00% |
| 35C (0,0,0) | 0.00% | 0.00% | 0.00% |
| 35F (1,2,0) | 2.20% | 2.50% | 0.00% |
| 37 (0,0,0) | 0.00% | 0.00% | 0.00% |
| 38 (1,5,0) | 2.20% | 6.30% | 0.00% |
| NT (0,0,0) | 0.00% | 0.00% | 0.00% |
| *Component of PCV7; ** Component of PCV13; ^ Component of PPV23; ‡ Number of isolates for Western, Central and Eastern regions, respectively | |||
Figure 21. Regional distribution of invasive S. pneumoniae serotypes in 2 – 4 year olds, 2013

*Component of PCV7; ** Component of PCV13; ^ Component of PPV23; ‡ Number of isolates for Western, Central and Eastern regions, respectively.
Regional distribution of invasive S. pneumoniae serotypes in 2 – 4 year olds, 2013 - Text Description
This figure represents the number of isolates of each serotype from 2 – 4 year olds distributed regionally, collected in 2013.
| Serotype | Western (n=29) | Central (n=41) | Eastern (n=5) |
|---|---|---|---|
| 4* (1,0,0)‡ | 3.40% | 0.00% | 0.00% |
| 6B* (0,0,0) | 0.00% | 0.00% | 0.00% |
| 9V* (0,0,0) | 0.00% | 0.00% | 0.00% |
| 14* (0,0,0) | 0.00% | 0.00% | 0.00% |
| 18C* (0,0,0) | 0.00% | 0.00% | 0.00% |
| 19F* (1,0,0) | 3.40% | 0.00% | 0.00% |
| 23F* (0,0,0) | 0.00% | 0.00% | 0.00% |
| 1** (0,0,0) | 0.00% | 0.00% | 0.00% |
| 3** (3,2,2) | 10.30% | 4.90% | 40.00% |
| 5** (1,1,0) | 3.40% | 2.40% | 0.00% |
| 6A** (0,0,0) | 0.00% | 0.00% | 0.00% |
| 7F** (1,1,0) | 3.40% | 2.40% | 0.00% |
| 19A**(3,9,2) | 10.30% | 22.00% | 40.00% |
| 2^ (0,0,0) | 0.00% | 0.00% | 0.00% |
| 8^ (0,2,0) | 0.00% | 4.90% | 0.00% |
| 9N^ (0,1,0) | 0.00% | 2.40% | 0.00% |
| 10A^ (2,2,0) | 6.90% | 4.90% | 0.00% |
| 11A^ (1,1,0) | 3.40% | 2.40% | 0.00% |
| 12F^ (1,0,0) | 3.40% | 0.00% | 0.00% |
| 15B^ (3,5,0) | 10.30% | 12.20% | 0.00% |
| 17F^ (0,0,0) | 0.00% | 0.00% | 0.00% |
| 20^ (0,0,0) | 0.00% | 0.00% | 0.00% |
| 22F^ (2,5,0) | 6.90% | 12.20% | 0.00% |
| 33F^ (3,0,0) | 10.30% | 0.00% | 0.00% |
| 6C (0,1,0) | 0.00% | 2.40% | 0.00% |
| 6D (0,0,0) | 0.00% | 0.00% | 0.00% |
| 7C (0,0,0) | 0.00% | 0.00% | 0.00% |
| 9A (0,0,0) | 0.00% | 0.00% | 0.00% |
| 10B (0,0,0) | 0.00% | 0.00% | 0.00% |
| 10F (0,0,0) | 0.00% | 0.00% | 0.00% |
| 11B (0,0,0) | 0.00% | 0.00% | 0.00% |
| 11F (0,0,0) | 0.00% | 0.00% | 0.00% |
| 12A (0,0,0) | 0.00% | 0.00% | 0.00% |
| 13 (0,0,0) | 0.00% | 0.00% | 0.00% |
| 15A (2,1,0) | 6.90% | 2.40% | 0.00% |
| 15C (1,2,0) | 3.40% | 4.90% | 0.00% |
| 16F (0,2,0) | 0.00% | 4.90% | 0.00% |
| 18A (0,0,0) | 0.00% | 0.00% | 0.00% |
| 18B (0,0,0) | 0.00% | 0.00% | 0.00% |
| 21 (0,1,0) | 0.00% | 2.40% | 0.00% |
| 22A (0,0,0) | 0.00% | 0.00% | 0.00% |
| 23A (0,1,0) | 0.00% | 2.40% | 0.00% |
| 23B (4,1,1) | 13.80% | 2.40% | 20.00% |
| 24B (0,0,0) | 0.00% | 0.00% | 0.00% |
| 24F (0,0,0) | 0.00% | 0.00% | 0.00% |
| 28A (0,0,0) | 0.00% | 0.00% | 0.00% |
| 29 (0,0,0) | 0.00% | 0.00% | 0.00% |
| 31 (0,0,0) | 0.00% | 0.00% | 0.00% |
| 33A (0,0,0) | 0.00% | 0.00% | 0.00% |
| 33B (0,0,0) | 0.00% | 0.00% | 0.00% |
| 34 (0,0,0) | 0.00% | 0.00% | 0.00% |
| 35A (0,0,0) | 0.00% | 0.00% | 0.00% |
| 35B (0,0,0) | 0.00% | 0.00% | 0.00% |
| 35C (0,0,0) | 0.00% | 0.00% | 0.00% |
| 35F (0,0,0) | 0.00% | 0.00% | 0.00% |
| 37 (0,0,0) | 0.00% | 0.00% | 0.00% |
| 38 (0,2,0) | 0.00% | 4.90% | 0.00% |
| NT (0,1,0) | 0.00% | 2.40% | 0.00% |
| *Component of PCV7; ** Component of PCV13; ^ Component of PPV23; ‡ Number of isolates for Western, Central and Eastern regions, respectively | |||
Figure 22. Regional distribution of invasive S. pneumoniae serotypes in 5 – 14 year olds, 2013
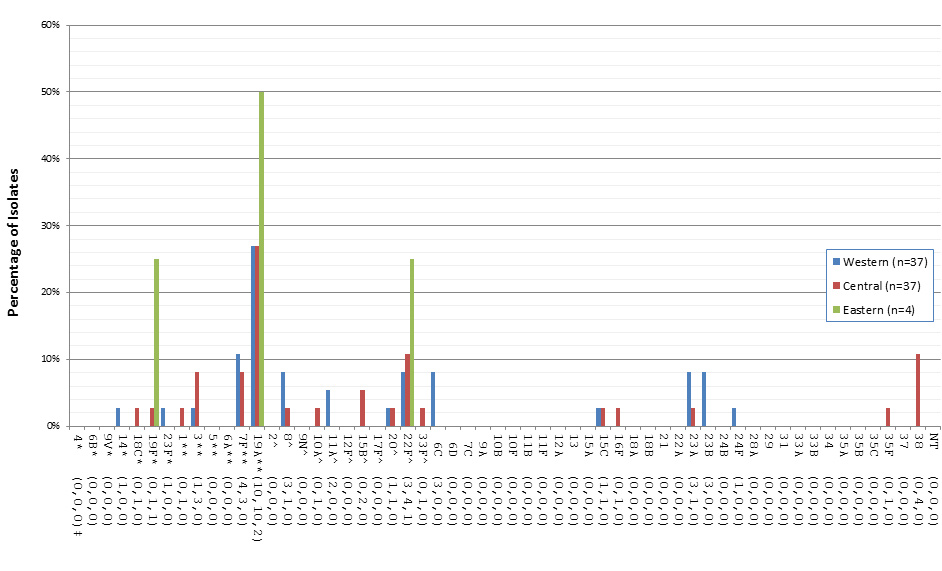
*Component of PCV7; ** Component of PCV13; ^ Component of PPV23; ‡ Number of isolates for Western, Central and Eastern regions, respectively.
Regional distribution of invasive S. pneumoniae serotypes in 5 – 14 year olds, 2013 - Text Description
This figure represents the number of isolates of each serotype from 5-14 year olds distributed regionally, collected in 2013.
| Serotype | Western (n=37) | Central (n=37) | Eastern (n=4) |
|---|---|---|---|
| 4* (0,0,0)‡ | 0.00% | 0.00% | 0.00% |
| 6B* (0,0,0) | 0.00% | 0.00% | 0.00% |
| 9V* (0,0,0) | 0.00% | 0.00% | 0.00% |
| 14* (1,0,0) | 2.70% | 0.00% | 0.00% |
| 18C* (0,1,0) | 0.00% | 2.70% | 0.00% |
| 19F* (0,1,1) | 0.00% | 2.70% | 25.00% |
| 23F* (1,0,0) | 2.70% | 0.00% | 0.00% |
| 1** (0,1,0) | 0.00% | 2.70% | 0.00% |
| 3** (1,3,0) | 2.70% | 8.10% | 0.00% |
| 5** (0,0,0) | 0.00% | 0.00% | 0.00% |
| 6A** (0,0,0) | 0.00% | 0.00% | 0.00% |
| 7F** (4,3,0) | 10.80% | 8.10% | 0.00% |
| 19A**(10,10,2) | 27.00% | 27.00% | 50.00% |
| 2^ (0,0,0) | 0.00% | 0.00% | 0.00% |
| 8^ (3,1,0) | 8.10% | 2.70% | 0.00% |
| 9N^ (0,0,0) | 0.00% | 0.00% | 0.00% |
| 10A^ (0,1,0) | 0.00% | 2.70% | 0.00% |
| 11A^ (2,0,0) | 5.40% | 0.00% | 0.00% |
| 12F^ (0,0,0) | 0.00% | 0.00% | 0.00% |
| 15B^ (0,2,0) | 0.00% | 5.40% | 0.00% |
| 17F^ (0,0,0) | 0.00% | 0.00% | 0.00% |
| 20^ (1,1,0) | 2.70% | 2.70% | 0.00% |
| 22F^ (3,4,1) | 8.10% | 10.80% | 25.00% |
| 33F^ (0,1,0) | 0.00% | 2.70% | 0.00% |
| 6C (3,0,0) | 8.10% | 0.00% | 0.00% |
| 6D (0,0,0) | 0.00% | 0.00% | 0.00% |
| 7C (0,0,0) | 0.00% | 0.00% | 0.00% |
| 9A (0,0,0) | 0.00% | 0.00% | 0.00% |
| 10B (0,0,0) | 0.00% | 0.00% | 0.00% |
| 10F (0,0,0) | 0.00% | 0.00% | 0.00% |
| 11B (0,0,0) | 0.00% | 0.00% | 0.00% |
| 11F (0,0,0) | 0.00% | 0.00% | 0.00% |
| 12A (0,0,0) | 0.00% | 0.00% | 0.00% |
| 13 (0,0,0) | 0.00% | 0.00% | 0.00% |
| 15A (0,0,0) | 0.00% | 0.00% | 0.00% |
| 15C (1,1,0) | 2.70% | 2.70% | 0.00% |
| 16F (0,1,0) | 0.00% | 2.70% | 0.00% |
| 18A (0,0,0) | 0.00% | 0.00% | 0.00% |
| 18B (0,0,0) | 0.00% | 0.00% | 0.00% |
| 21 (0,0,0) | 0.00% | 0.00% | 0.00% |
| 22A (0,0,0) | 0.00% | 0.00% | 0.00% |
| 23A (3,1,0) | 8.10% | 2.70% | 0.00% |
| 23B (3,0,0) | 8.10% | 0.00% | 0.00% |
| 24B (0,0,0) | 0.00% | 0.00% | 0.00% |
| 24F (1,0,0) | 2.70% | 0.00% | 0.00% |
| 28A (0,0,0) | 0.00% | 0.00% | 0.00% |
| 29 (0,0,0) | 0.00% | 0.00% | 0.00% |
| 31 (0,0,0) | 0.00% | 0.00% | 0.00% |
| 33A (0,0,0) | 0.00% | 0.00% | 0.00% |
| 33B (0,0,0) | 0.00% | 0.00% | 0.00% |
| 34 (0,0,0) | 0.00% | 0.00% | 0.00% |
| 35A (0,0,0) | 0.00% | 0.00% | 0.00% |
| 35B (0,0,0) | 0.00% | 0.00% | 0.00% |
| 35C (0,0,0) | 0.00% | 0.00% | 0.00% |
| 35F (0,1,0) | 0.00% | 2.70% | 0.00% |
| 37 (0,0,0) | 0.00% | 0.00% | 0.00% |
| 38 (0,4,0) | 0.00% | 10.80% | 0.00% |
| NT (0,0,0) | 0.00% | 0.00% | 0.00% |
| *Component of PCV7; ** Component of PCV13; ^ Component of PPV23; ‡ Number of isolates for Western, Central and Eastern regions, respectively | |||
Figure 23. Regional distribution of invasive S. pneumoniae serotypes in 15 – 49 year olds, 2013
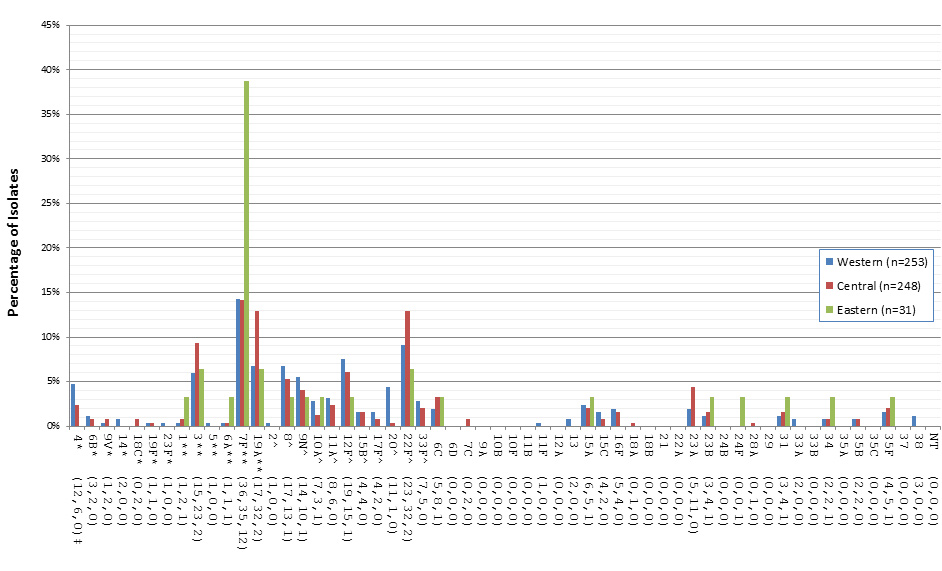
*Component of PCV7; ** Component of PCV13; ^ Component of PPV23; ‡ Number of isolates for Western, Central and Eastern regions, respectively.
Regional distribution of invasive S. pneumoniae serotypes in 15 – 49 year olds, 2013 - Text Description
This figure represents the number of isolates of each serotype from 15-49 year olds distributed regionally, collected in 2013.
| Serotype | Western (n=253) | Central (n=248) | Eastern (n=31) |
|---|---|---|---|
| 4* (12,6,0)‡ | 4.70% | 2.40% | 0.00% |
| 6B* (3,2,0) | 1.20% | 0.80% | 0.00% |
| 9V* (1,2,0) | 0.40% | 0.80% | 0.00% |
| 14* (2,0,0) | 0.80% | 0.00% | 0.00% |
| 18C* (0,2,0) | 0.00% | 0.80% | 0.00% |
| 19F* (1,1,0) | 0.40% | 0.40% | 0.00% |
| 23F* (1,0,0) | 0.40% | 0.00% | 0.00% |
| 1** (1,2,1) | 0.40% | 0.80% | 3.20% |
| 3** (15,23,2) | 5.90% | 9.30% | 6.50% |
| 5** (1,0,0) | 0.40% | 0.00% | 0.00% |
| 6A** (1,1,1) | 0.40% | 0.40% | 3.20% |
| 7F** (36,35,12) | 14.20% | 14.10% | 38.70% |
| 19A**(17,32,2) | 6.70% | 12.90% | 6.50% |
| 2^ (1,0,0) | 0.40% | 0.00% | 0.00% |
| 8^ (17,13,1) | 6.70% | 5.20% | 3.20% |
| 9N^ (14,10,1) | 5.50% | 4.00% | 3.20% |
| 10A^ (7,3,1) | 2.80% | 1.20% | 3.20% |
| 11A^ (8,6,0) | 3.20% | 2.40% | 0.00% |
| 12F^ (19,15,1) | 7.50% | 6.00% | 3.20% |
| 15B^ (4,4,0) | 1.60% | 1.60% | 0.00% |
| 17F^ (4,2,0) | 1.60% | 0.80% | 0.00% |
| 20^ (11,1,0) | 4.30% | 0.40% | 0.00% |
| 22F^ (23,32,2) | 9.10% | 12.90% | 6.50% |
| 33F^ (7,5,0) | 2.80% | 2.00% | 0.00% |
| 6C (5,8,1) | 2.00% | 3.20% | 3.20% |
| 6D (0,0,0) | 0.00% | 0.00% | 0.00% |
| 7C (0,2,0) | 0.00% | 0.80% | 0.00% |
| 9A (0,0,0) | 0.00% | 0.00% | 0.00% |
| 10B (0,0,0) | 0.00% | 0.00% | 0.00% |
| 10F (0,0,0) | 0.00% | 0.00% | 0.00% |
| 11B (0,0,0) | 0.00% | 0.00% | 0.00% |
| 11F (1,0,0) | 0.40% | 0.00% | 0.00% |
| 12A (0,0,0) | 0.00% | 0.00% | 0.00% |
| 13 (2,0,0) | 0.80% | 0.00% | 0.00% |
| 15A (6,5,1) | 2.40% | 2.00% | 3.20% |
| 15C (4,2,0) | 1.60% | 0.80% | 0.00% |
| 16F (5,4,0) | 2.00% | 1.60% | 0.00% |
| 18A (0,1,0) | 0.00% | 0.40% | 0.00% |
| 18B (0,0,0) | 0.00% | 0.00% | 0.00% |
| 21 (0,0,0) | 0.00% | 0.00% | 0.00% |
| 22A (0,0,0) | 0.00% | 0.00% | 0.00% |
| 23A (5,11,0) | 2.00% | 4.40% | 0.00% |
| 23B (3,4,1) | 1.20% | 1.60% | 3.20% |
| 24B (0,0,0) | 0.00% | 0.00% | 0.00% |
| 24F (0,0,1) | 0.00% | 0.00% | 3.20% |
| 28A (0,1,0) | 0.00% | 0.40% | 0.00% |
| 29 (0,0,0) | 0.00% | 0.00% | 0.00% |
| 31 (3,4,1) | 1.20% | 1.60% | 3.20% |
| 33A (2,0,0) | 0.80% | 0.00% | 0.00% |
| 33B (0,0,0) | 0.00% | 0.00% | 0.00% |
| 34 (2,2,1) | 0.80% | 0.80% | 3.20% |
| 35A (0,0,0) | 0.00% | 0.00% | 0.00% |
| 35B (2,2,0) | 0.80% | 0.80% | 0.00% |
| 35C (0,0,0) | 0.00% | 0.00% | 0.00% |
| 35F (4,5,1) | 1.60% | 2.00% | 3.20% |
| 37 (0,0,0) | 0.00% | 0.00% | 0.00% |
| 38 (3,0,0) | 1.20% | 0.00% | 0.00% |
| NT (0,0,0) | 0.00% | 0.00% | 0.00% |
| *Component of PCV7; ** Component of PCV13; ^ Component of PPV23; ‡ Number of isolates for Western, Central and Eastern regions, respectively | |||
Figure 24. Regional distribution of invasive S. pneumoniae serotypes in 50 – 64 year olds, 2013
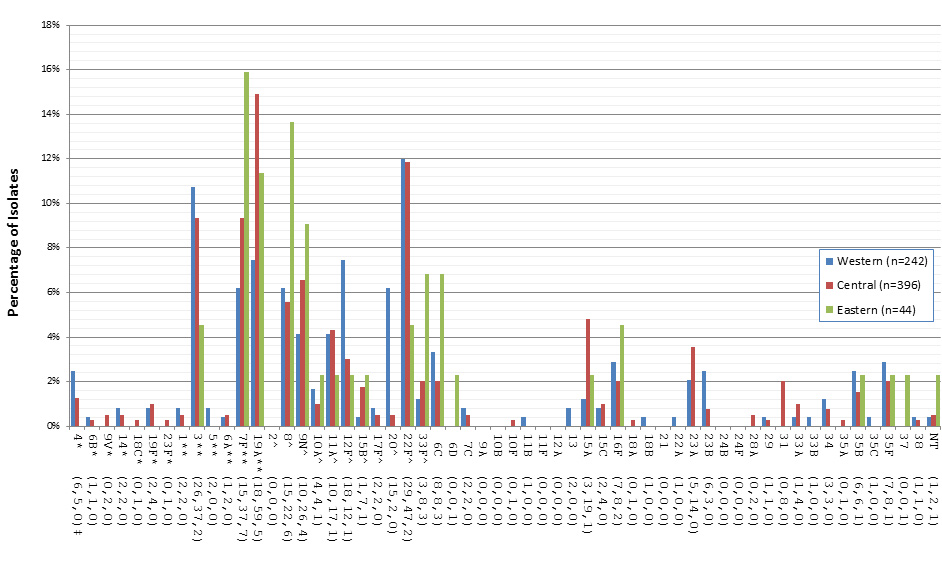
*Component of PCV7; ** Component of PCV13; ^ Component of PPV23; ‡ Number of isolates for Western, Central and Eastern regions, respectively.
Regional distribution of invasive S. pneumoniae serotypes in 50 – 64 year olds, 2013 - Text Description
This figure represents the number of isolates of each serotype from 50-64 year olds distributed regionally, collected in 2013.
| Serotype | Western (n=242) | Central (n=396) | Eastern (n=44) |
|---|---|---|---|
| 4* (6,5,0)‡ | 2.50% | 1.30% | 0.00% |
| 6B* (1,1,0) | 0.40% | 0.30% | 0.00% |
| 9V* (0,2,0) | 0.00% | 0.50% | 0.00% |
| 14* (2,2,0) | 0.80% | 0.50% | 0.00% |
| 18C* (0,1,0) | 0.00% | 0.30% | 0.00% |
| 19F* (2,4,0) | 0.80% | 1.00% | 0.00% |
| 23F* (0,1,0) | 0.00% | 0.30% | 0.00% |
| 1** (2,2,0) | 0.80% | 0.50% | 0.00% |
| 3** (26,37,2) | 10.70% | 9.30% | 4.50% |
| 5** (2,0,0) | 0.80% | 0.00% | 0.00% |
| 6A** (1,2,0) | 0.40% | 0.50% | 0.00% |
| 7F** (15,37,7) | 6.20% | 9.30% | 15.90% |
| 19A**(18,59,5) | 7.40% | 14.90% | 11.40% |
| 2^ (0,0,0) | 0.00% | 0.00% | 0.00% |
| 8^ (15,22,6) | 6.20% | 5.60% | 13.60% |
| 9N^ (10,26,4) | 4.10% | 6.60% | 9.10% |
| 10A^ (4,4,1) | 1.70% | 1.00% | 2.30% |
| 11A^ (10,17,1) | 4.10% | 4.30% | 2.30% |
| 12F^ (18,12,1) | 7.40% | 3.00% | 2.30% |
| 15B^ (1,7,1) | 0.40% | 1.80% | 2.30% |
| 17F^ (2,2,0) | 0.80% | 0.50% | 0.00% |
| 20^ (15,2,0) | 6.20% | 0.50% | 0.00% |
| 22F^ (29,47,2) | 12.00% | 11.90% | 4.50% |
| 33F^ (3,8,3) | 1.20% | 2.00% | 6.80% |
| 6C (8,8,3) | 3.30% | 2.00% | 6.80% |
| 6D (0,0,1) | 0.00% | 0.00% | 2.30% |
| 7C (2,2,0) | 0.80% | 0.50% | 0.00% |
| 9A (0,0,0) | 0.00% | 0.00% | 0.00% |
| 10B (0,0,0) | 0.00% | 0.00% | 0.00% |
| 10F (0,1,0) | 0.00% | 0.30% | 0.00% |
| 11B (1,0,0) | 0.40% | 0.00% | 0.00% |
| 11F (0,0,0) | 0.00% | 0.00% | 0.00% |
| 12A (0,0,0) | 0.00% | 0.00% | 0.00% |
| 13 (2,0,0) | 0.80% | 0.00% | 0.00% |
| 15A (3,19,1) | 1.20% | 4.80% | 2.30% |
| 15C (2,4,0) | 0.80% | 1.00% | 0.00% |
| 16F (7,8,2) | 2.90% | 2.00% | 4.50% |
| 18A (0,1,0) | 0.00% | 0.30% | 0.00% |
| 18B (1,0,0) | 0.40% | 0.00% | 0.00% |
| 21 (0,0,0) | 0.00% | 0.00% | 0.00% |
| 22A (1,0,0) | 0.40% | 0.00% | 0.00% |
| 23A (5,14,0) | 2.10% | 3.50% | 0.00% |
| 23B (6,3,0) | 2.50% | 0.80% | 0.00% |
| 24B (0,0,0) | 0.00% | 0.00% | 0.00% |
| 24F (0,0,0) | 0.00% | 0.00% | 0.00% |
| 28A (0,2,0) | 0.00% | 0.50% | 0.00% |
| 29 (1,1,0) | 0.40% | 0.30% | 0.00% |
| 31 (0,8,0) | 0.00% | 2.00% | 0.00% |
| 33A (1,4,0) | 0.40% | 1.00% | 0.00% |
| 33B (1,0,0) | 0.40% | 0.00% | 0.00% |
| 34 (3,3,0) | 1.20% | 0.80% | 0.00% |
| 35A (0,1,0) | 0.00% | 0.30% | 0.00% |
| 35B (6,6,1) | 2.50% | 1.50% | 2.30% |
| 35C (1,0,0) | 0.40% | 0.00% | 0.00% |
| 35F (7,8,1) | 2.90% | 2.00% | 2.30% |
| 37 (0,0,1) | 0.00% | 0.00% | 2.30% |
| 38 (1,1,0) | 0.40% | 0.30% | 0.00% |
| NT (1,2,1) | 0.40% | 0.50% | 2.30% |
| *Component of PCV7; ** Component of PCV13; ^ Component of PPV23; ‡ Number of isolates for Western, Central and Eastern regions, respectively | |||
Figure 25. Regional distribution of invasive S. pneumoniae serotypes in ≥65 year olds, 2013
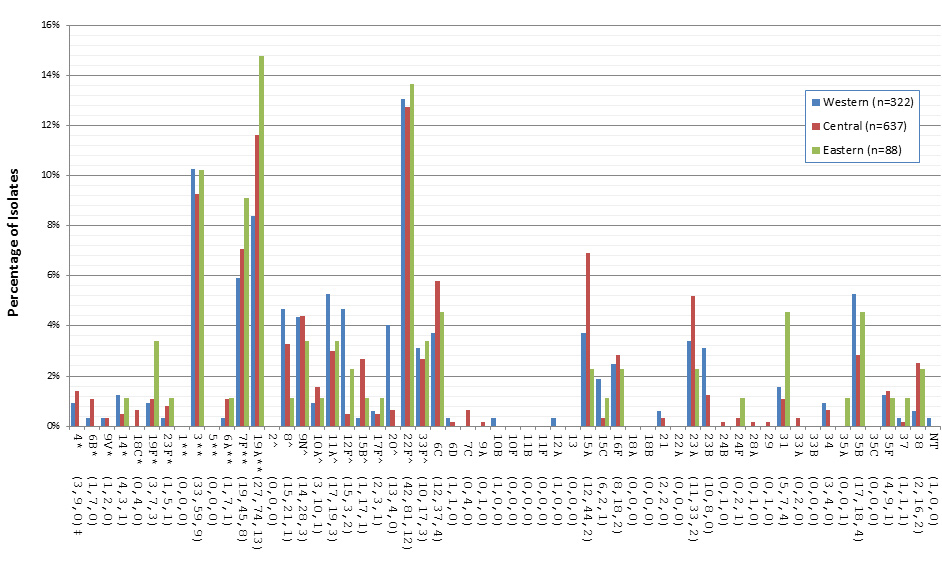
*Component of PCV7; ** Component of PCV13; ^ Component of PPV23; ‡ Number of isolates for Western, Central and Eastern regions, respectively.
Regional distribution of invasive S. pneumoniae serotypes in ≥65 year olds, 2013 - Text Description
This figure represents the number of isolates of each serotype from ≥65 year olds distributed regionally, collected between 2010-2013.
| Serotype | Western (n=322) | Central (n=637) | Eastern (n=88) |
|---|---|---|---|
| 4* (3,9,0)‡ | 0.90% | 1.40% | 0.00% |
| 6B* (1,7,0) | 0.30% | 1.10% | 0.00% |
| 9V* (1,2,0) | 0.30% | 0.30% | 0.00% |
| 14* (4,3,1) | 1.20% | 0.50% | 1.10% |
| 18C* (0,4,0) | 0.00% | 0.60% | 0.00% |
| 19F* (3,7,3) | 0.90% | 1.10% | 3.40% |
| 23F* (1,5,1) | 0.30% | 0.80% | 1.10% |
| 1** (0,0,0) | 0.00% | 0.00% | 0.00% |
| 3** (33,59,9) | 10.20% | 9.30% | 10.20% |
| 5** (0,0,0) | 0.00% | 0.00% | 0.00% |
| 6A** (1,7,1) | 0.30% | 1.10% | 1.10% |
| 7F** (19,45,8) | 5.90% | 7.10% | 9.10% |
| 19A**(27,74,13) | 8.40% | 11.60% | 14.80% |
| 2^ (0,0,0) | 0.00% | 0.00% | 0.00% |
| 8^ (15,21,1) | 4.70% | 3.30% | 1.10% |
| 9N^ (14,28,3) | 4.30% | 4.40% | 3.40% |
| 10A^ (3,10,1) | 0.90% | 1.60% | 1.10% |
| 11A^ (17,19,3) | 5.30% | 3.00% | 3.40% |
| 12F^ (15,3,2) | 4.70% | 0.50% | 2.30% |
| 15B^ (1,17,1) | 0.30% | 2.70% | 1.10% |
| 17F^ (2,3,1) | 0.60% | 0.50% | 1.10% |
| 20^ (13,4,0) | 4.00% | 0.60% | 0.00% |
| 22F^ (42,81,12) | 13.00% | 12.70% | 13.60% |
| 33F^ (10,17,3) | 3.10% | 2.70% | 3.40% |
| 6C (12,37,4) | 3.70% | 5.80% | 4.50% |
| 6D (1,1,0) | 0.30% | 0.20% | 0.00% |
| 7C (0,4,0) | 0.00% | 0.60% | 0.00% |
| 9A (0,1,0) | 0.00% | 0.20% | 0.00% |
| 10B (1,0,0) | 0.30% | 0.00% | 0.00% |
| 10F (0,0,0) | 0.00% | 0.00% | 0.00% |
| 11B (0,0,0) | 0.00% | 0.00% | 0.00% |
| 11F (0,0,0) | 0.00% | 0.00% | 0.00% |
| 12A (1,0,0) | 0.30% | 0.00% | 0.00% |
| 13 (0,0,0) | 0.00% | 0.00% | 0.00% |
| 15A (12,44,2) | 3.70% | 6.90% | 2.30% |
| 15C (6,2,1) | 1.90% | 0.30% | 1.10% |
| 16F (8,18,2) | 2.50% | 2.80% | 2.30% |
| 18A (0,0,0) | 0.00% | 0.00% | 0.00% |
| 18B (0,0,0) | 0.00% | 0.00% | 0.00% |
| 21 (2,2,0) | 0.60% | 0.30% | 0.00% |
| 22A (0,0,0) | 0.00% | 0.00% | 0.00% |
| 23A (11,33,2) | 3.40% | 5.20% | 2.30% |
| 23B (10,8,0) | 3.10% | 1.30% | 0.00% |
| 24B (0,1,0) | 0.00% | 0.20% | 0.00% |
| 24F (0,2,1) | 0.00% | 0.30% | 1.10% |
| 28A (0,1,0) | 0.00% | 0.20% | 0.00% |
| 29 (0,1,0) | 0.00% | 0.20% | 0.00% |
| 31 (5,7,4) | 1.60% | 1.10% | 4.50% |
| 33A (0,2,0) | 0.00% | 0.30% | 0.00% |
| 33B (0,0,0) | 0.00% | 0.00% | 0.00% |
| 34 (3,4,0) | 0.90% | 0.60% | 0.00% |
| 35A (0,0,1) | 0.00% | 0.00% | 1.10% |
| 35B (17,18,4) | 5.30% | 2.80% | 4.50% |
| 35C (0,0,0) | 0.00% | 0.00% | 0.00% |
| 35F (4,9,1) | 1.20% | 1.40% | 1.10% |
| 37 (1,1,1) | 0.30% | 0.20% | 1.10% |
| 38 (2,16,2) | 0.60% | 2.50% | 2.30% |
| NT (1,0,0) | 0.30% | 0.00% | 0.00% |
| *Component of PCV7; ** Component of PCV13; ^ Component of PPV23; ‡ Number of isolates for Western, Central and Eastern regions, respectively | |||
Figure 26. Serotype 19A by region

Serotype 19A by region - Text Description
This figure represents the percentage of isolates within serotype 19A for all age groups distributed by region in 2013.
| Age Group | Western | Central | Eastern |
|---|---|---|---|
| <2 yrs | 4.4% | 15.2% | 20.0% |
| 2 - 4 yrs | 10.3% | 22.0% | 40.0% |
| 5 - 14 yrs | 27.0% | 27.0% | 50.0% |
| 15 - 49 yrs | 6.7% | 12.9% | 6.5% |
| 50 - 64 yrs | 7.4% | 14.9% | 11.4% |
| ≥65 yrs | 8.4% | 11.6% | 14.8% |
| All Ages | 8.2% | 13.5% | 13.7% |
Figure 27. Serotype 7F by region
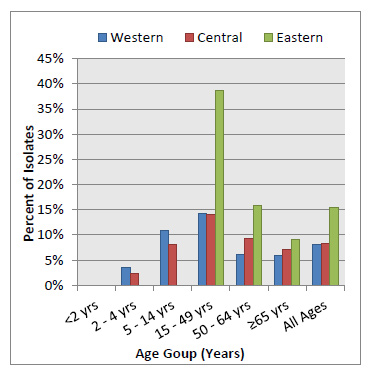
Serotype 7F by region - Text Description
This figure represents the percentage of isolates within serotype 7F for all age groups distributed by region in 2013.
| Age Group | Western | Central | Eastern |
|---|---|---|---|
| <2 yrs | 0.0% | 0.0% | 0.0% |
| 2 - 4 yrs | 3.4% | 2.4% | 0.0% |
| 5 - 14 yrs | 10.8% | 8.1% | 0.0% |
| 15 - 49 yrs | 14.2% | 14.1% | 38.7% |
| 50 - 64 yrs | 6.2% | 9.3% | 15.9% |
| ≥65 yrs | 5.9% | 7.1% | 9.1% |
| All Ages | 8.1% | 8.4% | 15.4% |
Figure 28. Serotype 3 by region
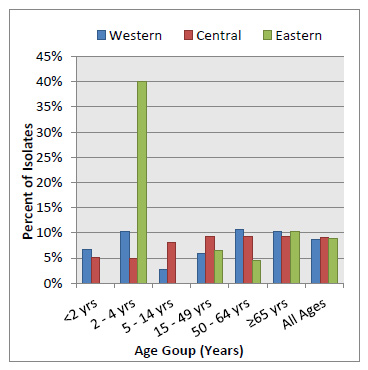
Serotype 3 by region - Text Description
This figure represents the percentage of isolates within serotype 3 for all age groups distributed by region in 2013.
| Age Group | Western | Central | Eastern |
|---|---|---|---|
| <2 yrs | 6.7% | 5.1% | 0.0% |
| 2 - 4 yrs | 10.3% | 4.9% | 40.0% |
| 5 - 14 yrs | 2.7% | 8.1% | 0.0% |
| 15 - 49 yrs | 5.9% | 9.3% | 6.5% |
| 50 - 64 yrs | 10.7% | 9.3% | 4.5% |
| ≥65 yrs | 10.2% | 9.3% | 10.2% |
| All Ages | 8.7% | 9.0% | 8.8% |
Figure 29. Serotype 22F by region
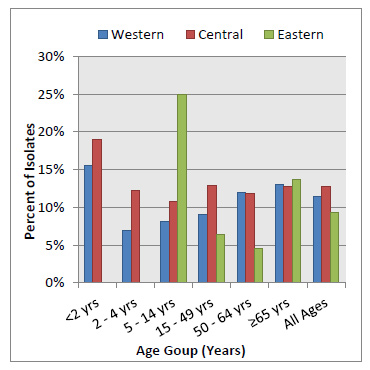
Serotype 22F by region - Text Description
This figure represents the percentage of isolates within serotype 22F for all age groups distributed by region in 2013.
| Age Group | Western | Central | Eastern |
|---|---|---|---|
| <2 yrs | 15.6% | 19.0% | 0.0% |
| 2 - 4 yrs | 6.9% | 12.2% | 0.0% |
| 5 - 14 yrs | 8.1% | 10.8% | 25.0% |
| 15 - 49 yrs | 9.1% | 12.9% | 6.5% |
| 50 - 64 yrs | 12.0% | 11.9% | 4.5% |
| ≥65 yrs | 13.0% | 12.7% | 13.6% |
| All Ages | 11.5% | 12.8% | 9.3% |
Vaccine Serotypes
Total numbers of PCV7 serotypes (4, 6B, 9V 14, 18C 19F, 23F) are very small in the <15 year old age groups, however the proportions have continued to decline in most age groups in 2013 except in children 2 - 4 years of age where proportions have increased from 1.6% (n=2) to 2.7% (n=2) from 2012 to 2013, and in the 5 – 14 year old age group with an increase from 4.8% (n=5) to 6.4% (n=5) (Figure 32).
The proportion of PCV13 serotypes (1, 3, 5, 6A, 7F and 19A) in Canada has continued to decrease in all combined age groups from 36.3% (n=952) in 2012 to 30.4% (n=783) in 2013 (Figure 31). The Eastern regions had the highest proportion of PCV13 serotypes in 2013 with 39.6% (n=72), a small decrease from 42.1% (n=75) in 2012 (Figure 30). Decreases of the PCV13 serotypes have been seen in all age groups between 2012 and 2013, which is generally due to the reduction in proportions of serotypes 7F and 19A. PCV13 serotypes represented 17.1% (n=22) of isolates in <2 year olds, 33.3% (n=27) in 2 – 4 year olds, 43.6% (n=34) of 5 – 14 year olds, 34.2% (n=182) of 15 – 49 year olds, 31.5% (n=215) of 50 – 64 year olds, and 28.3% (n=296) in those ≥65 years of age in 2013 (Figure 33).
The overall PCV7+PCV13 serotypes declined from 42.5% (n=1114) in 2012 to 35.4% (n=911) in 2013 (Figure 31). In 2013, total overall PCV7+PCV13 serotypes represented for 42.9% (n=78) of Eastern, 36.9% (n=536) of Central and 31.6% (n=297) of Western isolates. The PCV7+PCV13 serotypes in the Central and Western regions declined from 40.5% (n=586) to 32.1% (n=466); and from 29.3% (n=291) to 26.0% (n=245), respectively (Figure 30).
The proportion of isolates representing PPV23 serotypes (2, 8, 9N, 10A, 11A, 12F, 15B, 17F, 20, 22F, 33F) have increased in all combined age group isolates from 24.7% (n=670) in 2010 to 37.6% (n=970) in 2013 (Figure 31). The largest increase in 2013 has been observed in the <2 year old age group which increased from 26.7% (n=31) in 2012 to 47.3% (n=61) in 2013. From 2012 to 2013, the, PPV23 serotypes 2 – 4 year old age group increased from 26.8% (n=33) to 37.3% (n=28); in the 5 – 14 year old age group decreased from 2.9% (n=24) to 2.1% (n=24)in the 15 - 49 year old age group from 35.6% (n=218) to 39.8% (n=212); in the 50 – 64 year old age group from 34.0% (n=237) to 40.0% (n=273); and in the ≥65 year old age group from 30.4% (n=286) to 36.6% (n=362), respectively (Figure 34).
| VaccineFootnote * | Age Group (N) | ||||||
|---|---|---|---|---|---|---|---|
| <2 | 2-4 | 5-14 | 15-19 | 50-64 | ≥65 | All AgesFootnote ** | |
| PCV7 | 3.9% (5)Footnote *** | 2.7% (2) | 6.4% (5) | 6.2% (33) | 4% (27) | 5.3% (55) | 5% (128) |
| PCV13 | 17.1% (22) | 33.3% (25) | 43.6% (34) | 34.2% (182) | 31.5% (215) | 28.3% (296) | 30.4% (783) |
| PCV13 All | 20.9% (27) | 36% (27) | 50% (39) | 40.4% (215) | 35.5% (242) | 33.5% (351) | 35.4% (911) |
| PPV23 | 47.3% (61) | 37.3% (28) | 25.6% (20) | 39.8% (212) | 40% (273) | 34.6% (362) | 37.6% (970) |
| PPV23 All | 68.2% (88) | 73.3% (55) | 75.6% (59) | 79.7% (424) | 75.1% (512) | 67.2% (704) | 70.6% (24) |
| NVT Total | 31.8% (41) | 26.7% (20) | 24.4% (19) | 19.7% (105) | 24.5% (167) | 31.9% (334) | 27% (696) |
| All | (129) | (75) | (78) | (532) | (682) | (1047) | (2577) |
Figure 30. Vaccine serotypes by region, 2013
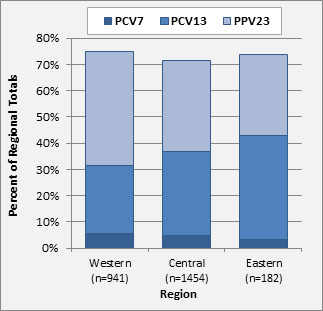
Vaccine serotypes by region, 2013 - Text Description
This figure represents the percentage vaccine serotypes found in each region in 2013.
| Serotypes | Western (n=941) | Central (n=1454) | Eastern (n=182) |
|---|---|---|---|
| PCV7 | 5.5% | 4.8% | 3.3% |
| PCV13 | 26.0% | 32.0% | 39.6% |
| PPV23 | 43.6% | 34.7% | 30.8% |
Figure 31. Vaccine serotypes 2010 - 2013
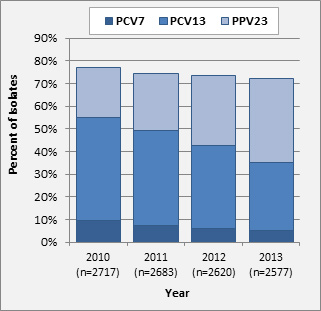
Vaccine serotypes 2010 - 2013 - Text Description
This figure represents the percentage of vaccine serotypes by year, 2010 to 2013.
| Serotypes | 2010 (n=2717) | 2011 (n=2683) | 2012 (n=2620) | 2013 (n=2577) |
|---|---|---|---|---|
| PCV7 | 9.5% | 7.5% | 6.2% | 5.0% |
| PCV13 | 45.5% | 42.0% | 36.3% | 30.4% |
| PPV23 | 22.0% | 25.0% | 30.9% | 37.1% |
Figure 32. PCV7 serotypes (4, 6B, 9V, 14, 18C, 19F, 23F) by age group, 2010 – 2013
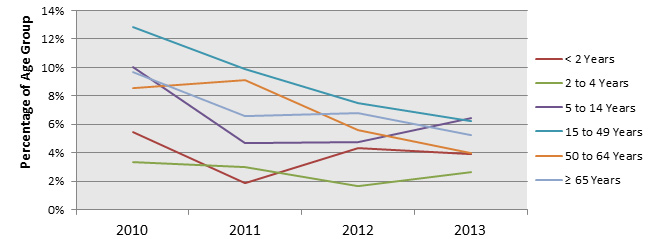
PCV7 serotypes (4, 6B, 9V, 14, 18C, 19F, 23F) by age group, 2010 – 2013 - Text Description
This figure represents the percentage of PCV7 serotypes by age groups and by year from 2010 to 2013.
| Year | < 2 Years | 2 to 4 Years | 5 to 14 Years | 15 to 49 Years | 50 to 64 Years | ≥65 Years |
|---|---|---|---|---|---|---|
| 2010 | 5.4% | 3.4% | 10.0% | 12.8% | 8.5% | 9.7% |
| 2011 | 1.9% | 3.0% | 4.7% | 9.9% | 9.1% | 6.6% |
| 2012 | 4.3% | 1.6% | 4.8% | 7.5% | 5.6% | 6.8% |
| 2013 | 3.9% | 2.7% | 6.4% | 6.2% | 4.0% | 5.3% |
| Age Group (Years) | Year | |||
|---|---|---|---|---|
| 2010 | 2011 | 2012 | 2013 | |
| <2 | 10 | 3 | 5 | 5 |
| 2 - 4 | 5 | 4 | 2 | 2 |
| 5 - 14 | 11 | 6 | 5 | 5 |
| 15 - 49 | 75 | 62 | 46 | 33 |
| 50 - 64 | 59 | 63 | 39 | 27 |
| ≥65 | 94 | 60 | 64 | 55 |
Figure 33. PCV13 serotypes (1, 5, 7F, 3, 6A, 19A) by age group, 2010 – 2013
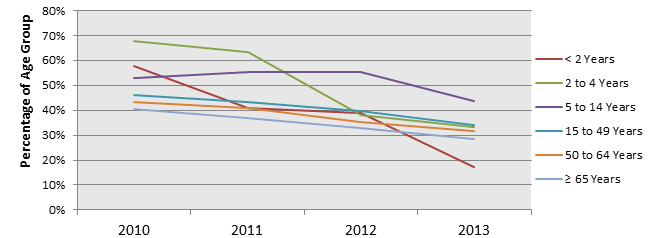
PCV13 serotypes (1, 5, 7F, 3, 6A, 19A) by age group, 2010 – 2013 - Text Description
This figure represent the percentage of PCV13 serotypes by age group and by year from 2010 to 2013.
| Year | < 2 Years | 2 to 4 Years | 5 to 14 Years | 15 to 49 Years | 50 to 64 Years | ≥65 Years |
|---|---|---|---|---|---|---|
| 2010 | 57.6% | 67.6% | 52.7% | 45.9% | 43.2% | 40.6% |
| 2011 | 41.0% | 63.4% | 55.5% | 43.5% | 41.0% | 36.8% |
| 2012 | 38.8% | 38.2% | 55.2% | 39.5% | 35.4% | 32.8% |
| 2013 | 17.1% | 33.3% | 43.6% | 34.2% | 31.5% | 28.3% |
| Age Group (Years) | Year | |||
|---|---|---|---|---|
| 2010 | 2011 | 2012 | 2013 | |
| <2 | 106 | 66 | 45 | 22 |
| 2 - 4 | 100 | 85 | 47 | 25 |
| 5 - 14 | 58 | 71 | 58 | 34 |
| 15 - 49 | 268 | 273 | 242 | 182 |
| 50 - 64 | 299 | 284 | 247 | 215 |
| ≥65 | 394 | 337 | 308 | 296 |
Figure 34. PPV23 serotypes (2, 8, 9N, 10A, 11A, 12F, 15B, 17F, 20, 22F, 33F) by age group, 2010 – 2013
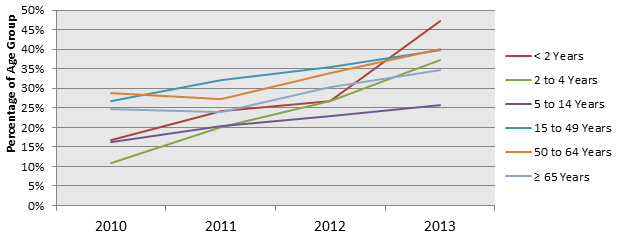
PPV23 serotypes (2, 8, 9N, 10A, 11A, 12F, 15B, 17F, 20, 22F, 33F) by age group, 2010 – 2013 - Text Description
This figure represents the percentage of PCV23 serotypes by age group and by year from 2010 to 2013.
| Year | < 2 Years | 2 to 4 Years | 5 to 14 Years | 15 to 49 Years | 50 to 64 Years | ≥65 Years |
|---|---|---|---|---|---|---|
| 2010 | 16.8% | 10.8% | 16.4% | 26.7% | 28.9% | 24.7% |
| 2011 | 24.2% | 20.1% | 20.3% | 32.2% | 27.3% | 23.9% |
| 2012 | 26.7% | 26.8% | 22.9% | 35.6% | 34.0% | 30.4% |
| 2013 | 47.3% | 37.3% | 25.6% | 39.8% | 40.0% | 34.6% |
| Age Group (Years) | Year | |||
|---|---|---|---|---|
| 2010 | 2011 | 2012 | 2013 | |
| <2 | 31 | 39 | 31 | 61 |
| 2 - 4 | 16 | 27 | 33 | 28 |
| 5 - 14 | 18 | 26 | 24 | 20 |
| 15 - 49 | 156 | 202 | 218 | 212 |
| 50 - 64 | 200 | 189 | 237 | 273 |
| ≥65 | 240 | 219 | 286 | 362 |
Figure 35. Non-vaccine serotypes by age group, 2010 – 2013
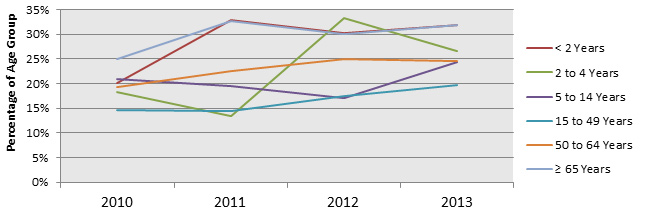
Non-vaccine serotypes by age group, 2010 – 2013 - Text Description
This figure represents the percentage of non-vaccine serotypes by age group and by year from 2010 to 2013.
| Year | < 2 Years | 2 to 4 Years | 5 to 14 Years | 15 to 49 Years | 50 to 64 Years | ≥65 Years |
|---|---|---|---|---|---|---|
| 2010 | 20.1% | 18.2% | 20.9% | 14.6% | 19.4% | 25.0% |
| 2011 | 32.9% | 13.4% | 19.5% | 14.5% | 22.5% | 32.7% |
| 2012 | 30.2% | 33.3% | 17.1% | 17.5% | 25.1% | 30.0% |
| 2013 | 31.8% | 26.7% | 24.4% | 19.7% | 24.5% | 31.9% |
| Age Group (Years) | Year | |||
|---|---|---|---|---|
| 2010 | 2011 | 2012 | 2013 | |
| <2 | 37 | 53 | 35 | 41 |
| 2 - 4 | 27 | 18 | 41 | 20 |
| 5 - 14 | 23 | 25 | 18 | 19 |
| 15 - 49 | 85 | 91 | 107 | 105 |
| 50 - 64 | 134 | 156 | 175 | 167 |
| ≥65 | 243 | 299 | 282 | 334 |
Antimicrobial Resistance of S. pneumoniae
As part of a joint NML/CARA program called SAVE, antimicrobial susceptibility testing was performed on 1061 S. pneumoniae isolates from 2013 from any age group causing IPD submitted from 8 participating jurisdictions (Saskatchewan, Manitoba, Ontario, Quebec, Nova Scotia, Prince Edward Island, New Brunswick, Newfoundland and Labrador).
High rates of resistance were observed to clarithromycin in 2013 (24.8%, n=263), increasing slightly from 2011 levels (21.4%, n=242). Lower resistance rates were seen with penicillin using meningitis breakpoints declining from 11.9% (n=135) in 2011 to 10.0% (n=106) in 2013. Resistance to clindamycin has also declined since 2011 from 7.1% (n=80) to 5.9% (n=62) in 2013. Resistance to doxycycline has remained relatively stable since 2010, at 9.9% (n=105) in 2013, whereas trimethoprim/sulfamethoxazole resistant S. pneumoniae has increased from 5.1% (n=58) to 7.4% (n=78) over the same time period. There were also small increases observed in imipenem and meropenem resistance between 2011 and 2013 from 1.0% (n=11) to 2.3% (n=24); and from 2.0% (n=23) to 2.6% (n=28); respectively. No non-susceptibility to linezolid, tigecycline, or vancomycin was found (Figure 36). Regional comparison of the rates of S. pneumoniae antimicrobial resistance during 2013 indicate marginally higher rates of resistance in Western Canada to clarithromycin (29.8%, n=73), penicillin with meningitis breakpoints (11.0%, n=27) and trimethoprim/sulfamethoxazole (9.4%, n=23); whereas resistance to clindamycin and doxycycline was more prevalent in Central regions (6.5%, n=44; 11.5%, n=78; respectively) (Figure 37).
Serotype 15A isolates generally had the highest rates of resistance during 2013 with 40.9% (n=9) resistant to penicillin using meningitis breakpoints, 77.3% (n=17) resistant to clarithromycin, 31.8% (n=7) resistant to clindamycin, and 72.7% (n=16) resistant to doxycycline (Table 8).
In 2013, clarithromycin resistance was associated with serotypes 19A (59.6%, n=68); 10A (22.6%, n=7); 12F (81.1%, n=43); 15A (77.3%, n=17); 22F (28.0%, n=33), and 33F (81.6%, n=40) (Figure 40). Cefuroxime parenteral resistant serotypes of S. pneumoniae were predominately 19A (26.3%, n=30) and 35B (21.4%, n=6); and higher levels of clindamycin resistance were seen in serotypes 19A (26.3%, n=30), 33F (16.3%, n=8) and 15A (31.8%, n=7). Doxycycline resistance serotypes included 19A (33.3%, n=38) and 15A (72.7%, n=16). Imipenem and meropenem resistance was mainly associated with serotype 19A isolates (20.2%, n=23; 21.1%, n=24; respectively). Relatively high rates of resistance to penicillin (meningitis) were evident in serotypes 6A (60.0%, n=3), 6C (33.3%, n=11), 15A (40.9%, n=9), 19A (28.9%, n=33), 23A (30.0%, n=9) and 23B (38.1%, n=8), and 35B (25.0%, n=7). Trimethoprim/sulfamethoxazole resistance was associated with serotypes 19A (27.2%, n=31) and 6C (21.2%, n=7) (Figure 47).
Multidrug resistance (MDR) to 3 or more classes of antimicrobials, was observed in 7.5% (n=80) of the S. pneumoniae tested in 2013, a slight decrease from 8.0% (n=91) observed in 2011 (Figure 38). Serotypes with the highest rates of MDR during 2013 were 15A (n=11) with 50.0% isolates resistant to 3 or more classes of antimicrobials (Figure 39) which is a decrease from 74.1% (n=20) in 2011; 19A with 28.9% (n=33), similar to 2011 levels at 29.1% (n=43); 6C with 24.2% (n=8), increasing from 8.7% (n=4) in 2011; and 19F with 23.1% (n=3), unchanged from 2011. The major MDR pattern among serotype 15A isolates was β-lactam-macrolide-clindamycin-tetracycline; for 19A and 19F β-lactam-macrolide-clindamycin-tetracycline-trimethoprim/ sulfamethoxazole; and for 6C β-lactam-macrolide- trimethoprim/sulfamethoxazole. Resistance to all 6 classes of antimicrobials was seen in 1 isolate of serotype 23F.
Figure 36. Antimicrobial resistance of S. pneumoniae isolates, 2011 - 2013

*AUG = amoxicillin/clavulanic acid; PENm = penicillin using the parenteral meningitis CLSI interpretive standard; ; PENn = penicillin using the parenteral non-meningitis interpretive standard; PENo = penicillin using the oral penicillin V interpretive standard; LEV = levofloxacin; MOX = moxifloxacin; AXOm = ceftriaxone using the parenteral meningitis interpretive standard; AXOn = ceftriaxone using the parenteral non-meningitis interpretative standard; FURo = cefuroxime using the oral interpretative standard; FURp = cefuroxime using the parenteral interpretative standard; ETP = ertapenem; IMI = imipenem; MER = meropenem; CLA = clarithromycin; CLI = clindamycin; CHL = chloramphenicol; DOX = doxycycline; SXT = trimethoprim/sulfamethoxazole. Non susceptibility was not observed for daptomycin (no interpretative standard), linezolid, tigecycline (no interpretative standard), or vancomycin. EUCAST[EUCAST, 2012] interpretative breakpoints were used for DOX, all other according to CLSI[CLSI, 2011]. **Number of isolates in 2011, 2012 and 2013, respectively.
Antimicrobial resistance of S. pneumoniae isolates, 2011 - 2013 - Text Description
This figure represents the percentage of resistant isolates by antibiotic and by year from 2011 to 2013.
| Region | AUGFootnote * (20,19,7)Footnote ** |
AXOm (11,9,7) |
AXOn (1,3,1) |
FURo (48,42,38) |
FURp (51,47,50) |
CHL (11,26,11) |
CIP (18,22,15) |
CLA (242,278,263) |
CLI (80,76,62) |
DOX (104,115,105) |
ERT (1,3,1) |
IMI (11,20,24) |
LEV (4,6,6) |
MER (23,26,28) |
MOX (2,5,1) |
PENm (135,123,106) |
PENn (0,0,1) |
PENo (42,35,36) |
SXT (58,66,78) |
|---|---|---|---|---|---|---|---|---|---|---|---|---|---|---|---|---|---|---|---|
| 2011 (n=1133) | 1.7% | 1.0% | 0.1% | 4.2% | 4.5% | 1.0% | 1.6% | 21.4% | 7.1% | 9.2% | 0.1% | 0.1% | 0.4% | 2.0% | 0.2% | 11.9% | 0.0% | 3.7% | 5.4% |
| 2012 (n=1128) | 1.7% | 0.8% | 0.3% | 3.7% | 4.2% | 2.3% | 2.0% | 24.6% | 6.7% | 10.2% | 0.3% | 1.8% | 0.5% | 2.3% | 0.4% | 10.9% | 0.0% | 3.1% | 5.9% |
| 2013 (n=1061) | 0.7% | 0.7% | 0.1% | 3.6% | 4.7% | 1.0% | 1.4% | 24.8% | 5.8% | 9.9% | 0.1% | 2.3% | 0.6% | 2.6% | 0.1% | 10.0% | 0.1% | 3.4% | 7.4% |
Figure 37. Regional antimicrobial resistance of S. pneumoniae, 2013
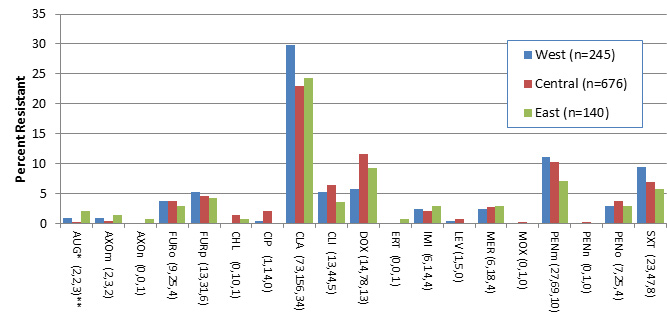
*AUG = amoxicillin/clavulanic acid; PENm = penicillin using the parenteral meningitis CLSI interpretive standard; ; PENn = penicillin using the parenteral non-meningitis interpretive standard; PENo = penicillin using the oral penicillin V interpretive standard; LEV = levofloxacin; MOX = moxifloxacin; AXOm = ceftriaxone using the parenteral meningitis interpretive standard; AXOn = ceftriaxone using the parenteral non-meningitis interpretative standard; FURo = cefuroxime using the oral interpretative standard; FURp = cefuroxime using the parenteral interpretative standard; ETP = ertapenem; IMI = imipenem; MER = meropenem; CLA = clarithromycin; CLI = clindamycin; CHL = chloramphenicol; DOX = doxycycline; SXT = trimethoprim/sulfamethoxazole. Non susceptibility was not observed for daptomycin (no interpretative standard), linezolid, tigecycline (no interpretative standard), or vancomycin. EUCAST[EUCAST, 2012] interpretative breakpoints were used for DOX, all other according to CLSI[CLSI, 2011]. ** Number of isolates in 2011, 2012 and 2013, respectively.
Regional antimicrobial resistance of S. pneumoniae, 2013 - Text Description
This figure represents the percentage of resistant isolates by antibiotic and by region for 2013.
| Region | AUGFootnote * (2,2,3)Footnote ** |
AXOm (2,3,2) |
AXOn (0,0,1) |
FURo (9,25,4) |
FURp (13,31,6) |
CHL (0,10,1) |
CIP (1,14,0) |
CLA (73,156,34) |
CLI (13,44,5) |
DOX (14,78,13) |
ERT (0,0,1) |
IMI (6,14,4) |
LEV (1,5,0) |
MER (6,18,4) |
MOX (0,1,0) |
PENm (27,69,10) |
PENn (0,1,0) |
PENo (7,25,4) |
SXT (23,47,8) |
|---|---|---|---|---|---|---|---|---|---|---|---|---|---|---|---|---|---|---|---|
| West (n=245) | 0.8% | 0.8% | 0.0% | 3.7% | 5.3% | 0.0% | 0.4% | 29.8% | 5.3% | 5.7% | 0.0% | 2.4% | 0.4% | 2.4% | 0.0% | 11.0% | 0.0% | 2.9% | 9.4% |
| Central (n=676) | 0.3% | 0.4% | 0.0% | 3.7% | 4.6% | 1.5% | 2.1% | 23.0% | 6.5% | 11.5% | 0.0% | 2.1% | 0.7% | 2.7% | 0.1% | 10.2% | 0.1% | 3.7% | 7.0% |
| East (n=140) | 2.1% | 1.4% | 0.7% | 2.9% | 4.3% | 0.7% | 0.0% | 24.3% | 3.6% | 9.3% | 0.7% | 2.9% | 0.0% | 2.9% | 0.0% | 7.1% | 0.0% | 2.9% | 5.7% |
Figure 38. Multi-drug resistance of S. pneumoniae, 2011 - 2013
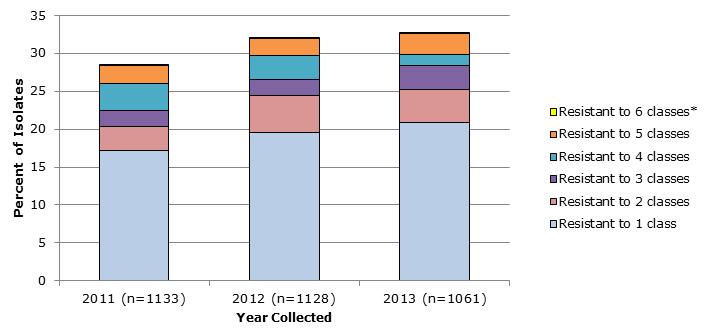
*Antimicrobial classes include: β-lactams (amoxicillin/clavulanic acid, penicillin using meninigitis breakpoints, ceftriaxone using meningitis breakpoints, cefuroxime using parenteral breakpoint, ertapenem, imipenem and meropenem); macrolides (clarithromycin); fluoroquinolones (levofloxacin and moxifloxacin); tetracyclines (doxycycline); folate pathway inhibitors (trimethoprim-sulflamethoxazole); phenicols (chloramphenicol); lincosamides (clindamycin); oxazolidinones (linezolid).
Multi-drug resistance of S. pneumoniae, 2011 - 2013 - Text Description
This figure represents the percentage of isolates that are resistant to 1 or more classes of drugs by year from 2011 to 2013.
| Year | Resistant to 1 class | Resistant to 2 classes | Resistant to 3 classes | Resistant to 4 classes | Resistant to 5 classes | Resistant to 6 classesFootnote * |
|---|---|---|---|---|---|---|
| 2011 (n=1133) | 17.1% | 3.3% | 2.0% | 3.6% | 2.3% | 0.1% |
| 2012 (n=1128) | 19.6% | 4.9% | 2.1% | 3.1% | 2.2% | 0.2% |
| 2013 (n=1061) | 20.9% | 4.2% | 3.2% | 1.4% | 2.8% | 0.1% |
Figure 39. Multi-drug resistance of S. pneumoniae serotypes, 2013
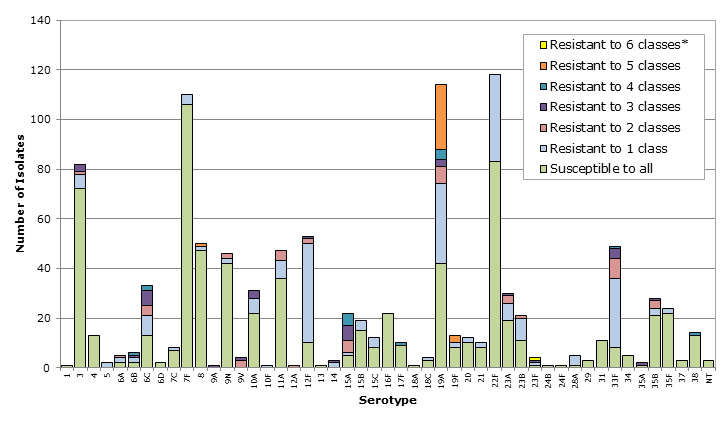
*Antimicrobial classes include: β-lactams (amoxicillin/clavulanic acid, penicillin using meninigitis breakpoints, ceftriaxone using meningitis breakpoints, cefuroxime using parenteral breakpoint, ertapenem, imipenem and meropenem); macrolides (clarithromycin); fluoroquinolones (levofloxacin and moxifloxacin); tetracyclines (doxycycline); folate pathway inhibitors (trimethoprim-sulflamethoxazole); phenicols (chloramphenicol); lincosamides (clindamycin); oxazolidinones (linezolid).
Multi-drug resistance of S. pneumoniae serotypes, 2013 - Text Description
This figure represents the number of isolates resistant to 1 or more classes of drugs by serotype.
| Serotype | Susceptible to all | Resistant to 1 class | Resistant to 2 classes | Resistant to 3 classes | Resistant to 4 classes | Resistant to 5 classes | Resistant to 6 classesFootnote * |
|---|---|---|---|---|---|---|---|
| 1 | 1 | ||||||
| 3 | 72 | 6 | 1 | 3 | |||
| 4 | 13 | ||||||
| 5 | 2 | ||||||
| 6A | 2 | 2 | 1 | ||||
| 6B | 2 | 2 | 1 | 1 | |||
| 6C | 13 | 8 | 4 | 6 | 2 | ||
| 6D | 2 | ||||||
| 7C | 7 | 1 | |||||
| 7F | 106 | 4 | |||||
| 8 | 47 | 2 | 1 | ||||
| 9A | 1 | ||||||
| 9N | 42 | 2 | 2 | ||||
| 9V | 3 | 1 | |||||
| 10A | 22 | 6 | 3 | ||||
| 10F | 1 | ||||||
| 11A | 36 | 7 | 4 | ||||
| 12A | 1 | ||||||
| 12F | 10 | 40 | 2 | 1 | |||
| 13 | 1 | ||||||
| 14 | 2 | 1 | |||||
| 15A | 5 | 1 | 5 | 6 | 5 | ||
| 15B | 15 | 4 | |||||
| 15C | 8 | 4 | |||||
| 16F | 22 | ||||||
| 17F | 9 | 1 | |||||
| 18A | 1 | ||||||
| 18C | 3 | 1 | |||||
| 19A | 42 | 32 | 7 | 3 | 4 | 26 | |
| 19F | 8 | 2 | 3 | ||||
| 20 | 10 | 2 | |||||
| 21 | 8 | 2 | |||||
| 22F | 83 | 35 | |||||
| 23A | 19 | 7 | 3 | 1 | |||
| 23B | 11 | 9 | 1 | ||||
| 23F | 1 | 1 | 1 | 1 | |||
| 24B | 1 | ||||||
| 24F | 1 | ||||||
| 28A | 1 | 4 | |||||
| 29 | 3 | ||||||
| 31 | 11 | ||||||
| 33F | 8 | 28 | 8 | 4 | 1 | ||
| 34 | 5 | ||||||
| 35A | 1 | 1 | |||||
| 35B | 21 | 3 | 3 | 1 | |||
| 35F | 22 | 2 | |||||
| 37 | 3 | ||||||
| 38 | 13 | 1 | |||||
| NT | 3 | ||||||
| Class | Penicllins | Cephems | Carbapenems | Fluoroquinolones | Other | |||||||||||||
|---|---|---|---|---|---|---|---|---|---|---|---|---|---|---|---|---|---|---|
| Serotype | AUGFootnote a | PENm | PENn | PENo | AXOm | AXOn | FURo | FURp | ERT | IMI | MER | LEV | MOX | CLA | CLI | CHL | DOX | SXT |
| 1 (n=1) | -Footnote b | - | - | - | - | - | - | - | - | - | - | - | - | - | - | - | - | - |
| 3 (n=82) | - | 1.2Footnote c | - | - | - | - | - | - | - | - | - | - | - | 3.7 | 2.4 | 7.3 | 11.0 | 1.2 |
| 4 (n=13) | - | - | - | - | - | - | - | - | - | - | - | - | - | - | - | - | - | - |
| 5 (n=2) | - | - | - | - | - | - | - | - | - | - | - | - | - | - | - | - | - | 100 |
| 6A (n=5) | - | 60.0 | - | - | - | - | - | - | - | - | - | 20.0 | - | - | - | - | - | - |
| 6B (n=6) | - | 16.7 | - | - | - | - | - | - | - | - | - | - | - | 33.3 | 16.7 | - | 33.3 | 50.0 |
| 6C (n=33) | - | 33.3 | - | 3.0 | - | - | - | 6.1 | - | - | - | - | - | 45.5 | 12.1 | - | 12.1 | 21.2 |
| 6D (n=2) | - | - | - | - | - | - | - | - | - | - | - | - | - | - | - | - | - | - |
| 7C (n=8) | - | - | - | - | - | - | - | - | - | - | - | - | - | - | - | - | - | 12.5 |
| 7F (n=110) | - | - | - | - | - | - | - | - | - | - | - | - | - | - | - | - | 3.6 | - |
| 8 (n=50) | - | 2.0 | - | 2.0 | - | - | 2.0 | 2.0 | - | - | - | - | - | 2.0 | 2.0 | - | 6.0 | 2.0 |
| 9A (n=1) | - | 100 | - | - | - | - | - | - | - | - | - | - | - | 100 | - | - | - | 100 |
| 9N (n=46) | - | 2.2 | - | - | - | - | - | - | - | - | - | - | - | 4.3 | - | - | 4.3 | - |
| 9V (n=4) | - | 100 | - | 25.0 | - | - | 50.0 | 75.0 | - | - | - | - | - | 25.0 | - | - | - | 100 |
| 10A (n=31) | - | 6.5 | - | - | - | - | - | - | - | - | - | - | - | 22.6 | 6.5 | - | 3.2 | 9.7 |
| 10F (n=1) | - | - | - | - | - | - | - | - | - | - | - | - | - | - | - | - | - | 100 |
| 11A (n=47) | - | 2.1 | - | - | - | - | - | - | - | - | - | 2.1 | - | 12.8 | - | - | - | 10.6 |
| 12A (n=1) | - | - | - | - | - | - | - | - | - | - | - | - | - | 100 | - | - | 100 | - |
| 12F (n=53) | - | - | - | - | - | - | - | - | - | - | - | - | - | 81.1 | 1.9 | - | 5.7 | - |
| 13 (n=1) | - | - | - | - | - | - | - | - | - | - | - | - | - | - | - | - | - | - |
| 14 (n=3) | - | 33.3 | - | 33.3 | - | - | 33.3 | 33.3 | - | - | 33.3 | 33.3 | 33.3 | 66.7 | - | - | 33.3 | - |
| 15A (n=22) | - | 40.9 | - | - | - | - | - | 9.1 | - | - | - | - | - | 77.3 | 31.8 | - | 72.7 | - |
| 15B (n=19) | - | - | - | - | - | - | - | - | - | - | - | - | - | 10.5 | - | - | 5.3 | 5.3 |
| 15C (n=12) | - | 16.7 | - | - | - | - | - | - | - | - | - | - | - | 16.7 | - | - | - | - |
| 16F (n=22) | - | - | - | - | - | - | - | - | - | - | - | - | - | - | - | - | - | - |
| 17F (n=10) | - | 10.0 | - | - | - | - | - | - | - | - | - | - | - | 10.0 | 10.0 | - | 10.0 | - |
| 18A (n=1) | - | - | - | - | - | - | - | - | - | - | - | - | - | - | - | - | - | - |
| 18C (n=4) | - | - | - | - | - | - | - | - | - | - | - | - | - | - | - | - | - | 25.0 |
| 19A(n=114) | 6.1 | 28.9 | - | 22.8 | 4.4 | 0.9 | 24.6 | 26.3 | 0.9 | 20.2 | 21.1 | - | - | 59.6 | 26.3 | - | 33.3 | 27.2 |
| 19F (n=13) | - | 38.5 | - | 23.1 | 7.7 | - | 15.4 | 23.1 | - | 7.7 | 15.4 | - | - | 23.1 | 23.1 | - | 23.1 | 23.1 |
| 20 (n=12) | - | - | - | - | - | - | - | - | - | - | - | - | - | 8.3 | - | - | - | - |
| 21 (n=10) | - | - | - | - | - | - | - | - | - | - | - | - | - | - | - | - | - | 20.0 |
| 22F(n=118) | - | 0.8 | 0.8 | 0.8 | 0.8 | - | 0.8 | 0.8 | - | - | - | - | - | 28.0 | - | 0.8 | - | - |
| 23A (n=30) | - | 30.0 | - | - | - | - | - | - | - | - | - | - | - | 3.3 | - | 3.3 | 16.7 | 3.3 |
| 23B (n=21) | - | 38.1 | - | - | - | - | - | - | - | - | - | - | - | 4.8 | - | - | 4.8 | 4.8 |
| 23F (n=4) | - | 50.0 | - | 25.0 | - | - | 25.0 | 25.0 | - | - | - | 75.0 | - | 50.0 | 25.0 | 25.0 | 25.0 | 25.0 |
| 24B (n=1) | - | - | - | - | - | - | - | - | - | - | - | - | - | - | - | - | - | - |
| 24F (n=1) | - | - | - | - | - | - | - | - | - | - | - | - | - | - | - | - | - | - |
| 28A (n=5) | - | - | - | - | - | - | - | - | - | - | - | - | - | 20.0 | - | 40.0 | 40.0 | 20.0 |
| 29 (n=3) | - | - | - | - | - | - | - | - | - | - | - | - | - | - | - | - | - | - |
| 31 (n=11) | - | - | - | - | - | - | - | - | - | - | - | - | - | - | - | - | - | - |
| 33F (n=49) | - | 2.0 | - | - | - | - | - | - | - | - | - | - | - | 81.6 | 16.3 | - | 10.2 | 10.2 |
| 34 (n=5) | - | - | - | - | - | - | - | - | - | - | - | - | - | - | - | - | - | - |
| 35A (n=2) | - | - | - | - | - | - | - | - | - | - | - | - | - | 50.0 | - | - | 50.0 | 50.0 |
| 35B (n=28) | - | 25.0 | - | 3.6 | - | - | 7.1 | 21.4 | - | - | 3.6 | - | - | 14.3 | - | - | - | 3.6 |
| 35F (n=24) | - | - | - | - | - | - | - | - | - | - | - | - | - | 4.2 | - | - | - | - |
| 37 (n=3) | - | - | - | - | - | - | - | - | - | - | - | - | - | - | - | - | - | - |
| 38 (n=14) | - | 7.1 | - | - | - | - | - | - | - | - | - | - | - | 6.7 | 6.7 | - | 6.7 | - |
| NT (n=3) | - | - | - | - | - | - | - | - | - | - | - | - | - | - | - | - | - | - |
| All (n=1061) | 0.7 | 10.0 | 0.1 | 3.4 | 0.7 | 0.1 | 3.6 | 4.7 | 0.1 | 2.3 | 2.6 | 0.6 | 0.1 | 24.8 | 5.8 | 1.0 | 9.9 | 7.4 |
Figure 40. Clarithromycin resistance of S. pneumoniae serotypes collected 2011 - 2013
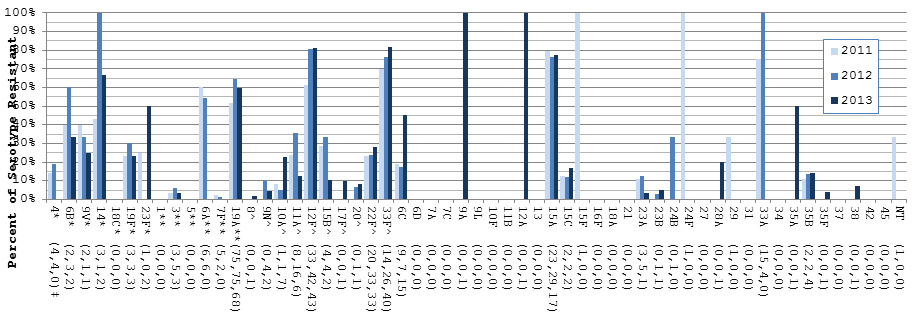
*Component of PCV7; ** Component of PCV13; ^ Component of PPV23; ‡ Number of isolates for 2010, 2011, 2012 and 2013, respectively.
Clarithromycin resistance of S. pneumoniae serotypes collected 2011 - 2013 - Text Description
This figure represents the percentage of isolates resistant to clarithromycin by vaccine type, serotype and year from 2011 to 2013
| Serotype | 2011 | 2012 | 2013 |
|---|---|---|---|
| 4* (4,4,0)‡ | 14.3% | 19.0% | 0.0% |
| 6B* (2,3,2) | 40.0% | 60.0% | 33.3% |
| 9V* (2,1,1) | 40.0% | 33.3% | 25.0% |
| 14* (3,1,2) | 42.9% | 100.0% | 66.7% |
| 18C* (0,0,0) | 0.0% | 0.0% | 0.0% |
| 19F* (3,3,3) | 23.1% | 30.0% | 23.1% |
| 23F* (1,0,2) | 25.0% | 0.0% | 50.0% |
| 1** (0,0,0) | 0.0% | 0.0% | 0.0% |
| 3** (3,5,3) | 3.3% | 6.0% | 3.7% |
| 5** (0,0,0) | 0.0% | 0.0% | 0.0% |
| 6A** (6,6,0) | 60.0% | 54.5% | 0.0% |
| 7F** (5,2,0) | 2.2% | 1.1% | 0.0% |
| 19A**(75,75,68) | 51.7% | 64.7% | 59.6% |
| 8^ (0,0,1) | 0.0% | 0.0% | 2.0% |
| 9N^ (0,4,2) | 0.0% | 9.8% | 4.3% |
| 10A^ (1,1,7) | 8.3% | 5.3% | 22.6% |
| 11A^ (8,16,6) | 23.5% | 35.6% | 12.8% |
| 12F^ (33,42,43) | 61.1% | 80.8% | 81.1% |
| 15B^ (4,4,2) | 28.6% | 33.3% | 10.5% |
| 17F^ (0,0,1) | 0.0% | 0.0% | 10.0% |
| 20^ (0,1,1) | 0.0% | 6.7% | 8.3% |
| 22F^ (20,33,33) | 23.0% | 23.7% | 28.0% |
| 33F^ (14,26,40) | 70.0% | 76.5% | 81.6% |
| 6C (9,7,15) | 19.1% | 17.5% | 45.5% |
| 6D (0,0,0) | 0.0% | 0.0% | 0.0% |
| 7A (0,0,0) | 0.0% | 0.0% | 0.0% |
| 7C (0,0,0) | 0.0% | 0.0% | 0.0% |
| 9A (0,0,1) | 0.0% | 0.0% | 100.0% |
| 9L (0,0,0) | 0.0% | 0.0% | 0.0% |
| 10F (0,0,0) | 0.0% | 0.0% | 0.0% |
| 11B (0,0,0) | 0.0% | 0.0% | 0.0% |
| 12A (0,0,1) | 0.0% | 0.0% | 100.0% |
| 13 (0,0,0) | 0.0% | 0.0% | 0.0% |
| 15A (23,29,17) | 79.3% | 76.3% | 77.3% |
| 15C (2,2,2) | 12.5% | 11.8% | 16.7% |
| 15F (1,0,0) | 100.0% | 0.0% | 0.0% |
| 16F (0,0,0) | 0.0% | 0.0% | 0.0% |
| 18A (0,0,0) | 0.0% | 0.0% | 0.0% |
| 21 (0,0,0) | 0.0% | 0.0% | 0.0% |
| 23A (3,5,1) | 11.1% | 12.5% | 3.3% |
| 23B (0,1,1) | 0.0% | 3.1% | 4.8% |
| 24B (0,1,0) | 0.0% | 33.3% | 0.0% |
| 24F (1,0,0) | 100.0% | 0.0% | 0.0% |
| 27 (0,0,0) | 0.0% | 0.0% | 0.0% |
| 28A (0,0,1) | 0.0% | 0.0% | 20.0% |
| 29 (1,0,0) | 33.3% | 0.0% | 0.0% |
| 31 (0,0,0) | 0.0% | 0.0% | 0.0% |
| 33A (15,4,0) | 75.0% | 100.0% | 0.0% |
| 34 (0,0,0) | 0.0% | 0.0% | 0.0% |
| 35A (0,0,1) | 0.0% | 0.0% | 50.0% |
| 35B (2,2,4) | 11.1% | 13.3% | 14.3% |
| 35F (0,0,1) | 0.0% | 0.0% | 4.2% |
| 37 (0,0,0) | 0.0% | 0.0% | 0.0% |
| 38 (0,0,1) | 0.0% | 0.0% | 7.1% |
| 42 (0,0,0) | 0.0% | 0.0% | 0.0% |
| 45 (0,0,0) | 0.0% | 0.0% | 0.0% |
| NT (1,0,0) | 33.3% | 0.0% | 0.0% |
| *Component of PCV7; ** Component of PCV13; ^ Component of PPV23; ‡ Number of isolates for 2010, 2011, 2012 and 2013, respectively. | |||
Figure 41. Cefuroxime (parenteral) resistance of S. pneumoniae serotypes collected 2011 – 2013

*Component of PCV7; ** Component of PCV13; ^ Component of PPV23; ‡ Number of isolates for 2010, 2011, 2012 and 2013, respectively.
Cefuroxime (parenteral) resistance of S. pneumoniae serotypes collected 2011 – 2013 - Text Description
This figure represents the percentage of isolates resistant to cefuroxime (parenteral) by vaccine type, by serotype and by year.
| Serotype | 2011 | 2012 | 2013 |
|---|---|---|---|
| 4* (0,0,0)‡ | 0.0% | 0.0% | 0.0% |
| 6B* (0,2,0) | 0.0% | 40.0% | 0.0% |
| 9V* (4,3,3) | 80.0% | 100.0% | 75.0% |
| 14* (2,1,1) | 28.6% | 100.0% | 33.3% |
| 18C* (0,0,0) | 0.0% | 0.0% | 0.0% |
| 19F* (1,1,3) | 7.7% | 10.0% | 23.1% |
| 23F* (0,0,1) | 0.0% | 0.0% | 25.0% |
| 1** (0,0,0) | 0.0% | 0.0% | 0.0% |
| 3** (0,0,0) | 0.0% | 0.0% | 0.0% |
| 5** (0,0,0) | 0.0% | 0.0% | 0.0% |
| 6A** (0,0,0) | 0.0% | 0.0% | 0.0% |
| 7F** (0,0,0) | 0.0% | 0.0% | 0.0% |
| 19A**(29,26,30) | 20.0% | 22.4% | 26.3% |
| 8^ (0,0,1) | 0.0% | 0.0% | 2.0% |
| 9N^ (0,0,0) | 0.0% | 0.0% | 0.0% |
| 10A^ (0,0,0) | 0.0% | 0.0% | 0.0% |
| 11A^ (0,0,0) | 0.0% | 0.0% | 0.0% |
| 12F^ (0,0,0) | 0.0% | 0.0% | 0.0% |
| 15B^ (1,0,0) | 7.1% | 0.0% | 0.0% |
| 17F^ (0,0,0) | 0.0% | 0.0% | 0.0% |
| 20^ (0,0,0) | 0.0% | 0.0% | 0.0% |
| 22F^ (0,0,1) | 0.0% | 0.0% | 0.8% |
| 33F^ (0,0,0) | 0.0% | 0.0% | 0.0% |
| 6C (3,3,2) | 6.4% | 7.5% | 6.1% |
| 6D (0,0,0) | 0.0% | 0.0% | 0.0% |
| 7A (0,0,0) | 0.0% | 0.0% | 0.0% |
| 7C (0,0,0) | 0.0% | 0.0% | 0.0% |
| 9A (0,0,0) | 0.0% | 0.0% | 0.0% |
| 9L (0,0,0) | 0.0% | 0.0% | 0.0% |
| 10F (0,0,0) | 0.0% | 0.0% | 0.0% |
| 11B (0,0,0) | 0.0% | 0.0% | 0.0% |
| 12A (0,0,0) | 0.0% | 0.0% | 0.0% |
| 13 (0,0,0) | 0.0% | 0.0% | 0.0% |
| 15A (2,7,2) | 6.9% | 18.4% | 9.1% |
| 15C (0,1,0) | 0.0% | 5.9% | 0.0% |
| 15F (0,0,0) | 0.0% | 0.0% | 0.0% |
| 16F (0,0,0) | 0.0% | 0.0% | 0.0% |
| 18A (0,0,0) | 0.0% | 0.0% | 0.0% |
| 21 (0,0,0) | 0.0% | 0.0% | 0.0% |
| 23A (0,0,0) | 0.0% | 0.0% | 0.0% |
| 23B (0,0,0) | 0.0% | 0.0% | 0.0% |
| 24B (0,0,0) | 0.0% | 0.0% | 0.0% |
| 24F (0,0,0) | 0.0% | 0.0% | 0.0% |
| 27 (0,0,0) | 0.0% | 0.0% | 0.0% |
| 28A (0,0,0) | 0.0% | 0.0% | 0.0% |
| 29 (2,0,0) | 66.7% | 0.0% | 0.0% |
| 31 (0,0,0) | 0.0% | 0.0% | 0.0% |
| 33A (0,0,0) | 0.0% | 0.0% | 0.0% |
| 34 (0,0,0) | 0.0% | 0.0% | 0.0% |
| 35A (0,0,0) | 0.0% | 0.0% | 0.0% |
| 35B (7,3,6) | 38.9% | 20.0% | 21.4% |
| 35F (0,0,0) | 0.0% | 0.0% | 0.0% |
| 37 (0,0,0) | 0.0% | 0.0% | 0.0% |
| 38 (0,0,0) | 0.0% | 0.0% | 0.0% |
| 42 (0,0,0) | 0.0% | 0.0% | 0.0% |
| 45 (0,0,0) | 0.0% | 0.0% | 0.0% |
| NT (0,0,0) | 0.0% | 0.0% | 0.0% |
| *Component of PCV7; ** Component of PCV13; ^ Component of PPV23; ‡ Number of isolates for 2010, 2011, 2012 and 2013, respectively. | |||
Figure 42. Clindamycin resistance of S. pneumoniae serotypes collected 2011 – 2013
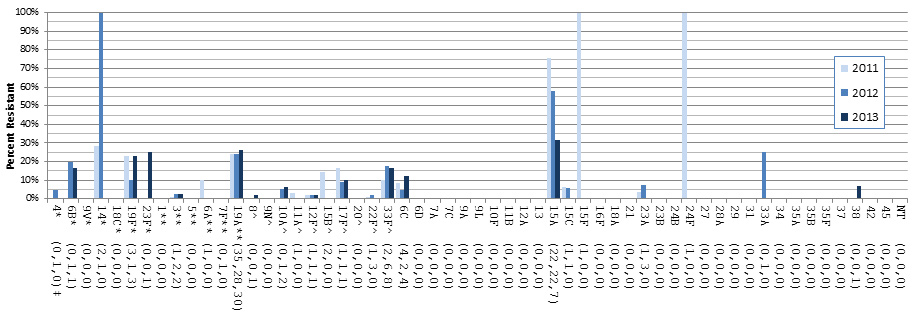
*Component of PCV7; ** Component of PCV13; ^ Component of PPV23; ‡ Number of isolates for 2010, 2011, 2012 and 2013, respectively.
Clindamycin resistance of S. pneumoniae serotypes collected 2011 – 2013 - Text Description
This figure represents the percentage of clindamycin resistant S. pneumoniae by vaccine, serotype and year from 2011 to 2013.
| Serotype | 2011 | 2012 | 2013 |
|---|---|---|---|
| 4* (0,1,0)‡ | 0.0% | 4.8% | 0.0% |
| 6B* (0,1,1) | 0.0% | 20.0% | 16.7% |
| 9V* (0,0,0) | 0.0% | 0.0% | 0.0% |
| 14* (2,1,0) | 28.6% | 100.0% | 0.0% |
| 18C* (0,0,0) | 0.0% | 0.0% | 0.0% |
| 19F* (3,1,3) | 23.1% | 10.0% | 23.1% |
| 23F* (0,0,1) | 0.0% | 0.0% | 25.0% |
| 1** (0,0,0) | 0.0% | 0.0% | 0.0% |
| 3** (1,2,2) | 1.1% | 2.4% | 2.4% |
| 5** (0,0,0) | 0.0% | 0.0% | 0.0% |
| 6A** (1,0,0) | 10.0% | 0.0% | 0.0% |
| 7F** (0,1,0) | 0.0% | 0.6% | 0.0% |
| 19A**(35,28,30) | 24.1% | 24.1% | 26.3% |
| 8^ (0,0,1) | 0.0% | 0.0% | 2.0% |
| 9N^ (0,0,0) | 0.0% | 0.0% | 0.0% |
| 10A^ (0,1,2) | 0.0% | 5.3% | 6.5% |
| 11A^ (1,0,0) | 2.9% | 0.0% | 0.0% |
| 12F^ (1,1,1) | 1.9% | 1.9% | 1.9% |
| 15B^ (2,0,0) | 14.3% | 0.0% | 0.0% |
| 17F^ (1,1,1) | 16.7% | 9.1% | 10.0% |
| 20^ (0,0,0) | 0.0% | 0.0% | 0.0% |
| 22F^ (1,3,0) | 1.1% | 2.2% | 0.0% |
| 33F^ (2,6,8) | 10.0% | 17.6% | 16.3% |
| 6C (4,2,4) | 8.5% | 5.0% | 12.1% |
| 6D (0,0,0) | 0.0% | 0.0% | 0.0% |
| 7A (0,0,0) | 0.0% | 0.0% | 0.0% |
| 7C (0,0,0) | 0.0% | 0.0% | 0.0% |
| 9A (0,0,0) | 0.0% | 0.0% | 0.0% |
| 9L (0,0,0) | 0.0% | 0.0% | 0.0% |
| 10F (0,0,0) | 0.0% | 0.0% | 0.0% |
| 11B (0,0,0) | 0.0% | 0.0% | 0.0% |
| 12A (0,0,0) | 0.0% | 0.0% | 0.0% |
| 13 (0,0,0) | 0.0% | 0.0% | 0.0% |
| 15A (22,22,7) | 75.9% | 57.9% | 31.8% |
| 15C (1,1,0) | 6.3% | 5.9% | 0.0% |
| 15F (1,0,0) | 100.0% | 0.0% | 0.0% |
| 16F (0,0,0) | 0.0% | 0.0% | 0.0% |
| 18A (0,0,0) | 0.0% | 0.0% | 0.0% |
| 21 (0,0,0) | 0.0% | 0.0% | 0.0% |
| 23A (1,3,0) | 3.7% | 7.5% | 0.0% |
| 23B (0,0,0) | 0.0% | 0.0% | 0.0% |
| 24B (0,0,0) | 0.0% | 0.0% | 0.0% |
| 24F (1,0,0) | 100.0% | 0.0% | 0.0% |
| 27 (0,0,0) | 0.0% | 0.0% | 0.0% |
| 28A (0,0,0) | 0.0% | 0.0% | 0.0% |
| 29 (0,0,0) | 0.0% | 0.0% | 0.0% |
| 31 (0,0,0) | 0.0% | 0.0% | 0.0% |
| 33A (0,1,0) | 0.0% | 25.0% | 0.0% |
| 34 (0,0,0) | 0.0% | 0.0% | 0.0% |
| 35A (0,0,0) | 0.0% | 0.0% | 0.0% |
| 35B (0,0,0) | 0.0% | 0.0% | 0.0% |
| 35F (0,0,0) | 0.0% | 0.0% | 0.0% |
| 37 (0,0,0) | 0.0% | 0.0% | 0.0% |
| 38 (0,0,1) | 0.0% | 0.0% | 7.1% |
| 42 (0,0,0) | 0.0% | 0.0% | 0.0% |
| 45 (0,0,0) | 0.0% | 0.0% | 0.0% |
| NT (0,0,0) | 0.0% | 0.0% | 0.0% |
| *Component of PCV7; ** Component of PCV13; ^ Component of PPV23; ‡ Number of isolates for 2010, 2011, 2012 and 2013, respectively. | |||
Figure 43. Doxycycline resistance of S. pneumoniae serotypes collected 2011 – 2013

*Component of PCV7; ** Component of PCV13; ^ Component of PPV23; ‡ Number of isolates for 2010, 2011, 2012 and 2013, respectively.
Doxycycline resistance of S. pneumoniae serotypes collected 2011 – 2013 - Text Description
This figure represents the percentage of doxycycline resistant S. pneumoniae by vaccine, serotype and year from 2011 to 2013.
| Serotype | 2011 | 2012 | 2013 |
|---|---|---|---|
| 4*(6,2,0)‡ | 21.4% | 9.5% | 0.0% |
| 6B* (0,2,2) | 0.0% | 40.0% | 33.3% |
| 9V* (1,1,0) | 20.0% | 33.3% | 0.0% |
| 14* (2,1,1) | 28.6% | 100.0% | 33.3% |
| 18C* (0,0,0) | 0.0% | 0.0% | 0.0% |
| 19F* (3,1,3) | 23.1% | 10.0% | 23.1% |
| 23F* (1,0,1) | 25.0% | 0.0% | 25.0% |
| 1** (0,0,0) | 0.0% | 0.0% | 0.0% |
| 3** (8,10,9) | 8.7% | 11.9% | 11.0% |
| 5** (0,0,0) | 0.0% | 0.0% | 0.0% |
| 6A** (1,0,0) | 10.0% | 0.0% | 0.0% |
| 7F** (6,4,4) | 2.6% | 2.3% | 3.6% |
| 19A**(40,35,38) | 27.6% | 30.2% | 33.3% |
| 8^ (0,3,3) | 0.0% | 7.7% | 6.0% |
| 9N^ (0,2,2) | 0.0% | 4.9% | 4.3% |
| 10A^ (0,0,1) | 0.0% | 0.0% | 3.2% |
| 11A^ (0,0,0) | 0.0% | 0.0% | 0.0% |
| 12F^ (0,2,3) | 0.0% | 3.8% | 5.7% |
| 15B^ (2,1,1) | 14.3% | 8.3% | 5.3% |
| 17F^ (0,0,1) | 0.0% | 0.0% | 10.0% |
| 20^ (0,0,0) | 0.0% | 0.0% | 0.0% |
| 22F^ (0,3,0) | 0.0% | 2.2% | 0.0% |
| 33F^ (0,3,5) | 0.0% | 8.8% | 10.2% |
| 6C (4,3,4) | 8.5% | 7.5% | 12.1% |
| 6D (0,0,0) | 0.0% | 0.0% | 0.0% |
| 7A (0,0,0) | 0.0% | 0.0% | 0.0% |
| 7C (0,1,0) | 0.0% | 33.3% | 0.0% |
| 9A (0,0,0) | 0.0% | 0.0% | 0.0% |
| 9L (0,0,0) | 0.0% | 0.0% | 0.0% |
| 10F (0,0,0) | 0.0% | 0.0% | 0.0% |
| 11B (0,0,0) | 0.0% | 0.0% | 0.0% |
| 12A (0,0,1) | 0.0% | 0.0% | 100.0% |
| 13 (0,0,0) | 0.0% | 0.0% | 0.0% |
| 15A (22,29,16) | 75.9% | 76.3% | 72.7% |
| 15C (1,1,0) | 6.3% | 5.9% | 0.0% |
| 15F (1,0,0) | 100.0% | 0.0% | 0.0% |
| 16F (0,0,0) | 0.0% | 0.0% | 0.0% |
| 18A (0,0,0) | 0.0% | 0.0% | 0.0% |
| 21 (0,0,0) | 0.0% | 0.0% | 0.0% |
| 23A (5,6,5) | 18.5% | 15.0% | 16.7% |
| 23B (0,1,1) | 0.0% | 3.1% | 4.8% |
| 24B (0,1,0) | 0.0% | 33.3% | 0.0% |
| 24F (1,0,0) | 100.0% | 0.0% | 0.0% |
| 27 (0,0,0) | 0.0% | 0.0% | 0.0% |
| 28A (0,2,2) | 0.0% | 100.0% | 40.0% |
| 29 (0,0,0) | 0.0% | 0.0% | 0.0% |
| 31 (0,0,0) | 0.0% | 0.0% | 0.0% |
| 33A (0,0,0) | 0.0% | 0.0% | 0.0% |
| 34 (0,0,0) | 0.0% | 0.0% | 0.0% |
| 35A (0,0,1) | 0.0% | 0.0% | 50.0% |
| 35B (0,1,0) | 0.0% | 6.7% | 0.0% |
| 35F (0,0,0) | 0.0% | 0.0% | 0.0% |
| 37 (0,0,0) | 0.0% | 0.0% | 0.0% |
| 38 (0,0,1) | 0.0% | 0.0% | 7.1% |
| 42 (0,0,0) | 0.0% | 0.0% | 0.0% |
| 45 (0,0,0) | 0.0% | 0.0% | 0.0% |
| NT (0,0,0) | 0.0% | 0.0% | 0.0% |
| *Component of PCV7; ** Component of PCV13; ^ Component of PPV23; ‡ Number of isolates for 2010, 2011, 2012 and 2013, respectively. | |||
Figure 44. Imipenem resistance of S. pneumoniae serotypes collected 2011 – 2013

*Component of PCV7; ** Component of PCV13; ^ Component of PPV23; ‡ Number of isolates for 2010, 2011, 2012 and 2013, respectively.
Imipenem resistance of S. pneumoniae serotypes collected 2011 – 2013 - Text Description
This figure represents the percentage of imipenem resistant S. pneumoniae by vaccine, serotype and year from 2011 to 2013.
| Serotype | 2010 | 2011 | 2012 |
|---|---|---|---|
| 4* (0,0,0)‡ | 0.0% | 0.0% | 0.0% |
| 6B* (0,0,0) | 0.0% | 0.0% | 0.0% |
| 9V* (0,0,0) | 0.0% | 0.0% | 0.0% |
| 14* (0,0,0) | 7.7% | 10.0% | 7.7% |
| 18C* (0,0,0) | 0.0% | 0.0% | 0.0% |
| 19F* (1,1,1) | 0.0% | 0.0% | 0.0% |
| 23F* (0,0,0) | 0.0% | 0.0% | 0.0% |
| 1** (0,0,0) | 0.0% | 0.0% | 0.0% |
| 3** (0,0,0) | 0.0% | 0.0% | 0.0% |
| 5** (0,0,0) | 0.0% | 0.0% | 0.0% |
| 6A** (0,0,0) | 6.9% | 16.4% | 20.2% |
| 7F** (0,0,0) | 0.0% | 0.0% | 0.0% |
| 19A**(10,19,23) | 0.0% | 0.0% | 0.0% |
| 8^ (0,0,0) | 0.0% | 0.0% | 0.0% |
| 9N^ (0,0,0) | 0.0% | 0.0% | 0.0% |
| 10A^ (0,0,0) | 0.0% | 0.0% | 0.0% |
| 11A^ (0,0,0) | 0.0% | 0.0% | 0.0% |
| 12F^ (0,0,0) | 0.0% | 0.0% | 0.0% |
| 15B^ (0,0,0) | 0.0% | 0.0% | 0.0% |
| 17F^ (0,0,0) | 0.0% | 0.0% | 0.0% |
| 20^ (0,0,0) | 0.0% | 0.0% | 0.0% |
| 22F^ (0,0,0) | 0.0% | 0.0% | 0.0% |
| 33F^ (0,0,0) | 0.0% | 0.0% | 0.0% |
| 6C (0,0,0) | 0.0% | 0.0% | 0.0% |
| 6D (0,0,0) | 0.0% | 0.0% | 0.0% |
| 7A (0,0,0) | 0.0% | 0.0% | 0.0% |
| 7C (0,0,0) | 0.0% | 0.0% | 0.0% |
| 9A (0,0,0) | 0.0% | 0.0% | 0.0% |
| 9L (0,0,0) | 0.0% | 0.0% | 0.0% |
| 10F (0,0,0) | 0.0% | 0.0% | 0.0% |
| 11B (0,0,0) | 0.0% | 0.0% | 0.0% |
| 12A (0,0,0) | 0.0% | 0.0% | 0.0% |
| 13 (0,0,0) | 0.0% | 0.0% | 0.0% |
| 15A (0,0,0) | 0.0% | 0.0% | 0.0% |
| 15C (0,0,0) | 0.0% | 0.0% | 0.0% |
| 15F (0,0,0) | 0.0% | 0.0% | 0.0% |
| 16F (0,0,0) | 0.0% | 0.0% | 0.0% |
| 18A (0,0,0) | 0.0% | 0.0% | 0.0% |
| 21 (0,0,0) | 0.0% | 0.0% | 0.0% |
| 23A (0,0,0) | 0.0% | 0.0% | 0.0% |
| 23B (0,0,0) | 0.0% | 0.0% | 0.0% |
| 24B (0,0,0) | 0.0% | 0.0% | 0.0% |
| 24F (0,0,0) | 0.0% | 0.0% | 0.0% |
| 27 (0,0,0) | 0.0% | 0.0% | 0.0% |
| 28A (0,0,0) | 0.0% | 0.0% | 0.0% |
| 29 (0,0,0) | 0.0% | 0.0% | 0.0% |
| 31 (0,0,0) | 0.0% | 0.0% | 0.0% |
| 33A (0,0,0) | 0.0% | 0.0% | 0.0% |
| 34 (0,0,0) | 0.0% | 0.0% | 0.0% |
| 35A (0,0,0) | 0.0% | 0.0% | 0.0% |
| 35B (0,0,0) | 0.0% | 0.0% | 0.0% |
| 35F (0,0,0) | 0.0% | 0.0% | 0.0% |
| 37 (0,0,0) | 0.0% | 0.0% | 0.0% |
| 38 (0,0,0) | 0.0% | 0.0% | 0.0% |
| 42 (0,0,0) | 0.0% | 0.0% | 0.0% |
| 45 (0,0,0) | 0.0% | 0.0% | 0.0% |
| NT (0,0,0) | 0.0% | 0.0% | 0.0% |
| *Component of PCV7; ** Component of PCV13; ^ Component of PPV23; ‡ Number of isolates for 2010, 2011, 2012 and 2013, respectively. | |||
Figure 45. Meropenem resistance of S. pneumoniae serotypes collected 2011 – 2013
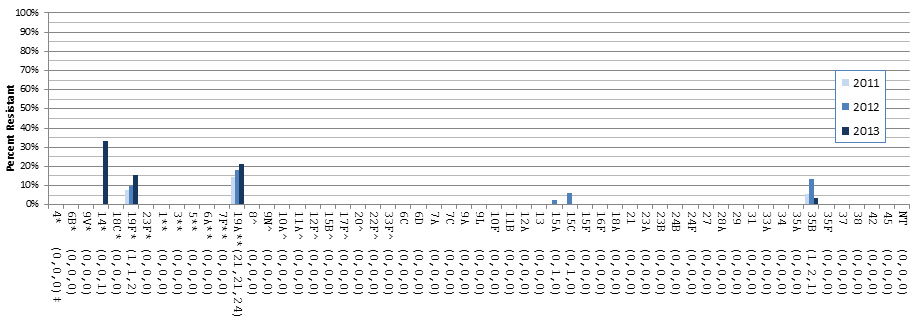
*Component of PCV7; ** Component of PCV13; ^ Component of PPV23; ‡ Number of isolates for 2010, 2011, 2012 and 2013, respectively.
Meropenem resistance of S. pneumoniae serotypes collected 2011 – 2013 - Text Description
This figure represents the percentage of meropenem resistant S. pneumoniae by vaccine, serotype and year from 2011 to 2013.
| Serotype | 2011 | 2012 | 2013 |
|---|---|---|---|
| 4* (0,0,0)‡ | 0.0% | 0.0% | 0.0% |
| 6B* (0,0,0) | 0.0% | 0.0% | 0.0% |
| 9V* (0,0,0) | 0.0% | 0.0% | 0.0% |
| 14* (0,0,1) | 0.0% | 0.0% | 33.3% |
| 18C* (0,0,0) | 0.0% | 0.0% | 0.0% |
| 19F* (1,1,2) | 7.7% | 10.0% | 15.4% |
| 23F* (0,0,0) | 0.0% | 0.0% | 0.0% |
| 1** (0,0,0) | 0.0% | 0.0% | 0.0% |
| 3** (0,0,0) | 0.0% | 0.0% | 0.0% |
| 5** (0,0,0) | 0.0% | 0.0% | 0.0% |
| 6A** (0,0,0) | 0.0% | 0.0% | 0.0% |
| 7F** (0,0,0) | 0.0% | 0.0% | 0.0% |
| 19A**(21,21,24) | 14.5% | 18.1% | 21.1% |
| 8^ (0,0,0) | 0.0% | 0.0% | 0.0% |
| 9N^ (0,0,0) | 0.0% | 0.0% | 0.0% |
| 10A^ (0,0,0) | 0.0% | 0.0% | 0.0% |
| 11A^ (0,0,0) | 0.0% | 0.0% | 0.0% |
| 12F^ (0,0,0) | 0.0% | 0.0% | 0.0% |
| 15B^ (0,0,0) | 0.0% | 0.0% | 0.0% |
| 17F^ (0,0,0) | 0.0% | 0.0% | 0.0% |
| 20^ (0,0,0) | 0.0% | 0.0% | 0.0% |
| 22F^ (0,0,0) | 0.0% | 0.0% | 0.0% |
| 33F^ (0,0,0) | 0.0% | 0.0% | 0.0% |
| 6C (0,0,0) | 0.0% | 0.0% | 0.0% |
| 6D (0,0,0) | 0.0% | 0.0% | 0.0% |
| 7A (0,0,0) | 0.0% | 0.0% | 0.0% |
| 7C (0,0,0) | 0.0% | 0.0% | 0.0% |
| 9A (0,0,0) | 0.0% | 0.0% | 0.0% |
| 9L (0,0,0) | 0.0% | 0.0% | 0.0% |
| 10F (0,0,0) | 0.0% | 0.0% | 0.0% |
| 11B (0,0,0) | 0.0% | 0.0% | 0.0% |
| 12A (0,0,0) | 0.0% | 0.0% | 0.0% |
| 13 (0,0,0) | 0.0% | 0.0% | 0.0% |
| 15A (0,1,0) | 0.0% | 2.6% | 0.0% |
| 15C (0,1,0) | 0.0% | 5.9% | 0.0% |
| 15F (0,0,0) | 0.0% | 0.0% | 0.0% |
| 16F (0,0,0) | 0.0% | 0.0% | 0.0% |
| 18A (0,0,0) | 0.0% | 0.0% | 0.0% |
| 21 (0,0,0) | 0.0% | 0.0% | 0.0% |
| 23A (0,0,0) | 0.0% | 0.0% | 0.0% |
| 23B (0,0,0) | 0.0% | 0.0% | 0.0% |
| 24B (0,0,0) | 0.0% | 0.0% | 0.0% |
| 24F (0,0,0) | 0.0% | 0.0% | 0.0% |
| 27 (0,0,0) | 0.0% | 0.0% | 0.0% |
| 28A (0,0,0) | 0.0% | 0.0% | 0.0% |
| 29 (0,0,0) | 0.0% | 0.0% | 0.0% |
| 31 (0,0,0) | 0.0% | 0.0% | 0.0% |
| 33A (0,0,0) | 0.0% | 0.0% | 0.0% |
| 34 (0,0,0) | 0.0% | 0.0% | 0.0% |
| 35A (0,0,0) | 0.0% | 0.0% | 0.0% |
| 35B (1,2,1) | 5.6% | 13.3% | 3.6% |
| 35F (0,0,0) | 0.0% | 0.0% | 0.0% |
| 37 (0,0,0) | 0.0% | 0.0% | 0.0% |
| 38 (0,0,0) | 0.0% | 0.0% | 0.0% |
| 42 (0,0,0) | 0.0% | 0.0% | 0.0% |
| 45 (0,0,0) | 0.0% | 0.0% | 0.0% |
| NT (0,0,0) | 0.0% | 0.0% | 0.0% |
| *Component of PCV7; ** Component of PCV13; ^ Component of PPV23; ‡ Number of isolates for 2010, 2011, 2012 and 2013, respectively. | |||
Figure 46. Penicillin resistance (meningitis breakpoints) of S. pneumoniae serotypes collected 2011 – 2013

*Component of PCV7; ** Component of PCV13; ^ Component of PPV23; ‡ Number of isolates for 2010, 2011, 2012 and 2013, respectively.
Penicillin resistance (meningitis breakpoints) of S. pneumoniae serotypes collected 2011 – 2013 - Text Description
This figure represents the percentage of penicillin resistant S. pneumoniae by vaccine, serotype and year from 2011 to 2013.
| Serotype | 2011 | 2012 | 2013 |
|---|---|---|---|
| 4* (1,1,0)‡ | 3.6% | 4.8% | 0.0% |
| 6B* (2,3,1) | 40.0% | 60.0% | 16.7% |
| 9V* (5,3,4) | 100.0% | 100.0% | 100.0% |
| 14* (2,1,1) | 28.6% | 100.0% | 33.3% |
| 18C* (0,0,0) | 0.0% | 0.0% | 0.0% |
| 19F* (2,1,5) | 15.4% | 10.0% | 38.5% |
| 23F* (1,0,2) | 25.0% | 0.0% | 50.0% |
| 1** (0,0,0) | 0.0% | 0.0% | 0.0% |
| 3** (0,0,1) | 0.0% | 0.0% | 1.2% |
| 5** (0,0,0) | 0.0% | 0.0% | 0.0% |
| 6A** (4,8,3) | 40.0% | 72.7% | 60.0% |
| 7F** (1,2,0) | 0.4% | 1.1% | 0.0% |
| 19A**(53,40,33) | 36.6% | 34.5% | 28.9% |
| 8^ (0,1,1) | 0.0% | 2.6% | 2.0% |
| 9N^ (0,0,1) | 0.0% | 0.0% | 2.2% |
| 10A^ (0,0,2) | 0.0% | 0.0% | 6.5% |
| 11A^ (0,0,1) | 0.0% | 0.0% | 2.1% |
| 12F^ (0,0,0) | 0.0% | 0.0% | 0.0% |
| 15B^ (2,0,0) | 14.3% | 0.0% | 0.0% |
| 17F^ (0,0,1) | 0.0% | 0.0% | 10.0% |
| 20^ (0,0,0) | 0.0% | 0.0% | 0.0% |
| 22F^ (0,1,1) | 0.0% | 0.7% | 0.8% |
| 33F^ (0,0,1) | 0.0% | 0.0% | 2.0% |
| 6C (8,9,11) | 17.0% | 22.5% | 33.3% |
| 6D (0,0,0) | 0.0% | 0.0% | 0.0% |
| 7A (0,0,0) | 0.0% | 0.0% | 0.0% |
| 7C (0,0,0) | 0.0% | 0.0% | 0.0% |
| 9A (0,0,1) | 0.0% | 0.0% | 100.0% |
| 9L (0,0,0) | 0.0% | 0.0% | 0.0% |
| 10F (0,0,0) | 0.0% | 0.0% | 0.0% |
| 11B (0,0,0) | 0.0% | 0.0% | 0.0% |
| 12A (0,0,0) | 0.0% | 0.0% | 0.0% |
| 13 (0,0,0) | 0.0% | 0.0% | 0.0% |
| 15A (23,20,9) | 79.3% | 52.6% | 40.9% |
| 15C (1,2,2) | 6.3% | 11.8% | 16.7% |
| 15F (1,0,0) | 100.0% | 0.0% | 0.0% |
| 16F (0,1,0) | 0.0% | 4.5% | 0.0% |
| 18A (0,0,0) | 0.0% | 0.0% | 0.0% |
| 21 (0,0,0) | 0.0% | 0.0% | 0.0% |
| 23A (10,9,9) | 37.0% | 22.5% | 30.0% |
| 23B (8,17,8) | 38.1% | 53.1% | 38.1% |
| 24B (0,1,0) | 0.0% | 33.3% | 0.0% |
| 24F (1,0,0) | 100.0% | 0.0% | 0.0% |
| 27 (0,0,0) | 0.0% | 0.0% | 0.0% |
| 28A (0,0,0) | 0.0% | 0.0% | 0.0% |
| 29 (2,0,0) | 66.7% | 0.0% | 0.0% |
| 31 (0,0,0) | 0.0% | 0.0% | 0.0% |
| 33A (0,0,0) | 0.0% | 0.0% | 0.0% |
| 34 (0,0,0) | 0.0% | 0.0% | 0.0% |
| 35A (0,0,0) | 0.0% | 0.0% | 0.0% |
| 35B (7,3,7) | 38.9% | 20.0% | 25.0% |
| 35F (0,0,0) | 0.0% | 0.0% | 0.0% |
| 37 (0,0,0) | 0.0% | 0.0% | 0.0% |
| 38 (0,0,1) | 0.0% | 0.0% | 7.1% |
| 42 (0,0,0) | 0.0% | 0.0% | 0.0% |
| 45 (1,0,0) | 100.0% | 0.0% | 0.0% |
| NT (0,0,0) | 0.0% | 0.0% | 0.0% |
| *Component of PCV7; ** Component of PCV13; ^ Component of PPV23; ‡ Number of isolates for 2010, 2011, 2012 and 2013, respectively. | |||
Figure 47. Trimethoprim/Sulfamethoxazole resistance of S. pneumoniae serotypes collected 2011 – 2013
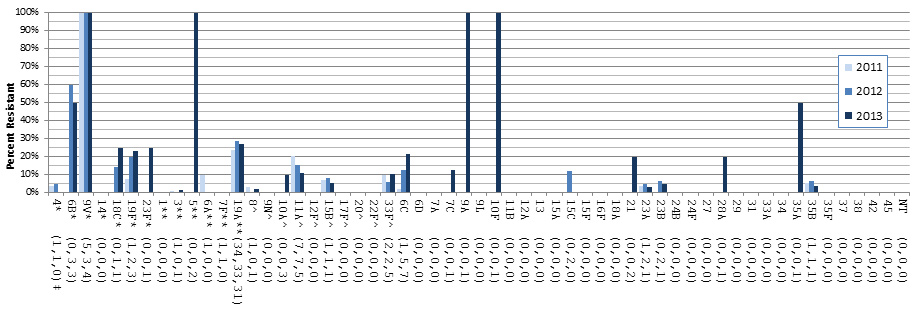
*Component of PCV7; ** Component of PCV13; ^ Component of PPV23; ‡ Number of isolates for 2010, 2011, 2012 and 2013, respectively.
Trimethoprim/Sulfamethoxazole resistance of S. pneumoniae serotypes collected 2011 – 2013 - Text Description
This figure represents the percentage of trimethoprim/sulfamethoxazole resistant S. pneumoniae by vaccine, serotype and year from 2011 to 2013.
| Serotype | 2011 | 2012 | 2013 |
|---|---|---|---|
| 4* (1,1,0)‡ | 3.6% | 4.8% | 0.0% |
| 6B* (0,3,3) | 0.0% | 60.0% | 50.0% |
| 9V* (5,3,4) | 100.0% | 100.0% | 100.0% |
| 14* (0,0,0) | 0.0% | 0.0% | 0.0% |
| 18C* (0,1,1) | 0.0% | 14.3% | 25.0% |
| 19F* (1,2,3) | 7.7% | 20.0% | 23.1% |
| 23F* (0,0,1) | 0.0% | 0.0% | 25.0% |
| 1** (0,0,0) | 0.0% | 0.0% | 0.0% |
| 3** (1,0,1) | 1.1% | 0.0% | 1.2% |
| 5** (0,0,2) | 0.0% | 0.0% | 100.0% |
| 6A** (1,0,0) | 10.0% | 0.0% | 0.0% |
| 7F** (1,1,0) | 0.4% | 0.6% | 0.0% |
| 19A**(34,33,31) | 23.4% | 28.4% | 27.2% |
| 8^ (1,0,1) | 3.2% | 0.0% | 2.0% |
| 9N^ (0,0,0) | 0.0% | 0.0% | 0.0% |
| 10A^ (0,0,3) | 0.0% | 0.0% | 9.7% |
| 11A^ (7,7,5) | 20.6% | 15.6% | 10.6% |
| 12F^ (0,0,0) | 0.0% | 0.0% | 0.0% |
| 15B^ (1,1,1) | 7.1% | 8.3% | 5.3% |
| 17F^ (0,0,0) | 0.0% | 0.0% | 0.0% |
| 20^ (0,0,0) | 0.0% | 0.0% | 0.0% |
| 22F^ (0,0,0) | 0.0% | 0.0% | 0.0% |
| 33F^ (2,2,5) | 10.0% | 5.9% | 10.2% |
| 6C (1,5,7) | 2.1% | 12.5% | 21.2% |
| 6D (0,0,0) | 0.0% | 0.0% | 0.0% |
| 7A (0,0,0) | 0.0% | 0.0% | 0.0% |
| 7C (0,0,1) | 0.0% | 0.0% | 12.5% |
| 9A (0,0,1) | 0.0% | 0.0% | 100.0% |
| 9L (0,0,0) | 0.0% | 0.0% | 0.0% |
| 10F (0,0,1) | 0.0% | 0.0% | 100.0% |
| 11B (0,0,0) | 0.0% | 0.0% | 0.0% |
| 12A (0,0,0) | 0.0% | 0.0% | 0.0% |
| 13 (0,0,0) | 0.0% | 0.0% | 0.0% |
| 15A (0,0,0) | 0.0% | 0.0% | 0.0% |
| 15C (0,2,0) | 0.0% | 11.8% | 0.0% |
| 15F (0,0,0) | 0.0% | 0.0% | 0.0% |
| 16F (0,0,0) | 0.0% | 0.0% | 0.0% |
| 18A (0,0,0) | 0.0% | 0.0% | 0.0% |
| 21 (0,0,2) | 0.0% | 0.0% | 20.0% |
| 23A (1,2,1) | 3.7% | 5.0% | 3.3% |
| 23B (0,2,1) | 0.0% | 6.3% | 4.8% |
| 24B (0,0,0) | 0.0% | 0.0% | 0.0% |
| 24F (0,0,0) | 0.0% | 0.0% | 0.0% |
| 27 (0,0,0) | 0.0% | 0.0% | 0.0% |
| 28A (0,0,1) | 0.0% | 0.0% | 20.0% |
| 29 (0,0,0) | 0.0% | 0.0% | 0.0% |
| 31 (0,0,0) | 0.0% | 0.0% | 0.0% |
| 33A (0,0,0) | 0.0% | 0.0% | 0.0% |
| 34 (0,0,0) | 0.0% | 0.0% | 0.0% |
| 35A (0,0,1) | 0.0% | 0.0% | 50.0% |
| 35B (1,1,1) | 5.6% | 6.7% | 3.6% |
| 35F (0,0,0) | 0.0% | 0.0% | 0.0% |
| 37 (0,0,0) | 0.0% | 0.0% | 0.0% |
| 38 (0,0,0) | 0.0% | 0.0% | 0.0% |
| 42 (0,0,0) | 0.0% | 0.0% | 0.0% |
| 45 (0,0,0) | 0.0% | 0.0% | 0.0% |
| NT (0,0,0) | 0.0% | 0.0% | 0.0% |
| *Component of PCV7; ** Component of PCV13; ^ Component of PPV23; ‡ Number of isolates for 2010, 2011, 2012 and 2013, respectively. | |||
Streptococcus pyogenes (Group A Streptococcus)
Of the 1,294 Streptococcus pyogenes isolates tested at the NML by emm typing, 155 (12.0%) were isolated from children <15 years of age; 1096 (84.7%) from adults ≥15 years of age; and no age was available for 43 isolates. Gender information was available for 1269 isolates, of which 54.2% (n=688) were from male patients.
No major differences were observed in the relative proportions of clinical isolation sites between adults and children other than slightly more CSF and pleural fluid isolations sites observed among child isolates (2.6%, n=4 and 6.5%, n=10; respectively) than in the adults (0.2%, n=2 and 1.5%, n=16; respectively) (Figures 48, 49).
The most prevalent emm type in Canada during 2013 continues to be emm1 accounting for 28.4% (n=44) of isolates collected from children <15 years of age and 23.7% (n=260) of isolates from those ≥ 15 years of age (Figure 50, 51). emm89 is next most prevalent accounting for 7.1% (n=11) of child isolates and 9.9% (n=108) of adult isolates. The majority of emm68 (n=46), emm53 (n=32), emm80 (n=28), emm77 (n=14), emm22 (n=12) and emm41 (n=6) isolates were from Western Canada, whereas the majority of emm89 (n=90), emm4 (n=54), emm28 (n=54), emm12 (n=49), emm59 (n=33) and emm2 (n=277) isolates were from Central regions (Figure 52).
Among isolates from children, adults and unknown ages (n=887), emm1 and emm89 represented comparatively greater proportions of blood (26.6%, n=236 and 9.1%, n=81; respectively) than of synovial fluid isolates (10.2%, n=10 and 6.1%, n=6; respectively). Conversely, proportions of emm68 and emm82 were greater in synovial fluid (7.1%, n=7 and 8.2%, n=8; respectively) than in blood isolates (3.0%, n=27 and 1.2%, n=11, respectively) (Figure 53).
| Province | < 2 | 2 – 4 | 5 – 14 | 15 – 49 | 50 – 64 | ≥ 65 | Not Given | Total |
|---|---|---|---|---|---|---|---|---|
| British Columbia | 3 | 2 | 9 | 61 | 23 | 43 | 1 | 142 |
| Alberta | - | - | - | - | - | 1 | - | 1 |
| Saskatchewan | 5 | 1 | 5 | 43 | 22 | 17 | 2 | 95 |
| Manitoba | 11 | 2 | 7 | 75 | 47 | 16 | 12 | 170 |
| Ontario | 27 | 6 | 26 | 167 | 115 | 158 | 19 | 518 |
| Québec | 10 | 8 | 30 | 121 | 51 | 91 | 8 | 319 |
| New Brunswick | - | - | 1 | 7 | 1 | 8 | - | 17 |
| Nova Scotia | - | - | - | 5 | 3 | 4 | - | 12 |
| Prince Edward Island | - | - | - | - | 1 | - | 1 | 2 |
| Newfoundland and Labrador | - | - | 2 | 3 | 6 | 1 | - | 12 |
| Yukon Territories | - | - | - | 1 | 1 | - | - | 2 |
| Northwest Territories | - | - | - | 2 | 1 | 1 | - | 4 |
| Canada | 56 | 19 | 80 | 485 | 271 | 340 | 43 | 1294 |
Figure 48. Clinical isolation sites of S. pyogenes from children <15 years of age (N=155)
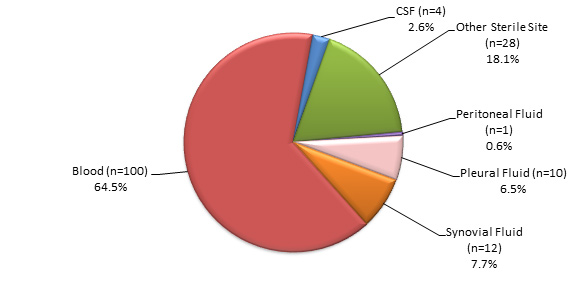
Other sterile sites include: deep tissue, biopsy and surgical samples, bone, mastoid and any clinical sources associated with necrotizing fasciitis. Patient age was not available for 43 isolates.
Clinical isolation sites of S. pyogenes from children <15 years of age (N=155) - Text Description
This figure represents the percentage of S. pyogenes isolates from various clinical isolation sites in children under 15 years of age.
| Clinical Isolation site | Percentage |
|---|---|
| Blood (n=100) | 64.5% |
| CSF (n=4) | 2.6% |
| Other Sterile Site (n=28) | 18.1% |
| Peritoneal Fluid (n=1) | 0.6% |
| Pleural Fluid (n=10) | 6.5% |
| Synovial Fluid (n=12) | 7.7% |
Other sterile sites include: deep tissue, biopsy and surgical samples, bone, mastoid and any clinical sources associated with necrotizing fasciitis. Patient age was not available for 43 isolates.
Figure 49. Clinical isolation sites of S. pyogenes from adults ≥ 15 years of age (N=1096)
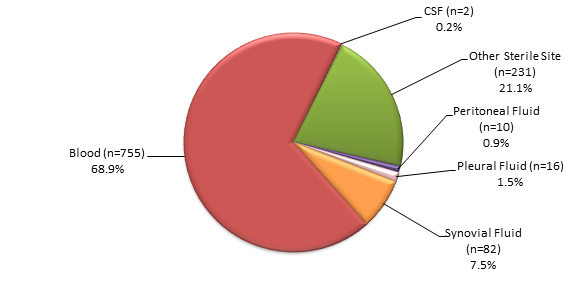
Other sterile sites include: deep tissue, biopsy and surgical samples, bone, mastoid and any clinical sources associated with necrotizing fasciitis. Patient age was not available for 43 isolates
Clinical isolation sites of S. pyogenes from adults ≥ 15 years of age (N=1096) - Text Description
This figure represents the percentage of S. pyogenes from various clinical isolation sites from adults (over the age of 14 years).
| Clinical Isolation site | Percentage |
|---|---|
| Blood (n=755) | 68.9% |
| CSF (n=2) | 0.2% |
| Other Sterile Site (n=231) | 21.1% |
| Peritoneal Fluid (n=10) | 0.9% |
| Pleural Fluid (n=16) | 1.5% |
| Synovial Fluid (n=82) | 7.5% |
Other sterile sites include: deep tissue, biopsy and surgical samples, bone, mastoid and any clinical sources associated with necrotizing fasciitis. Patient age was not available for 43 isolates
Figure 50. Invasive S. pyogenes emm types in children <15 years of age, 2010 – 2013
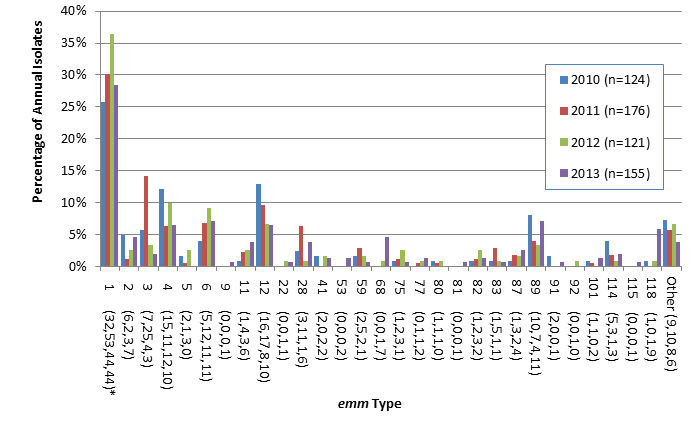
* Number of isolates in 2010, 2011, 2012, and 2013, respectively.
Invasive S. pyogenes emm types in children <15 years of age, 2010 – 2013 - Text Description
This figure represents the number of invasive S. pyogenes emm types found in children less than 15 years of age by year from 2010 to 2013.
| emm | 2010 (n=124) | 2011 (n=176) | 2012 (n=121) | 2013 (n=155) |
|---|---|---|---|---|
| 1 (32,53,44,44)Footnote * | 25.80% | 30.10% | 36.40% | 28.40% |
| 2 (6,2,3,7) | 4.80% | 1.10% | 2.50% | 4.50% |
| 3 (7,25,4,3) | 5.60% | 14.20% | 3.30% | 1.90% |
| 4 (15,11,12,10) | 12.10% | 6.30% | 9.90% | 6.50% |
| 5 (2,1,3,0) | 1.60% | 0.60% | 2.50% | 0.00% |
| 6 (5,12,11,11) | 4.00% | 6.80% | 9.10% | 7.10% |
| 9 (0,0,0,1) | 0.00% | 0.00% | 0.00% | 0.60% |
| 11 (1,4,3,6) | 0.80% | 2.30% | 2.50% | 3.90% |
| 12 (16,17,8,10) | 12.90% | 9.70% | 6.60% | 6.50% |
| 22 (0,0,1,1) | 0.00% | 0.00% | 0.80% | 0.60% |
| 28 (3,11,1,6) | 2.40% | 6.30% | 0.80% | 3.90% |
| 41 (2,0,2,2) | 1.60% | 0.00% | 1.70% | 1.30% |
| 53 (0,0,0,2) | 0.00% | 0.00% | 0.00% | 1.30% |
| 59 (2,5,2,1) | 1.60% | 2.80% | 1.70% | 0.60% |
| 68 (0,0,1,7) | 0.00% | 0.00% | 0.80% | 4.50% |
| 75 (1,2,3,1) | 0.80% | 1.10% | 2.50% | 0.60% |
| 77 (0,1,1,2) | 0.00% | 0.60% | 0.80% | 1.30% |
| 80 (1,1,1,0) | 0.80% | 0.60% | 0.80% | 0.00% |
| 81 (0,0,0,1) | 0.00% | 0.00% | 0.00% | 0.60% |
| 82 (1,2,3,2) | 0.80% | 1.10% | 2.50% | 1.30% |
| 83 (1,5,1,1) | 0.80% | 2.80% | 0.80% | 0.60% |
| 87 (1,3,2,4) | 0.80% | 1.70% | 1.70% | 2.60% |
| 89 (10,7,4,11) | 8.10% | 4.00% | 3.30% | 7.10% |
| 91 (2,0,0,1) | 1.60% | 0.00% | 0.00% | 0.60% |
| 92 (0,0,1,0) | 0.00% | 0.00% | 0.80% | 0.00% |
| 101 (1,1,0,2) | 0.80% | 0.60% | 0.00% | 1.30% |
| 114 (5,3,1,3) | 4.00% | 1.70% | 0.80% | 1.90% |
| 115 (0,0,0,1) | 0.00% | 0.00% | 0.00% | 0.60% |
| 118 (1,0,1,9) | 0.80% | 0.00% | 0.80% | 5.80% |
| Other (9,10,8,6) | 7.30% | 5.70% | 6.60% | 3.90% |
Figure 51. Invasive S. pyogenes emm types in adults ≥ 15 years of age, 2010 – 2013
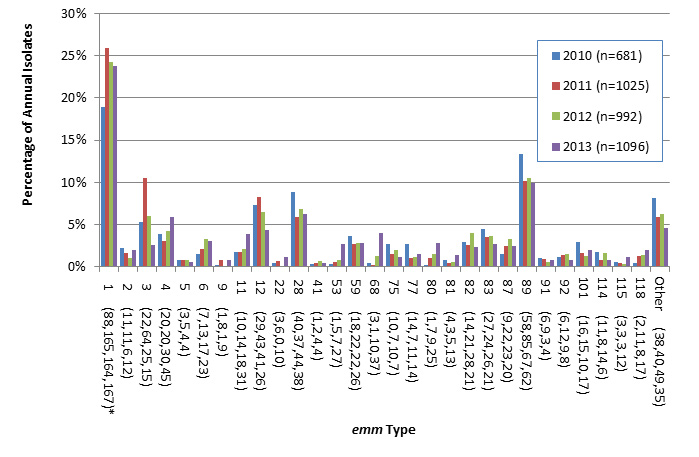
* Number of isolates in 2010, 2011, 2012, and 2013, respectively.
Invasive S. pyogenes emm types in adults ≥ 15 years of age, 2010 – 2013 - Text Description
This figure represents the number of invasive S. pyogenes emm types found in adults over 14 years of age by year from 2010 to 2013.
| emm | 2010 (n=681) | 2011 (n=1025) | 2012 (n=992) | 2013 (n=1096) |
|---|---|---|---|---|
| 1 (88,165,164,167)Footnote * | 18.90% | 26.00% | 24.20% | 23.70% |
| 2 (11,11,6,12) | 2.20% | 1.70% | 1.00% | 2.00% |
| 3 (22,64,25,15) | 5.30% | 10.50% | 5.90% | 2.60% |
| 4 (20,20,30,45) | 3.80% | 3.00% | 4.20% | 5.90% |
| 5 (3,5,4,4) | 0.70% | 0.80% | 0.80% | 0.50% |
| 6 (7,13,17,23) | 1.50% | 2.00% | 3.20% | 3.00% |
| 9 (1,8,1,9) | 0.10% | 0.80% | 0.10% | 0.80% |
| 11 (10,14,18,31) | 1.80% | 1.80% | 2.10% | 3.90% |
| 12 (29,43,41,26) | 7.30% | 8.30% | 6.50% | 4.30% |
| 22 (3,6,0,10) | 0.40% | 0.70% | 0.00% | 1.10% |
| 28 (40,37,44,38) | 8.80% | 5.90% | 6.90% | 6.30% |
| 41 (1,2,4,4) | 0.30% | 0.40% | 0.70% | 0.50% |
| 53 (1,5,7,27) | 0.30% | 0.60% | 0.80% | 2.60% |
| 59 (18,22,22,26) | 3.70% | 2.70% | 2.80% | 2.80% |
| 68 (3,1,10,37) | 0.40% | 0.20% | 1.20% | 4.00% |
| 75 (10,7,10,7) | 2.60% | 1.50% | 2.00% | 1.10% |
| 77 (14,7,11,14) | 2.60% | 1.10% | 1.10% | 1.50% |
| 80 (1,7,9,25) | 0.10% | 1.00% | 1.50% | 2.80% |
| 81 (4,3,5,13) | 0.70% | 0.40% | 0.50% | 1.40% |
| 82 (14,21,28,21) | 2.90% | 2.50% | 4.00% | 2.30% |
| 83 (27,24,26,21) | 4.40% | 3.50% | 3.60% | 2.60% |
| 87 (9,22,23,20) | 1.50% | 2.40% | 3.30% | 2.50% |
| 89 (58,85,67,62) | 13.40% | 10.10% | 10.50% | 9.90% |
| 91 (6,9,3,4) | 1.00% | 0.90% | 0.50% | 0.70% |
| 92 (6,12,9,8) | 1.20% | 1.40% | 1.50% | 0.70% |
| 101 (16,15,10,17) | 2.90% | 1.70% | 1.30% | 2.00% |
| 114 (11,8,14,6) | 1.80% | 0.80% | 1.60% | 0.80% |
| 115 (3,3,3,12) | 0.60% | 0.40% | 0.30% | 1.10% |
| 118 (2,11,8,17) | 0.40% | 1.30% | 1.40% | 1.90% |
| Other (38,40,49,35) | 8.10% | 5.90% | 6.30% | 4.60% |
Figure 52. Regional distribution of S. pyogenes emm types
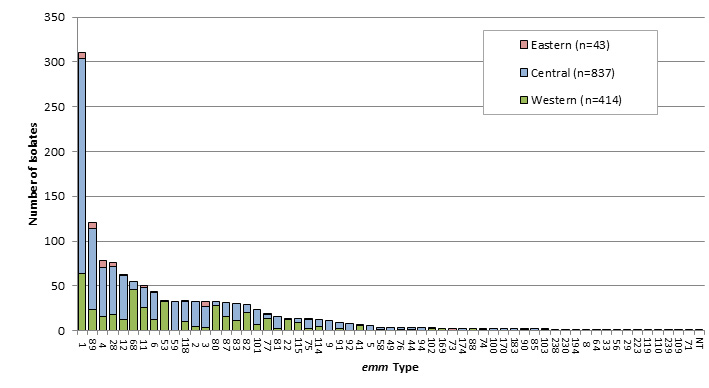
Regional distribution of S. pyogenes emm types - Text Description
This figure represents the distribution of emm types by region (Western, Central and Eastern).
| emm Type | Western (n=414) | Central (n=837) | Eastern (n=43) |
|---|---|---|---|
| 1 | 64 | 240 | 7 |
| 89 | 24 | 90 | 7 |
| 4 | 16 | 54 | 8 |
| 28 | 18 | 54 | 4 |
| 12 | 12 | 49 | 2 |
| 68 | 46 | 9 | |
| 11 | 26 | 22 | 2 |
| 6 | 12 | 31 | 1 |
| 53 | 32 | 2 | |
| 59 | 33 | ||
| 118 | 10 | 22 | 1 |
| 2 | 5 | 27 | |
| 3 | 3 | 24 | 5 |
| 80 | 28 | 4 | |
| 87 | 16 | 15 | |
| 83 | 11 | 19 | |
| 82 | 20 | 9 | |
| 101 | 7 | 17 | |
| 77 | 14 | 4 | 1 |
| 81 | 2 | 14 | |
| 22 | 12 | 2 | |
| 115 | 9 | 4 | |
| 75 | 2 | 10 | 1 |
| 114 | 5 | 7 | |
| 9 | 11 | ||
| 91 | 2 | 7 | |
| 92 | 8 | ||
| 41 | 6 | 1 | |
| 5 | 6 | ||
| 58 | 1 | 3 | |
| 49 | 4 | ||
| 76 | 1 | 3 | |
| 44 | 1 | 2 | |
| 94 | 3 | ||
| 102 | 2 | 1 | |
| 169 | 2 | ||
| 73 | 2 | ||
| 174 | 2 | ||
| 88 | 2 | ||
| 74 | 1 | 1 | |
| 100 | 2 | ||
| 170 | 2 | ||
| 183 | 2 | ||
| 90 | 1 | 1 | |
| 85 | 2 | ||
| 103 | 1 | 1 | |
| 238 | 1 | ||
| 230 | 1 | ||
| 194 | 1 | ||
| 8 | 1 | ||
| 64 | 1 | ||
| 33 | 1 | ||
| 56 | 1 | ||
| 29 | 1 | ||
| 223 | 1 | ||
| 119 | 1 | ||
| 110 | 1 | ||
| 239 | 1 | ||
| 109 | 1 | ||
| 71 | 1 | ||
| NT | 1 |
Figure 53a. Distribution of invasive S. pyogenes emm types from bloodFootnote *, 2013
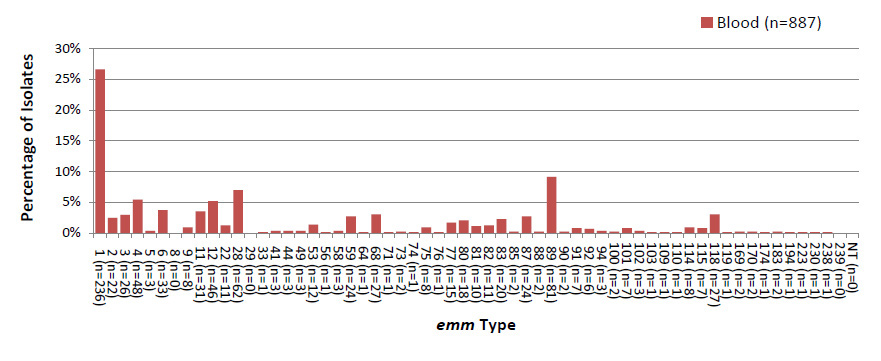
Distribution of invasive S. pyogenes emm types from blood, 2013 - Text Description
This figure represents the percentage of emm types in blood in 2013.
| Serotype | Blood (n=887) |
|---|---|
| 1 (n=236) | 26.61% |
| 2 (n=22) | 2.48% |
| 3 (n=26) | 2.93% |
| 4 (n=48) | 5.41% |
| 5 (n=3) | 0.34% |
| 6 (n=33) | 3.72% |
| 8 (n=0) | 0.00% |
| 9 (n=8) | 0.90% |
| 11 (n=31) | 3.49% |
| 12 (n=46) | 5.19% |
| 22 (n=11) | 1.24% |
| 28 (n=62) | 6.99% |
| 29 (n=0) | 0.00% |
| 33 (n=1) | 0.11% |
| 41 (n=3) | 0.34% |
| 44 (n=3) | 0.34% |
| 49 (n=3) | 0.34% |
| 53 (n=12) | 1.35% |
| 56 (n=1) | 0.11% |
| 58 (n=3) | 0.34% |
| 59 (n=24) | 2.71% |
| 64 (n=1) | 0.11% |
| 68 (n=27) | 3.04% |
| 71 (n=1) | 0.11% |
| 73 (n=2) | 0.23% |
| 74 (n=1) | 0.11% |
| 75 (n=8) | 0.90% |
| 76 (n=1) | 0.11% |
| 77 (n=15) | 1.69% |
| 80 (n=18) | 2.03% |
| 81 (n=10) | 1.13% |
| 82 (n=11) | 1.24% |
| 83 (n=20) | 2.25% |
| 85 (n=2) | 0.23% |
| 87 (n=24) | 2.71% |
| 88 (n=2) | 0.23% |
| 89 (n=81) | 9.13% |
| 90 (n=2) | 0.23% |
| 91 (n=7) | 0.79% |
| 92 (n=6) | 0.68% |
| 94 (n=3) | 0.34% |
| 100 (n=2) | 0.23% |
| 101 (n=7) | 0.79% |
| 102 (n=3) | 0.34% |
| 103 (n=1) | 0.11% |
| 109 (n=1) | 0.11% |
| 110 (n=1) | 0.11% |
| 114 (n=8) | 0.90% |
| 115 (n=7) | 0.79% |
| 118 (n=27) | 3.04% |
| 119 (n=1) | 0.11% |
| 169 (n=2) | 0.23% |
| 170 (n=2) | 0.23% |
| 174 (n=1) | 0.11% |
| 183 (n=2) | 0.23% |
| 194 (n=1) | 0.11% |
| 223 (n=1) | 0.11% |
| 230 (n=1) | 0.11% |
| 238 (n=1) | 0.11% |
| 239 (n=0) | 0.00% |
| NT (n=0) | 0.00% |
Figure 53b. Distribution of invasive S. pyogenes emm types from synovial fluidFootnote *, 2013
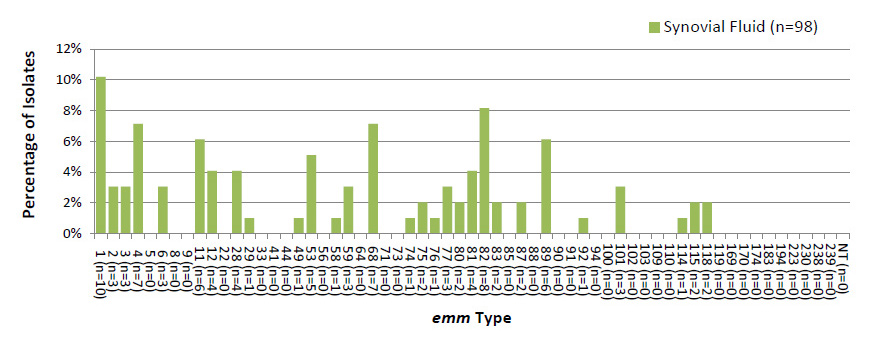
Invasive S. pyogenes emm types in clinical isolation sources, 2013 - Text Description
This figure represents the percentage of emm types in various clinical isolation sources in 2013.
| Serotype | Synovial Fluid (n=98) |
|---|---|
| 1 (n=10) | 10.20% |
| 2 (n=3) | 3.06% |
| 3 (n=3) | 3.06% |
| 4 (n=7) | 7.14% |
| 5 (n=0) | 0.00% |
| 6 (n=3) | 3.06% |
| 8 (n=0) | 0.00% |
| 9 (n=0) | 0.00% |
| 11 (n=6) | 6.12% |
| 12 (n=4) | 4.08% |
| 22 (n=0) | 0.00% |
| 28 (n=4) | 4.08% |
| 29 (n=1) | 1.02% |
| 33 (n=0) | 0.00% |
| 41 (n=0) | 0.00% |
| 44 (n=0) | 0.00% |
| 49 (n=1) | 1.02% |
| 53 (n=5) | 5.10% |
| 56 (n=0) | 0.00% |
| 58 (n=1) | 1.02% |
| 59 (n=3) | 3.06% |
| 64 (n=0) | 0.00% |
| 68 (n=7) | 7.14% |
| 71 (n=0) | 0.00% |
| 73 (n=0) | 0.00% |
| 74 (n=1) | 1.02% |
| 75 (n=2) | 2.04% |
| 76 (n=1) | 1.02% |
| 77 (n=3) | 3.06% |
| 80 (n=2) | 2.04% |
| 81 (n=4) | 4.08% |
| 82 (n=8) | 8.16% |
| 83 (n=2) | 2.04% |
| 85 (n=0) | 0.00% |
| 87 (n=2) | 2.04% |
| 88 (n=0) | 0.00% |
| 89 (n=6) | 6.12% |
| 90 (n=0) | 0.00% |
| 91 (n=0) | 0.00% |
| 92 (n=1) | 1.02% |
| 94 (n=0) | 0.00% |
| 100 (n=0) | 0.00% |
| 101 (n=3) | 3.06% |
| 102 (n=0) | 0.00% |
| 103 (n=0) | 0.00% |
| 109 (n=0) | 0.00% |
| 110 (n=0) | 0.00% |
| 114 (n=1) | 1.02% |
| 115 (n=2) | 2.04% |
| 118 (n=2) | 2.04% |
| 119 (n=0) | 0.00% |
| 169 (n=0) | 0.00% |
| 170 (n=0) | 0.00% |
| 174 (n=0) | 0.00% |
| 183 (n=0) | 0.00% |
| 194 (n=0) | 0.00% |
| 223 (n=0) | 0.00% |
| 230 (n=0) | 0.00% |
| 238 (n=0) | 0.00% |
| 239 (n=0) | 0.00% |
| NT (n=0) | 0.00% |
Figure 53c. Distribution of invasive S. pyogenes emm types from other clinical isolation sourcesFootnote *, 2013
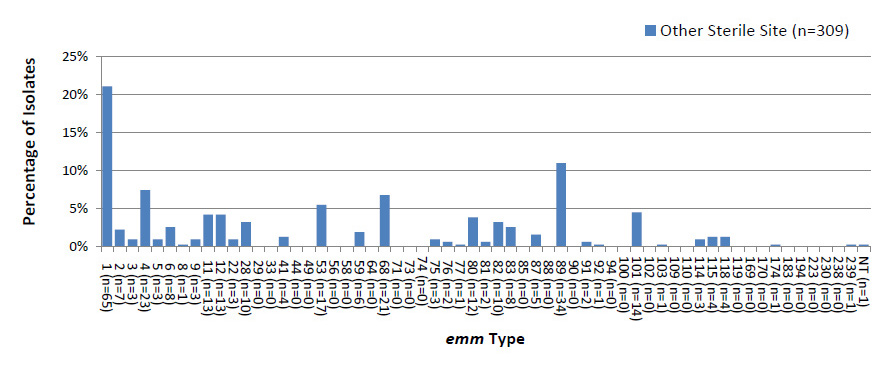
Invasive S. pyogenes emm types in clinical isolation sources, 2013 - Text Description
This figure represents the percentage of emm types in various clinical isolation sources in 2013.
| Serotype | Other Sterile Site (n=309) |
|---|---|
| 1 (n=65) | 21.04% |
| 2 (n=7) | 2.27% |
| 3 (n=3) | 0.97% |
| 4 (n=23) | 7.44% |
| 5 (n=3) | 0.97% |
| 6 (n=8) | 2.59% |
| 8 (n=1) | 0.32% |
| 9 (n=3) | 0.97% |
| 11 (n=13) | 4.21% |
| 12 (n=13) | 4.21% |
| 22 (n=3) | 0.97% |
| 28 (n=10) | 3.24% |
| 29 (n=0) | 0.00% |
| 33 (n=0) | 0.00% |
| 41 (n=4) | 1.29% |
| 44 (n=0) | 0.00% |
| 49 (n=0) | 0.00% |
| 53 (n=17) | 5.50% |
| 56 (n=0) | 0.00% |
| 58 (n=0) | 0.00% |
| 59 (n=6) | 1.94% |
| 64 (n=0) | 0.00% |
| 68 (n=21) | 6.80% |
| 71 (n=0) | 0.00% |
| 73 (n=0) | 0.00% |
| 74 (n=0) | 0.00% |
| 75 (n=3) | 0.97% |
| 76 (n=2) | 0.65% |
| 77 (n=1) | 0.32% |
| 80 (n=12) | 3.88% |
| 81 (n=2) | 0.65% |
| 82 (n=10) | 3.24% |
| 83 (n=8) | 2.59% |
| 85 (n=0) | 0.00% |
| 87 (n=5) | 1.62% |
| 88 (n=0) | 0.00% |
| 89 (n=34) | 11.00% |
| 90 (n=0) | 0.00% |
| 91 (n=2) | 0.65% |
| 92 (n=1) | 0.32% |
| 94 (n=0) | 0.00% |
| 100 (n=0) | 0.00% |
| 101 (n=14) | 4.53% |
| 102 (n=0) | 0.00% |
| 103 (n=1) | 0.32% |
| 109 (n=0) | 0.00% |
| 110 (n=0) | 0.00% |
| 114 (n=3) | 0.97% |
| 115 (n=4) | 1.29% |
| 118 (n=4) | 1.29% |
| 119 (n=0) | 0.00% |
| 169 (n=0) | 0.00% |
| 170 (n=0) | 0.00% |
| 174 (n=1) | 0.32% |
| 183 (n=0) | 0.00% |
| 194 (n=0) | 0.00% |
| 223 (n=0) | 0.00% |
| 230 (n=0) | 0.00% |
| 238 (n=0) | 0.00% |
| 239 (n=1) | 0.32% |
| NT (n=1) | 0.32% |
Antimicrobial Resistance of S. pyogenes
Of the 1,290 invasive S. pyogenes isolates tested by disc diffusion in 2013, 0.6% (n=8) were non-susceptible to chloramphenicol (4 resistant and 4 intermediate isolates), down from 9.4% (n=36) in 2010. Erythromycin resistance has also decreased from 14.4% (n=55) to 8.5% (n=110) from 2010 to 2013; whereas resistance to clindamycin has remained relatively unchanged at 2.2% (n=29) (Figure 54). Induced resistance to clindamycin was observed in a further 6.9% (n=89) of the isolates. No resistance was observed to penicillin or vancomycin.
Chloramphenicol non-susceptibility was observed in very few isolates including emm11 (n=1), emm89 (n=2), emm92 (n=1), emm110 (n=1), emm115 (n=1) and emm180 (n=2) (Table 11). Relatively high erythromycin (macrolide) resistance was observed among emm9 (72.7%, n=11), emm11 (61.7%, n=47), emm92 (87.5%, n=8), and emm114 (75.1%, n=12) isolates (Figure 55).
Figure 54. Antimicrobial resistance of invasive S. pyogenes, 2010 - 2013
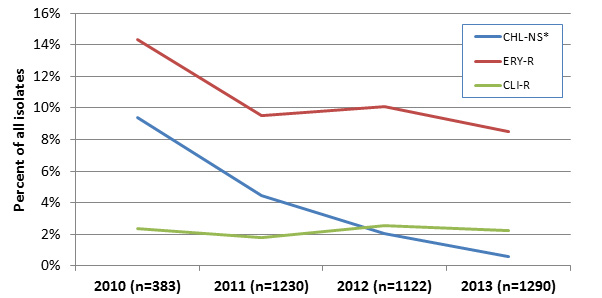
CHL-NS = Chloramphenicol non susceptible (resistant or intermediate); ERY-R = Erythromycin resistant; CLI-R = constitutively clindamycin resistant.
Antimicrobial resistance of invasive S. pyogenes, 2010 - 2013 - Text Description
This figure represents the percentage of S. pyogenes that are non-susceptible to chloramphenicol, resistant to erythromycin and resistant to clindamycin by year from 2010 to 2013.
| Year | CHL-NS | ERY-R | CLI-R |
|---|---|---|---|
| 2010 (n=383) | 9.4% | 14.4% | 2.3% |
| 2011 (n=1230) | 4.5% | 9.5% | 1.8% |
| 2012 (n=1122) | 2.0% | 10.1% | 2.6% |
| 2013 (n=1290) | 0.6% | 8.5% | 2.2% |
CHL-NS = Chloramphenicol non susceptible (resistant or intermediate); ERY-R = Erythromycin resistant; CLI-R = constitutively clindamycin resistant.
| Antimicrobial | Year | |||
|---|---|---|---|---|
| 2010 | 2011 | 2012 | 2013 | |
| CHL-NS* | 36 | 55 | 23 | 8 |
| ERY-R | 55 | 117 | 113 | 110 |
| CLI-R | 9 | 22 | 29 | 29 |
| CHL-NS = Chloramphenicol non susceptible (resistant or intermediate); ERY-R = Erythromycin resistant; CLI-R = constitutively clindamycin resistant. | ||||
| Emm Type | Year Collected (No. Tested) | |||
|---|---|---|---|---|
| 2010 (n=383) | 2011 (n=1230) | 2012 (n=1122) | 2013 (n=1290) | |
| 1 | 8.8% (n=7) | 4.8% (n=16) | 1.7% (n=5) | - |
| 2 | 22.2% (n=2) | 10.5% (n=2) | - | - |
| 3 | 9.1% (n=1) | 1.4% (n=2) | - | - |
| 4 | - | - | 1.8% (n=1) | - |
| 6 | - | - | 2.3% (n=1) | - |
| 9 | - | 12.5% (n=1) | - | - |
| 11 | 14.3% (n=1) | - | - | 2.1% (n=1) |
| 12 | 4.9% (n=2) | 4.9% (n=5) | - | - |
| 22 | - | 14.3% (n=1) | - | - |
| 28 | 5.6% (n=2) | 1.4% (n=1) | 2.8% (n=2) | - |
| 29 | - | - | 7.1% (n=1) | - |
| 41 | 50% (n=1) | - | 11.1% (n=1) | - |
| 48 | - | 25% (n=1) | - | - |
| 58 | - | 42.9% (n=3) | - | - |
| 59 | 13.3% (n=2) | - | - | - |
| 63 | - | 50% (n=1) | - | - |
| 68 | 100% (n=1) | - | 15.4% (n=2) | - |
| 73 | - | - | 11.1% (n=1) | - |
| 75 | - | 5.9% (n=1) | - | - |
| 80 | - | 9.1% (n=1) | - | - |
| 82 | - | 6.9% (n=2) | - | - |
| 83 | 20% (n=3) | - | 2.6% (n=1) | - |
| 87 | - | - | 2.9% (n=1) | - |
| 89 | 17.4% (n=8) | 12.3% (n=14) | 4.5% (n=5) | 1.7% (n=2) |
| 90 | - | 100% (n=1) | - | - |
| 91 | 33.3% (n=1) | - | - | - |
| 92 | - | - | 6.3% (n=1) | 12.5% (n=1) |
| 101 | 28.6% (n=2) | 11.1% (n=2) | - | - |
| 110 | - | - | - | 100% (n=1) |
| 114 | 37.5% (n=3) | 7.7% (n=1) | 5.9% (n=1) | - |
| 115 | - | - | - | 7.7% (n=1) |
| 183 | - | - | - | 100% (n=2) |
| All | 9.4% (n=36) | 4.5% (n=55) | 2% (n=23) | 0.6% (n=8) |
Figure 55. Macrolide resistance of S. pyogenes emm types, 2013
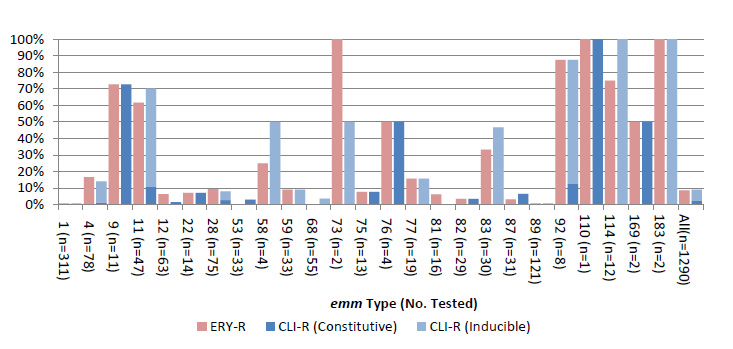
Macrolide resistance of S. pyogenes emm types, 2013 - Text Description
This figure represents the resistance of macrolides to different to emm types in 2013.
| emm | ERY-R | CLI-R (Constitutive) | CLI-R (Inducible) |
|---|---|---|---|
| 1 (n=311) | 0.6% | 0.3% | 0.3% |
| 4 (n=78) | 16.7% | 1.3% | 12.8% |
| 9 (n=11) | 72.7% | 72.7% | 0.0% |
| 11 (n=47) | 61.7% | 10.6% | 59.6% |
| 12 (n=63) | 6.3% | 1.6% | 0.0% |
| 22 (n=14) | 7.1% | 7.1% | 0.0% |
| 28 (n=75) | 9.3% | 2.7% | 5.3% |
| 53 (n=33) | 0.0% | 3.0% | 0.0% |
| 58 (n=4) | 25.0% | 0.0% | 50.0% |
| 59 (n=33) | 9.1% | 0.0% | 9.1% |
| 68 (n=55) | 0.0% | 0.0% | 3.6% |
| 73 (n=2) | 100.0% | 0.0% | 50.0% |
| 75 (n=13) | 7.7% | 7.7% | 0.0% |
| 76 (n=4) | 50.0% | 50.0% | 0.0% |
| 77 (n=19) | 15.8% | 0.0% | 15.8% |
| 81 (n=16) | 6.3% | 0.0% | 0.0% |
| 82 (n=29) | 3.4% | 3.4% | 0.0% |
| 83 (n=30) | 33.3% | 0.0% | 46.7% |
| 87 (n=31) | 3.2% | 6.5% | 0.0% |
| 89 (n=121) | 0.8% | 0.0% | 0.8% |
| 92 (n=8) | 87.5% | 12.5% | 75.0% |
| 110 (n=1) | 100.0% | 100.0% | 0.0% |
| 114 (n=12) | 75.0% | 0.0% | 100.0% |
| 169 (n=2) | 50.0% | 50.0% | 0.0% |
| 183 (n=2) | 100.0% | 0.0% | 100.0% |
| All(n=1290) | 8.5% | 2.2% | 6.9% |
Invasive Streptococcus agalactiae (Group B Streptococcus)
Of the 416 Streptococcus agalactiae isolates tested at the NML, 16 cultures (3.8%) were early onset isolates from infants <8 days old; 7 cultures (1.7%) were late onset from infants 8 – 31 days old; 4 cultures (1.0%) were from children 1 month to 14 years old, 177 (42.5%) were from adults 15 – 64 years old, and 165 (39.7%) were from seniors ≥65 years of age, and no age was available for 47 isolates (Table 12). Isolates from male patients accounted for 52.8% (n=84) of the 159 isolates for which gender information was available.
Serotype III was most prevalent overall representing 23.8% (n=99) of all isolates tested in 2013, and 62.5% (n=10) of early onset, 57.1% (n=4) of late onset, and 50.0% (n=2) of child isolates. Serotype V was most predominant in adults and seniors with 24.3% (n=43) and 20.6% (n=34) of the isolates in these age groups, respectively (Table 12).
The majority of GBS were isolated from blood, representing 75.7% (n=315) of all isolates, followed by synovial fluids with 4.8% (n=20) of the isolates (Figure 56). Serotype III accounted for 25.7% (n=81) of blood, and 60.0% (n=6) of the CSF isolates, whereas serotype II accounted for 30.0% (n=3) of peritoneal isolates, and serotype V represented 50.0% (n=10) of synovial fluid and 25% (n=14) of other sterile site isolates (Figure 57).
| Serotype | Infant Early Onset | Infant Late Onset | Child | Adult | Senior | Not Given | Total |
|---|---|---|---|---|---|---|---|
| Ia | - | 28.6%(2) | 50.0%(2) | 15.3%(27) | 18.8%(31) | 25.5%(12) | 17.8%(74) |
| Ib | - | 14.3%(1) | - | 15.3%(27) | 17.6%(29) | 10.6%(5) | 14.9%(62) |
| II | 6.3%(1)Footnote b | - | - | 15.3%(27) | 9.7%(16) | 8.5%(4) | 11.5%(48) |
| III | 62.5%(10) | 57.1%(4) | 50.0%(2) | 19.2%(34) | 18.2%(30) | 40.4%(19) | 23.8%(99) |
| IV | 25.0%(4) | - | - | 7.9%(14) | 9.7%(16) | 6.4%(3) | 8.9%(37) |
| V | 6.3%(1) | - | - | 24.3%(43) | 20.6%(34) | 8.5%(4) | 19.7%(82) |
| VI | - | - | - | - | 2.4%(4) | - | 1.0%(4) |
| VII | - | - | - | 0.6%(1) | 0.6%(1) | - | 0.5%(2) |
| VIII | - | - | - | 0.6%(1) | 1.2%(2) | - | 0.7%(3) |
| IX | - | - | - | 0.6%(1) | 0.6%(1) | - | 0.5%(2) |
| NT | - | - | - | 1.1%(2) | 0.6%(1) | - | 0.7%(3) |
| Total | (16) | (7) | (4) | (177) | (165) | (47) | (416) |
Figure 56. Clinical isolation sites of S. agalactiae
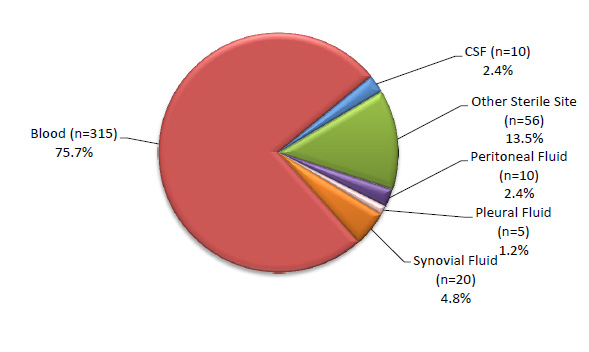
Clinical isolation sites of S. agalactiae - Text Description
This figure represents the percentage of S. agalactiae found in various clinical isolation sites.
| Clinical isolation site | Percentage |
|---|---|
| Blood (n=315) | 75.7% |
| CSF (n=10) | 2.4% |
| Other Sterile Site (n=56) | 13.5% |
| Peritoneal Fluid (n=10) | 2.4% |
| Pleural Fluid (n=5) | 1.2% |
| Synovial Fluid (n=20) | 4.8% |
Figure 57. Invasive S. agalactiae serotypes by clinical isolation site
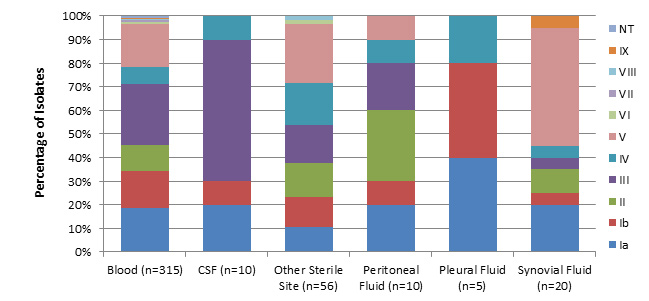
Invasive S. agalactiae serotypes by clinical isolation site - Text Description
This figure represents the percentage of S. agalactiae found in various clinical isolation sites by serotype.
| Serotype | Blood (n=315) | CSF (n=10) | Other Sterile Site (n=56) | Peritoneal Fluid (n=10) | Pleural Fluid (n=5) | Synovial Fluid (n=20) |
|---|---|---|---|---|---|---|
| Ia | 18.4% | 20.0% | 10.7% | 20.0% | 40.0% | 20.0% |
| Ib | 15.9% | 10.0% | 12.5% | 10.0% | 40.0% | 5.0% |
| II | 11.1% | 0.0% | 14.3% | 30.0% | 0.0% | 10.0% |
| III | 25.7% | 60.0% | 16.1% | 20.0% | 0.0% | 5.0% |
| IV | 7.3% | 10.0% | 17.9% | 10.0% | 20.0% | 5.0% |
| IX | 0.3% | 0.0% | 0.0% | 0.0% | 0.0% | 5.0% |
| NT | 1.0% | 0.0% | 0.0% | 0.0% | 0.0% | 0.0% |
| V | 18.1% | 0.0% | 25.0% | 10.0% | 0.0% | 50.0% |
| VI | 1.0% | 0.0% | 1.8% | 0.0% | 0.0% | 0.0% |
| VII | 0.6% | 0.0% | 0.0% | 0.0% | 0.0% | 0.0% |
| VIII | 0.6% | 0.0% | 1.8% | 0.0% | 0.0% | 0.0% |
| Serotype | Blood | CSF | Other Sterile Site | Peritoneal Fluid | Pleural Fluid | Synovial Fluid |
|---|---|---|---|---|---|---|
| NT | 3 | |||||
| IX | 1 | 1 | ||||
| VIII | 2 | 1 | ||||
| VII | 2 | |||||
| VI | 3 | 1 | ||||
| V | 57 | 14 | 1 | 10 | ||
| IV | 23 | 1 | 10 | 1 | 1 | 1 |
| III | 81 | 6 | 9 | 2 | 1 | |
| II | 35 | 8 | 3 | 2 | ||
| Ib | 50 | 1 | 7 | 1 | 2 | 1 |
| Ia | 58 | 2 | 6 | 2 | 2 | 4 |
Figure 58. Regional distribution of invasive S. agalactiae serotypes in 2013
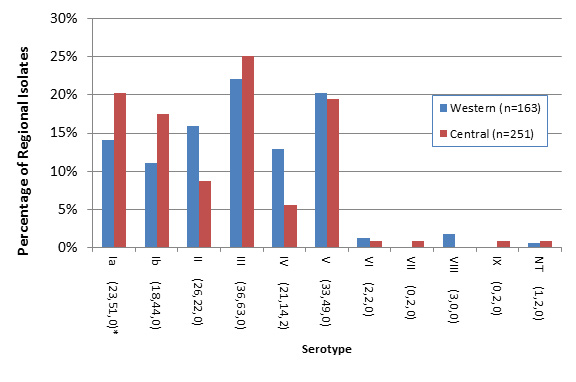
* Number of isolates from Western, Central and Eastern regions, respectively. To improve scale 2 serotype IV isolates representing 100% of the Eastern regional isolates were omitted from the figure.
Regional distribution of invasive S. agalactiae serotypes in 2013 - Text Description
This figure represents the distribution of S. agalactiae serotypes through the western and central regions of Canada in 2013.
| Serotype | Western (n=163) | Central (n=251) |
|---|---|---|
| Ia (23,51,0)* | 14.1% | 20.3% |
| Ib (18,44,0) | 11.0% | 17.5% |
| II (26,22,0) | 16.0% | 8.8% |
| III (36,63,0) | 22.1% | 25.1% |
| IV(21,14,2) | 12.9% | 5.6% |
| V (33,49,0) | 20.2% | 19.5% |
| VI (2,2,0) | 1.2% | 0.8% |
| VII (0,2,0) | 0.0% | 0.8% |
| VIII (3,0,0) | 1.8% | 0.0% |
| IX (0,2,0) | 0.0% | 0.8% |
| NT (1,2,0) | 0.6% | 0.8% |
Note: To improve scale 2 serotype IV isolates representing 100% of the Eastern regional isolates were omitted from the figure.
Antimicrobial Resistance of Streptococcus agalactiae
Of the 420 invasive S. agalactiae isolates tested by disc diffusion in 2013, 1.9% (n=8) were non-susceptible (2 intermediate and 6 resistant) to chloramphenicol, remaining relatively constant since 2010 with 2.1% (n=5). Macrolide resistance has increased with clindamycin resistance increasing from 25.5% (n=84) of the isolates to 28.8% (n=121), and erythromycin resistance increasing from 40.7% (n=134) to 48.8% (n=205) between 2012 and 2013 (Figure 59).
Similarly as with the other beta hemolytic Group A Streptococcus, chloramphenicol non-susceptibility in Group B Streptococci was observed in very few isolates including serotypes Ia (n=1), III (n=2), IV (n=1) and V (n=4) (Table 15). Relatively high erythromycin (macrolide) resistance was observed among serotype II (59.6%, n=28), IV (60.5%, n=23), and V (61.2%, n=52) (Figure 60).
Figure 59. Antimicrobial resistance of invasive S. agalactiae (iGBS) isolated collected 2010 to 2013
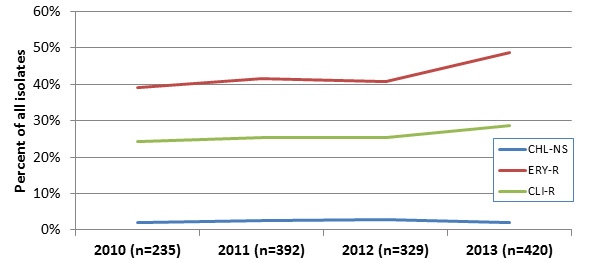
CHL-NS = Chloramphenicol non susceptible (resistant or intermediate); ERY-R = Erythromycin resistant; CLI-R = constitutively clindamycin resistant
Antimicrobial resistance of invasive S. agalactiae (iGBS) isolated collected 2010 to 2013 - Text Description
This figure represents the percentage of antimicrobial resistant S. agalactiae (iGBS) isolated by year from 2010 to 2013.
| Year | CHL-NS | ERY-R | CLI-R |
|---|---|---|---|
| 2010 (n=235) | 2.1% | 39.1% | 24.3% |
| 2011 (n=392) | 2.6% | 41.6% | 25.5% |
| 2012 (n=329) | 2.7% | 40.7% | 25.5% |
| 2013 (n=420) | 1.9% | 48.8% | 28.8% |
CHL-NS = Chloramphenicol non susceptible (resistant or intermediate); ERY-R = Erythromycin resistant; CLI-R = constitutively clindamycin resistant.
| Antimicrobial | Year | |||
|---|---|---|---|---|
| 2010 | 2011 | 2012 | 2013 | |
| CHL-NS | 5 | 10 | 9 | 8 |
| ERY-R | 92 | 163 | 134 | 205 |
| CLI-R | 57 | 100 | 84 | 121 |
| CHL-NS = Chloramphenicol non susceptible (resistant or intermediate); ERY-R = Erythromycin resistant; CLI-R = constitutively clindamycin resistant. | ||||
| Serotype | Year Collected (No. Tested) | |||
|---|---|---|---|---|
| 2010 (n=235) | 2011 (n=392) | 2012 (n=329) | 2013 (n=420) | |
| Ia | 4.8% (n=2) | - | 1.8% (n=1) | 1.4% (n=1) |
| Ib | - | - | - | - |
| II | - | - | 3.4% (n=1) | - |
| III | 1.7% (n=1) | 2.1% (n=2) | 3.5% (n=3) | 2% (n=2) |
| IV | 5.3% (n=1) | 9.8% (n=4) | 11.8% (n=4) | 2.6% (n=1) |
| V | 1.8% (n=1) | 3.8% (n=3) | - | 4.7% (n=4) |
| VI | - | - | - | - |
| VII | - | - | - | |
| VIII | - | 16.7% (n=1) | - | |
| IX | - | - | - | - |
| NT | - | - | - | - |
| All | 2.1% (n=5) | 2.6% (n=10) | 2.7% (n=9) | 1.9% (n=8) |
Figure 60. Macrolide resistance of S. agalactiae serotypes, 2013
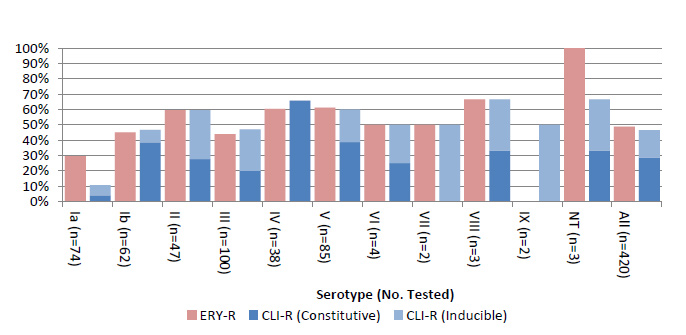
Antimicrobial resistance of invasive S. agalactiae (iGBS) isolated collected 2010 to 2013 - Text Description
This figure represents the percentage of macrolide resistant (erythromycin resistant, clindamycin resistant constitutive and clindamycin resistant inducible) S. agalactiae by serotype in 2013.
| Serotype | ERY-R | CLI-R (Constitutive) | CLI-R (Inducible) |
|---|---|---|---|
| Ia (n=74) | 29.7% | 4.1% | 6.8% |
| Ib (n=62) | 45.2% | 38.7% | 8.1% |
| II (n=47) | 59.6% | 27.7% | 31.9% |
| III (n=100) | 44.0% | 20.0% | 27.0% |
| IV (n=38) | 60.5% | 65.8% | 0.0% |
| V (n=85) | 61.2% | 38.8% | 21.2% |
| VI (n=4) | 50.0% | 25.0% | 25.0% |
| VII (n=2) | 50.0% | 0.0% | 50.0% |
| VIII (n=3) | 66.7% | 33.3% | 33.3% |
| IX (n=2) | 0.0% | 0.0% | 50.0% |
| NT (n=3) | 100.0% | 33.3% | 33.3% |
| All (n=420) | 48.8% | 28.8% | 17.9% |
Conclusion
In S. pneumoniae the proportion of PCV7 serotypes remains low and continuing decreases in the predominant PCV13 serotypes 7F and 19A have been observed. The decrease of PCV13 serotypes, in addition to continuing decreases in incidence of disease in children, provides evidence of the impact of the PCV13 vaccination programs in Canada. Continued vigilance however, is required to recognize possible increases in other non-PCV13 serotypes circulating in Canada, such as serotype 22F, 23A and 23B. Although a component of the PCV13 vaccine, serotype 3 has not decreased at the rate of other constituent serotypes, raising concerns of the virulence, the immunogenicity of this serotype and the efficacy of this component of the vaccine. The continued monitoring of the relative frequency of serotypes circulating in Canada will help inform and guide the development and composition of new vaccines which will lower the total burden of disease.
Antimicrobial resistance among isolates of S. pneumoniae is generally declining, mainly due to the decline of highly resistant serotype 19A, but resistance to penicillins, macrolides, tetracyclines, sulfonamides and fluoroquinolones and multi-drug resistance is still common. Current antimicrobial resistance levels in Canada are relatively low, however monitoring the antimicrobial susceptibility patterns of the common S. pneumoniae serotypes is essential to guide empiric and directed treatments.
S. pyogenes emm1 and emm89 continue to be the dominate strains in Canada, whereas annual variability of the other emm types continue. Antimicrobial resistance in Group A Streptococcus has declined since 2010, however, due to the severity, high risk of infection and heightened public awareness of Group A Streptococci, the continued monitoring and surveillance of circulating serotypes and antimicrobial resistance levels are important to help identify outbreaks of disease and to inform and guide public health interventions.
S. agalactiaeserotypes III and V are the predominate strains in Canada, and antimicrobial resistance is increasing, especially to macrolides. GBS causes severe outcomes in neonatal groups; however there is an increasing burden of disease among adults. Monitoring shifts in the distribution of serotypes, levels of antimicrobial resistance as well as collecting additional enhanced epidemiological information, is important to help identify potential risk factors, spread of invasive strains, and to raise awareness of future prevention and treatment options.
Appendix
| Age group | Total number of isolates serotyped | Total number of illnesses reported to CNDSSFootnote ** | Percent serotyped |
|---|---|---|---|
| <1 years | 51 | 68 | 75.0% |
| 1 - 4 years | 153 | 172 | 89.0% |
| 5 – 39 years | 345 | 444 | 77.7% |
| 40 – 59 years | 678 | 851 | 79.7% |
| ≥60 years | 1316 | 1627 | 80.9% |
| All Ages | 2577Footnote * | 3162 | 81.5% |
| Age group | Total number of isolates serotyped | Total number of illnesses reported to CNDSSFootnote ** | Percent serotyped |
|---|---|---|---|
| <1 years | 43 | 37 | 116.2% |
| 1 - 4 years | 34 | 71 | 47.9% |
| 5 – 39 years | 366 | 497 | 73.6% |
| 40 – 59 years | 389 | 517 | 75.2% |
| ≥60 years | 421 | 536 | 78.5% |
| All Ages | 1294Footnote * | 1658 | 78.0% |
References
- Austrian R. The Quellung reaction, a neglected microbiological technique. 1976. Mt. Sinai J. Med. 43:699–709.
- Bettinger JA, Scheifele DA, Kellner JD, et al. 2010. The effect of routine vaccination on invasive pneumococcal infections in Canadian children, Immunization Monitoring Program, Active 2000–2007. Vaccine 28:2130–2136.
- Bjornson G, Scheifele DW, Bettinger J, et al. 2007. Effectiveness of Pneumococcal Conjugate Vaccine in Greater Vancouver, Canada: 2004-2005. Ped.Inf.Dis.J. 26(6):540-542.
- Bruce, MG, Deeks SL, Zulz T, et al. 2008. International Circumpolar Surveillance System for Invasive Pneumococcal Disease, 1999-2005. Emerging.Infect.Dis. 14(1):25-33.
- Case Definitions for Communicable Diseases under National Surveillance - 2009. 2009. CCDR: 35s2. Available: http://www.phac-aspc.gc.ca/publicat/ccdr-rmtc/09vol35/35s2/Pneumoco-eng.php
- Clinical Laboratory Standards Institute (CLSI). 2008. Interpretative Criteria for Identification of Bacteria and Fungi by DNA Target Sequencing, Approved Guideline. MM18-A; 28(12):21-24.
- Clinical Laboratory Standards Institute (CLSI). January 2011. Performance Standards for Antimicrobial Susceptibility Testing; Twenty-First Informational Supplement. M100-S21; 31(1).
- Cunningham MW. 2000 (July). Pathogenesis of Group A Streptococcal Infections. Clin. Micro. Rev. 470-511.
- Demczuk WHB, Martin I, Griffith A, et al. 2012. Serotype distribution of invasive Streptococcus pneumoniae in Canada during the introduction of the 13-valent pneumococcal conjugate vaccine, 2010. Can.J.Microbiol. 58:1008-1017.
- Demczuk WHB, Martin I, Griffith A, et al. 2013. Serotype distribution of invasive Streptococcus pneumoniae in Canada after the introduction of the 13-valent pneumococcal conjugate vaccine, 2010-2012. Can. J. Microbiol. 59:778-788.
- Deng X, Church D, Vanderkooi OG, et al. 2013. Streptococcus pneumoniae infection: a Canadian perspective. Expert Rev. Anti Infect. Ther. 11(8):781-791.
- De Wals P, Lefebvre B, Defay F, et al. 2012. Invasive pneumococcal diseases in birth cohorts vaccinated with PCV-7 and/or PHiD-CV in the province of Quebec, Canada. Vaccine 30:6416-6420.
- Drancourt M, Roux V, Fournier PE, Raoult D. 2004 (February). rpoB gene sequence-based identification of aerobic gram-positive cocci of the genera Streptococcus, Enterococcus, Gemella, Abiotrophia and Granulicatella. J. Clin. Micro. 42(2):497-504.
- European Committee on Antimicrobial Susceptibility Testing (EUCAST). 2012. Clinical Breakpoint Table. Version 2.0. Available: http://www.eucast.org/fileadmin/src/media/PDFs/EUCAST_files/Breakpoint_tables/Breakpoint_table_v_2.0_120221.pdf
- Kellner, JD, Sheifele, D, Vanderkooi, OG, et al. 2008. Effects of Routine Infant Vaccination with the 7-Valent Pneumococcal Conjugate Vaccine on Nasopharyngeal Colonization with Streptococcus pneumoniae in Children in Calgary, Canada. The Ped. Infect. Dis. Journal. 27(6):526-532.
- Kellner JD, Vanderkooi OG, MacDonald J, Church DL, Tyrrell GJ, Scheifele DW. 2009 (July). Changing epidemiology of invasive pneumococcal disease in Canada, 1998-2007: update from the Calgary-area Streptococcus pneumoniae research (CASPER) study. Clin Infect Dis. 49(2):205-12.
- Lamangni, TL, Keshishian C, Efstratiou A, et al. 2013. Emerging Trends in the Epidemiology of Invasive Group B Streptococcal Disease in England and Wales, 1991 – 2010. Clin Inf Dis 2013;57(5):682-8.
- Lim, GH, Wormsbecker, AE, McGeer A, et al. 2013. Have changing pneumococcal vaccination programmes impacted disease in Ontario? Vaccine 31:2680-2685.
- Lovgren M, Spika JS, Talbot JA. 1998. Invasive Streptococcus pneumoniae infections: serotype distribution and antimicrobial resistance in Canada, 1992-1995. Can.Med.Assoc.J. 158(3):327-331.
- Marchessault V, editor. 2002. Canadian Immunization Guide. 6th ed. Ottawa: Canadian
- Medical Association.
- Merck & Co. Inc., Whitehouse Station, NJ 08889, USA. Pneumovax ® 23 (Pneumococcal vaccine polyvalent).
- McIntosh ED, Reinert RR. 2011 (Jan). Global prevailing and emerging pediatric pneumococcal serotypes. Expert Rev Vaccines. 10(1):109-29.
- Minnesota Department of Health, Infectious Disease Epidemiology, Prevention and Control Division. Available: http://www.helath.state.nm.us/divs/idepc/dtopics/invbacterial/sterile.html
- National Advisory Committee on Immunization (NACI). 2010 (November). An Advisory Committee Statement (ACS), Update on the Use of Conjugate Pneumococcal Vaccines in Childhood. CCDR 36(ACS-12):1-21.
- Public Health Agency of Canada. 2013. Publicly funded Immunization Programs in Canada - Routine Schedule for Infants and Children including special programs and catch-up programs (as of March 2013) [online]. Available from http://www.phac-aspc.gc.ca/im/ptimprog-progimpt/table-1-eng.php [Accessed 2013-10-17].
- Public Health Agency of Canada. 2014. Notifiable Diseases On-Line. http://dsol-smed.phac-aspc.gc.ca/dsol-smed/ndis/charts.php?c=pl Accessed: 04 Sept 2014.
- Robinson KA, Baughman W, Rothrock G, Barrett NL, Pass M, Lexau C, et al. 2001 (April).
- Epidemiology of invasive Streptococcus pneumoniae infections in the United States, 1995–1998: opportunities for prevention in the conjugate vaccine era. JAMA. 285(13):1729–35.
- Schuchat A, Robinson K, Wenger JD, Harrison LH, Farley M, Reingold AL, et al. 1997.
- Bacterial meningitis in the United States in 1995. Active Surveillance Team. N Engl J Med;337(October (14)):970–6.
- Schwartz B, Facklam RR, Breiman RF. 1990. Changing epidemiology of group A streptococcal infection in the USA. Lancet 336:1167-1171.
- Scott JA, Hall AJ, Dagan R, Dixon JM, Eykyn SJ, Fenoll A, et al. 1996 (June). Serogroup-specific epidemiology of Streptococcus pneumoniae: associations with age, sex, and geography in 7,000 episodes of invasive disease. Clin Infect Dis. 22(6):973–81.
- Shahidi N, Dhaliwa J, Tyrrell G, et al. 2008. Trends in incidence of invasive pneumococcal disease following introduction of the universal infant immunization program in British Columbia, 2001 – 2006. BC Medical Journal 50(1):18-21.
- Siljander T, Lyytikäinen O, Vähäkuopus S, et al. 2010. Epidemiology, outcome and emm types of invasive group A streptococcal infections in Finland. Eur J Clin Microbiol Infect Dis; 29:1229-1235.
- Spellerberg B, Brandt C. Streptococcus. In: Murray PR, Baron EL, Jorgensen JH, Landry ML, Pfaller MA. editors. 2007. Manual of Clinical Microbiology. 9th ed. Washington: American Society for Microbiology; p. 412-429.
- Tyrrell GJ, Lovgren M, Chui N, et al. 2009. Serotypes and antimicrobial susceptibilities of invasive Streptococcus pneumoniae pre- and post-seven valent pneumococcal conjugate vaccine introduction in Alberta, Canada 2000-2006. Vaccine; 27:3553-3560.
- Weinberger DM, Malley R, Lipsitch M. 2011 (April). Serotype replacement in disease after pneumococcal vaccination. The Lancet, Available online ISSN 0140-6736, DOI: 10.1016/S0140-6736(10)62225-8. (http://www.sciencedirect.com/science/article/B6T1B-52M217X-4/2/f3141605bd8e55b78bbc1df8f2dd8677)
