
Archived National Surveillance of Antimicrobial Susceptibilities of Neisseria gonorrhoeae – Annual Summary 2014

Download the alternative format
(PDF format, 1.57 MB, 45 pages)
Table of Contents Figures and Tables
- Table 1. A Summary of the Neisseria gonorrhoeae Culture Isolates Received by the NML, 2010 - 2014
- Table 2. Neisseria gonorrhoeae Antimicrobial Resistance Criteria
- Table 3. Neisseria gonorrhoeae Antimicrobial Resistance Characterization Definitions
- Table 4. Demographic data for the Neisseria gonorrhoeae Isolates Tested at the NML, 2014 (N=2,101)
- Table 5. Anatomic Isolation Sites for the Neisseria gonorrhoeae Isolates Tested at the NML, 2014 (N=2,101)
- Figure 1. Neisseria gonorrhoeae Isolates in Canada, 2010 - 2014
- Figure 2. Trends of PPNG, TRNG, CMRNG, Probable CMRNG Neisseria gonorrhoeae in Canada from 2010 - 2014
- Figure 3. Trends of Antimicrobial Susceptibilities of Neisseria gonorrhoeae Tested in Canada, 2004 - 2014
- Figure 4. Neisseria gonorrhoeae Isolates Tested by the NML between 2010 and 2014 with Decreased Susceptibility to Cefixime and Ceftriaxone
- Figure 5. Geographical Distribution of Neisseria gonorrhoeae Isolates with Decreased Susceptibility to Cefixime, 2010 to 2014
- Table 6. Geographical Distribution of Neisseria gonorrhoeae Isolates with Decreased Susceptibility to Cefixime, 2010 to 2014
- Figure 6. Geographical Distribution of Neisseria gonorrhoeae Isolates with Decreased Susceptibility to Ceftriaxone, 2010 to 2014
- Table 7. Geographical Distribution of Neisseria gonorrhoeae Isolates with Decreased Susceptibility to Ceftriaxone, 2010 to 2014
- Figure 7. Trends of Cefixime Susceptibilities of Neisseria gonorrhoeae Isolates Tested by the NML from 2010 to 2014
- Figure 8. Trends of Ceftriaxone Susceptibilities of Neisseria gonorrhoeae Isolates Tested by the NML from 2010 to 2014
- Figure 9. Cefixime Susceptibilities of Neisseria gonorrhoeae Isolates Tested by the NML from 2010 to 2014
- Table 8. Cefixime Susceptibilities of Neisseria gonorrhoeae Isolates Tested by the NML from 2010 to 2014
- Figure 10. Ceftriaxone Susceptibilities of Neisseria gonorrhoeae Isolates Tested by the NML from 2010 to 2014
- Table 9. Ceftriaxone Susceptibilities of Neisseria gonorrhoeae Isolates Tested by the NML from 2010 to 2014
- Figure 11. Geographical Distribution of Azithromycin Resistant Neisseria gonorrhoeae Isolates, 2010 to 2014
- Table 10. Geographical Distribution of Azithromycin Resistant Neisseria gonorrhoeae Isolates, 2010 to 2014
- Figure 12. Trends of Azithromycin Susceptibilities of Neisseria gonorrhoeae Isolates Tested by the NML from 2010 to 2014
- Figure 13. Azithromycin Susceptibilities of Neisseria gonorrhoeae Isolates Tested by the NML from 2010 to 2014
- Table 11. Azithromycin Susceptibilities of Neisseria gonorrhoeae Isolates Tested by the NML from 2010 to 2014
- Table 12. Neisseria gonorrhoeae Isolates with Combined Decreased Susceptibility to Cephalosporins and Resistance to Azithromycin
- Figure 14. Geographical Distribution of Ciprofloxacin Resistant Neisseria gonorrhoeae Isolates, 2010 to 2014
- Table 13. Geographical Distribution of Ciprofloxacin Resistant Neisseria gonorrhoeae Isolates, 2010 to 2014
- Figure 15. Trends of Ciprofloxacin Susceptibilities of Neisseria gonorrhoeae Isolates Tested by the NML from 2010 to 2014
- Figure 16. Trends of Ertapenem Susceptibilities of Neisseria gonorrhoeae Isolates Tested by the NML in 2013 and 2014
- Figure 17. Trends of Gentamicin Susceptibilities of Neisseria gonorrhoeae Isolates Tested by the NML in 2013 and 2014
- Figure 18. Prevalent NG-MAST Sequence Type Distribution of Neisseria gonorrhoeae Isolates received by the NML, 2014; N=2,101
- Figure 19. Trends of Prevalent NG-MAST Sequence Types of Neisseria gonorrhoeae Isolates received by the NML, 2010 - 2014
- Figure 20. Provincial Distribution within Neisseria gonorrhoeae NG-MAST Sequence Types, 2014; N=2,101
- Figure 21. Distribution of Neisseria gonorrhoeae NG-MAST Sequence Types within Provinces, 2014; N=2,101
- Figure 22. Distribution of Resistance Characterizations within Neisseria gonorrhoeae NG-MAST Sequence Types, 2014; N=2,101
- Figure 23. NG-MAST Sequence Types of 2014 Neisseria gonorrhoeae Isolates
- Figure 24. Genetic Relationship of Prevalent Neisseria gonorrhoeae NG-MAST Sequence Types, 2014
- Figure 25. Plasmid Distribution within Antimicrobial Classifications of Neisseria gonorrhoeae Isolates Received by the NML, 2010 - 2014
- Appendix A. Neisseria gonorrhoeae culture isolates in Canada, 2010 - 2014
- Appendix B. Characterization of all Neisseria gonorrhoeae Isolates Submitted to the NML, 2010 - 2014
Acknowledgements
Authorship and Lead Contributors:
- Streptococcus and STI Unit
Bacteriology and Enteric Diseases Program
National Microbiology Laboratory
Public Health Agency of Canada- Pam Sawatzky, Gary Liu, Irene Martin (Unit Head)
- Dr. Michael Mulvey (Chief, Antimicrobial Resistance and Nosocomial Infections)
Other Contributors:
- Surveillance and Epidemiology Division
Centre for Communicable Diseases and Infection Control
Public Health Agency of Canada- Dr. Chris Archibald, Dr. Aboubakar Mounchili, Stephanie Totten, Lily Fang
- Professional Guidelines and Public Health Practice Division
Centre for Communicable Diseases and Infection Control
Public Health Agency of Canada- Dr. Margaret Gale-Rowe, Dr. Jun Wu, Lisa Pogany
- This report has been reviewed by Canadian Public Health Laboratory Network (CPHLN) Provincial and Territorial Laboratory Directors.
- The results presented in this report represent Neisseria gonorrhoeae isolates kindly submitted from the following hospitals or provincial public health laboratories:
- British Columbia Centre for Disease Control, Vancouver, British Columbia:
- Dr. Mel Krajden, Dr. Linda Hoang, Ana Paccagnella
- Provincial Laboratory of Public Health Alberta, Edmonton, Alberta:
- Dr. Graham Tipples, Dr. Greg Tyrrell, Dr. Prenilla Naidu, Dr. Steven Drews, Donna Burton, LeeAnn Turnbull, Dawn Coppock
- Saskatchewan Disease Control Laboratory, Regina, Saskatchewan:
- Dr. Greg Horsman, Rosanne Kitzul
- Cadham Provincial Laboratory, Winnipeg, Manitoba:
- Dr. Paul Van Caessele, Sandra Giercke, Denise Sitter
- Public Health Laboratories, Public Health Ontario, Etobicoke, Ontario:
- Dr. Frances Jamieson, Dr. Vanessa Allen, Deirdre Soares, Susan Bending, Ann Maki, Dayle Noda, Hema Champaneria
- Laboratoire de santé publique du Québec, Ste-Anne-de-Bellevue, Québec:
- Dr. Jean Longtin, Dr. Brigitte Lefebvre, Nadia Zaid
- Queen Elizabeth II Health Science Centre, Halifax, Nova Scotia:
- Dr. David Haldane
- New Brunswick Regional Hospitals:
- Dr. Lewis Abbott, Dr. Richard Garceau
- Newfoundland Public Health Laboratory, St. John's, Newfoundland:
- Dr. Sam Ratnam, Laura Gilbert
- British Columbia Centre for Disease Control, Vancouver, British Columbia:
Neisseria gonorrhoeae cultures were not reported to the NML or received from the Northwest Territories, Nunavut or the Yukon.
Executive Summary
- This report compares laboratory surveillance data for Neisseria gonorrhoeae isolates submitted by provincial microbiology laboratories to the National Microbiology Laboratory (NML) from 2010 - 2014.
- The Canadian reported rate of gonorrhea is on the rise and has more than doubled from 15.0 per 100,000 in 1997 to 39.3 per 100,000 in 2013. Gonorrhoea is the second most commonly reported bacterial sexually transmitted infection in Canada with 13,786 cases reported in 2013.
- Over time, N. gonorrhoeae has acquired resistance to many antibiotics such as penicillin, tetracycline, erythromycin and ciprofloxacin. Antimicrobial resistance in N. gonorrhoeae is a serious threat to effective treatment of gonococcal infections.
- In 2014, a total of 3,809 N. gonorrhoeae isolates were cultured in public health laboratories across Canada; 2,101 of these were submitted to the NML for antimicrobial susceptibility testing. The total number of isolates cultured in all provinces was used as the denominator to calculate resistance proportion.
- Using the WHO breakpoints of decreased susceptibility to cefixime at MIC ≥ 0.25 mg/L and decreased susceptibility to ceftriaxone at MIC ≥ 0.125 mg/L (WHO, 2012), the percentage of isolates with decreased susceptibility to ceftriaxone and/or cefixime was 3.1% (119/3,809) in 2014. This number represents a decrease from 3.9% (123/3,195) in 2013, 5.9% (179/3,036) in 2012 and 7.6% (254/3,360) in 2011.
- Isolates with decreased susceptibility to cefixime have declined from a high of 4.2% (140/3,360) in 2011 to 1.1% (42/3,809) in 2014.
- Isolates with decreased susceptibility to ceftriaxone have declined from a high of 7.3% (218/2,970) in 2010 to 2.7% (101/3,809) in 2014.
- The proportion of azithromycin resistant (MIC ≥ 2 mg/L) N. gonorrhoeae isolates increased from 0.4% (11/3,106) in 2009 to 1.2% (37/3,195) in 2013. Between 2013 and 2014, azithromycin resistant isolates increased to 3.3% (127/3,809), including 38 isolates from an outbreak (ST-10567). The proportion of azithromycin resistant isolates excluding the outbreak isolates is 2.3% (89/3,809).
- The proportion of ciprofloxacin resistant N. gonorrhoeae increased from 1.3% (59/4,458) in 2000 to a high of 36.0% (1,068/2,970) in 2010 decreasing to 34.0% (1,296/3,809) in 2014.
- In 2014, 32.0% (1,219/3,809) of the isolates were resistant to erythromycin; 18.2% (693/3,809) were resistant to penicillin; 47.3% (1,809/3,809) were resistant to tetracycline.
- Since 2010, all N. gonorrhoeae isolates submitted to the NML were also analyzed by molecular genotyping using the N. gonorrhoeae multi-antigen sequence type (NG-MAST) method. In 2014, 380 different sequence types (STs) were identified among the 2,101 isolates tested and the most common sequence types wereST-2400,ST-5985 andST-10451 at 14.1%, 14.0% and 9.8%, respectively.
Introduction
Neisseria gonorrhoeae is the causative agent of gonorrhoea and is the second most commonly reported bacterial sexually transmitted infection in Canada, with 13,786 cases reported in 2013 (Public Health Agency of Canada, 2015). Rates of reported cases of gonorrhea have more than doubled from 15.0 cases per 100,000 population in 1997 to 39.3 cases per 100,000 population in 2013 (Public Health Agency of Canada, 2015). Globally, gonorrhea is a public health threat with an estimated 106 million cases each year (World Health Organization, 2012). In 2012 the World Health Organization released a global action plan to control the spread and impact of antimicrobial resistance in N. gonorrhoeae (World Health Organization, 2012) and the CDC reported drug resistant N. gonorrhoeae at an urgent hazard level, requiring serious public health attention (Centres for Disease Control and Prevention, 2013). The treatment and control of gonorrhea is complicated by the ability of N. gonorrhoeae to evolve and develop resistance to many of the antibiotics used to treat it, including penicillins, tetracyclines, macrolides and quinolones (Barry, 2009; Tapsall, 2006). The emergence of isolates with decreased susceptibilities to the cephalosporins (Golparin, 2010; Ison, 2011; Pandori, 2009; Tapsall, 2008; World Health Organization, 2011) and reports of treatment failures in Canada (Allen, 2013) and around the world raises the possibility of gonorrhea infections becoming untreatable in the future. Azithromycin resistant isolates have also been identified. The emergence of high-level azithromycin resistant (≥256 mg/L) N. gonorrhoeae has been reported internationally (Chisholm, 2009) and isolates with this high level azithromycin resistance have now been identified in Canada. In response to the increasing MICs and reports of cefixime treatment failures, the Canadian Sexually Transmitted Infection (STI) Guidelines regarding gonorrhea treatment have been updated to a combination therapy with 250 mg ceftriaxone intramuscularly and azithromycin 1 g orally as a first-line treatment for uncomplicated anogenital and pharyngeal infection in adults. Additional information on the treatment of gonococcal infection is available at http://www.phac-aspc.gc.ca/std-mts/sti-its/cgsti-ldcits/assets/pdf/section-5-6-eng.pdf.
A further challenge to the laboratories monitoring antimicrobial susceptibilities of gonorrhea is that the number of cultures available for antimicrobial susceptibility testing is on the decline due to the shift from the use of culture to nucleic acid amplification test (NAAT) for the diagnosis of gonorrhea (Figure 1). This is of concern as N. gonorrhoeae cultures are required for antimicrobial susceptibility testing and some jurisdictions in Canada no longer maintain the capacity to culture this organism. In fact, over 70% of gonococcal infections in Canada are now diagnosed using NAAT and therefore antimicrobial susceptibility data in these jurisdictions are not available.
To make improvements to the current surveillance program, the Enhanced Surveillance of Antimicrobial-Resistant Gonorrhea (ESAG) pilot was initiated in 2014. This sentinel public health practice and surveillance study for N. gonorrhoeae collects integrated practice, epidemiological and laboratory information. The objectives of the study are to determine the trends and characteristics of antimicrobial resistance in N. gonorrhoeae, antimicrobial useand treatment failure. Both antimicrobial susceptible and resistant strains of gonorrhea will be characterized in order to understand the pattern of spread of strains in various populations in Canada and to inform Canadian guidance on STI management.
The National Microbiology Laboratory (NML), in collaboration with the provincial laboratories, has been monitoring the antimicrobial susceptibilities of N. gonorrhoeae since 1985; these results inform the gonococcal infection treatment recommendations in the Canadian Guidelines on Sexually Transmitted Infections.
Methods
In 2014, provincial public health laboratories submitted a total of 2,101 viable N. gonorrhoeae isolates to the NML for antimicrobial susceptibility testing as part of the passive National Neisseria gonorrhoeae Surveillance Program (Table 1). These data are provided to indicate the overall submission rate for resistance testing from the different provinces across Canada and the overall percentage of isolates resistant to at least one antibiotic.
N. gonorrhoeae isolates are submitted to the NML primarily when the provincial laboratories identify resistance to at least one antibiotic or if the provincial laboratories do not perform any antimicrobial susceptibility testing. Submission of isolates is voluntary and is not standardized across the country. The overall interpretation of the results is difficult due to the limitations related to the isolates available for testing. Therefore, the total number of isolates cultured in all provinces was used as the denominator to calculate resistance proportion. To standardize the susceptibility testing between laboratories, proficiency surveys were conducted semi-annually. Minimum inhibitory concentration, or MIC (the minimum concentration of antibiotic that will inhibit the growth of the organism) was determined using agar dilution, and interpretations were based on the criteria outlined in Table 2. Resistance characterization definitions are provided in Table 3.
In addition to the isolates, information on age and gender of the patient and anatomical site of infection were also submitted to the NML (Tables 4 & 5).
Isolates were characterized by plasmid profiles analysis, production of β-lactamase and the presence of tetM determinant. N. gonorrhoeae isolates were also analyzed by molecular genotyping using the N. gonorrhoeae multi-antigen sequence type (NG-MAST) method (Martin, 2004) that incorporates the amplification of the porin gene (por) and the transferrin-binding protein gene (tbpB). DNA sequences of both strands were edited, assembled and compared using DNAStar, Inc. software. The resulting sequences were submitted to the NG-MAST website to determine the sequence types (ST).
Results and Discussion
In 2014, a total of 3,809 N. gonorrhoeae isolates were cultured in public health laboratories across Canada; 2,101 of these were submitted to the NML and found viable for antimicrobial susceptibility testing. A total of 1,955 of submitted isolates were found to be resistant to at least one antibiotic tested representing an increase from 36.1% (1,153/3,195) in 2013 to 51.3% (1,995/3,809) in 2014 (Figure 1). The characterization of each resistant N. gonorrhoeae isolate is provided in Appendix B. Of all the gonorrhea cases reported in 2014 (approximated at over 13,000 cases), approximately 70% were diagnosed by NAAT for which there is no antimicrobial susceptibility data.
Gender and age data were available for 99.8% (2,098/2,101) of isolates tested at the NML (Table 4). Of these, 87.4% (1,833/2,098) were males ranging from infant to 83 years of age. A total of 12.6% (265/2,098) of isolates were from females ranging from infancy to 71 years.
Anatomic source data was available for 99.8% (2,098/2,101) of the isolates sent to the NML (Table 5). Of these, 50.2% (1,053/2,098) were urethral, 23.4% (490/2,098) were rectal, 14.8% (311/2,098) were from the throat, 6.3% (133/2,098) were cervical, 3.0% (62/2,098) were vaginal and 2.1% (44/2,098) were from other sources. Three infants and 1 child were diagnosed with gonorrhea of the eye.
Figure 1. Neisseria gonorrhoeae Isolates in Canada, 2010 to 2014Figure 1 note a

Description - Figure 1
Stacked column graph showing the number of Neisseria gonorrhoeae isolates in Canada from 2000 to 2014. The horizontal axis represents the year with the total number of cases of gonorrhea reported in brackets. The vertical axis represents the number of cases.
| Gonorrhea cases | Year | ||||||||||||||
|---|---|---|---|---|---|---|---|---|---|---|---|---|---|---|---|
| 2000 | 2001 | 2002 | 2003 | 2004 | 2005 | 2006 | 2007 | 2008 | 2009 | 2010 | 2011 | 2012 | 2013 | 2014 | |
| Number of gonorrhea cases diagnosed by nucleic acid amplification testing (NAAT) | 1,731 | 2,165 | 2,900 | 4,006 | 5,299 | 5,580 | 7,133 | 7,598 | 8,816 | 8,072 | 8,427 | 8,034 | 9,525 | 8,805 | 9,977 |
| Number of gonorrhea cases diagnosed by culture and found susceptible by provincial labaoratories | 3,366 | 3,491 | 3,539 | 3,532 | 3,216 | 2,714 | 2,729 | 2,880 | 2,978 | 2,233 | 1,832 | 2,284 | 2,049 | 2,042 | 1,814 |
| Number of gonorrhea cases diagnosed by culture and found resistant by provincial laboratories and confirmed by NML | 1,092 | 1,100 | 926 | 703 | 802 | 905 | 1,472 | 1,395 | 929 | 873 | 1,138 | 1,076 | 987 | 1,153 | 1,995 |
| Total | 6,189 | 6,756 | 7,365 | 8,241 | 9,317 | 9,199 | 11,334 | 11,873 | 12,723 | 11,178 | 11,397 | 11,394 | 12,561 | 13,786 | 13,786 |
Trends in Antimicrobial Sensitivies
In 2014, 12.6% (480/3,809) of isolates were classified as Chromosomal Mediated Resistant Neisseria gonorrhoeae (CMRNG), while the plasmid-mediated resistant strains occurred at lower rates. Penicillinase Producing Neisseria gonorrhoeae (PPNG) accounted for 1.4% (52/3,809) and Tetracycline Resistant Neisseria gonorrhoeae (TRNG) for 10.7% (406/3,809) of isolates (Figure 2).
Figure 2. Trends of PPNG, TRNG, CMRNG, Probable CMRNG Neisseria gonorrhoeae in Canada from 2010 to 2014Figure 2 note a

Description - Figure 2
Line graph showing the percentage of PPNG, TRNG, PPNG/TRNG, PPNG/CMRNG, TRNG/CMRNG, CMRNG and Probable CMRNG each year with the total number of isolates tested nationally as the denominator. The horizontal axis represents the year and the vertical axis represents the percentage. The lines represent each of the characterizations.
| Characterization | Year | ||||
|---|---|---|---|---|---|
| 2010 | 2011 | 2012 | 2013 | 2014 | |
| PPNG | 0.71% | 0.54% | 0.59% | 0.88% | 1.37% |
| TRNG | 1.72% | 2.56% | 3.39% | 5.48% | 10.68% |
| PPNG/TRNG | 1.41% | 3.1% | 2.70% | 3.13% | 2.86% |
| PPNG/CMRNG | 0.1% | 0.27% | 0.40% | 0.25% | 0.32% |
| TRNG/CMRNG | 0.07% | 0.12% | 0.20% | 0.19% | 0.26% |
| CMRNG | 21.82% | 17.68% | 15.28% | 13.08% | 12.60% |
| Probable CMRNG | 7.64% | 3.75% | 4.61% | 6.35% | 9.71% |
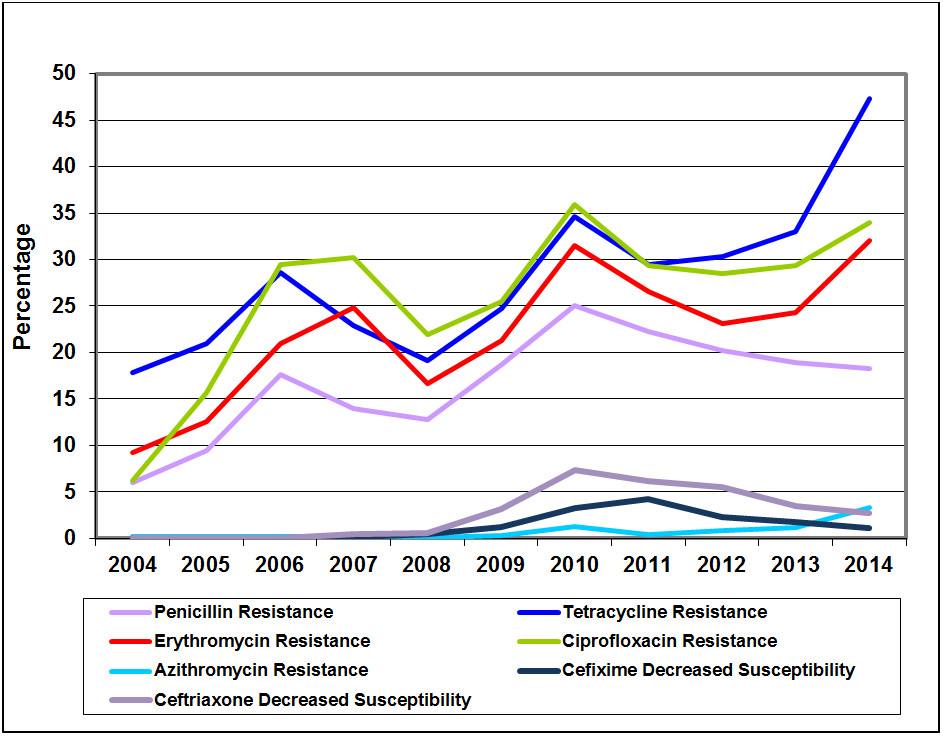
Figure 3 shows the trends of antimicrobial susceptibilities of N. gonorrhoeae tested in Canada from 2004 to 2014.
Penicillin resistance increased from 6.0% (242/4,018) in 2004, to 25.1% (744/2,970) in 2010 and then decreased to 18.2% (693/3,809) in 2014. Tetracycline resistance increased from 17.8% (715/4,018) in 2004 to 34.6% (1,028/2,970) in 2010. Between 2013 and 2014, tetracycline resistance increased from 33.0% (1054/3,195) to 47.3% (1,803/3,809). In 2004, only 9.3% (373/4,018) of Canadian isolates were found to be erythromycin resistant. This percentage increased to 32.0% (1,219/3,809) in 2014. The percentage of ciprofloxacin resistant isolates increased from 6.3% (251/4,018) in 2004 to 34.0% (1,296/3,809) in 2014. Azithromycin resistant N. gonorrhoeae have been slowly increasing since 2011 when it was 0.4% (13/3,360) to 1.2% (37/3,195) in 2013. In 2014, the proportion increased to 3.3% (127/3,809). The 2014 percentages of cefixime and ceftriaxone decreased susceptibility [1.1% (42/3,809) and 2.7% (101/3,809), respectively] are higher than they were in 2008 [0.5% (18/3,907) and 0.6% (24/3,907), respectively] but have decreased since 2011 [4.2% (140/3,360) and 6.2% (208/3,360), respectively]. Of the 6,706 viable isolates tested at NML between 2010 and 2014, none showed resistance to spectinomycin.
Figure 3. Trends of Antimicrobial Susceptibilities of Neisseria gonorrhoeae Tested in Canada, 2004-2014Figure 3 note a
Description - Figure 3
Line graph showing the proportion of resistant Neisseria gonorrhoeae isolates with each line representing an antibiotic and the number of isolates tested nationally as the denominator. The horizontal axis represents the year and the vertical axis represents the percentage.
| Antibiotic | Year | ||||||||||
|---|---|---|---|---|---|---|---|---|---|---|---|
| 2004 | 2005 | 2006 | 2007 | 2008 | 2009 | 2010 | 2011 | 2012 | 2013 | 2014 | |
| Penicillin Resistance | 6.02% | 9.42% | 17.59% | 13.94% | 12.8% | 18.7% | 25.05% | 22.2% | 20.26% | 18.94% | 18.22% |
| Tetracycline Resistance | 17.79% | 20.92% | 28.59% | 22.88% | 19.09% | 24.7% | 34.61% | 29.4% | 30.3% | 32.99% | 47.34% |
| Erythromycin Resistance | 9.28% | 12.54% | 20.92% | 24.89% | 16.7% | 21.3% | 31.52% | 26.6% | 23.12% | 24.32% | 32.00% |
| Ciprofloxacin Resistance | 6.25% | 15.67% | 29.42% | 30.2% | 21.96% | 25.5% | 35.93% | 29.3% | 28.52% | 29.33% | 34.02% |
| Azithromycin Resistance | 0.15% | 0.22% | 0.19% | 0.16% | 0.13% | 0.35% | 1.25% | 0.39% | 0.86% | 1.16% | 3.33% |
| Cefixime Decreased Susceptibility | 0.07% | 0% | 0.07% | 0.09% | 0.46% | 1.19% | 3.3% | 4.2% | 2.24% | 1.75% | 1.10% |
| Ceftriaxone Decreased Susceptibility | 0% | 0% | 0.019% | 0.42% | 0.6% | 3.12% | 7.34% | 6.2% | 5.53% | 3.51% | 2.68% |
Third Generation Cephalosporins
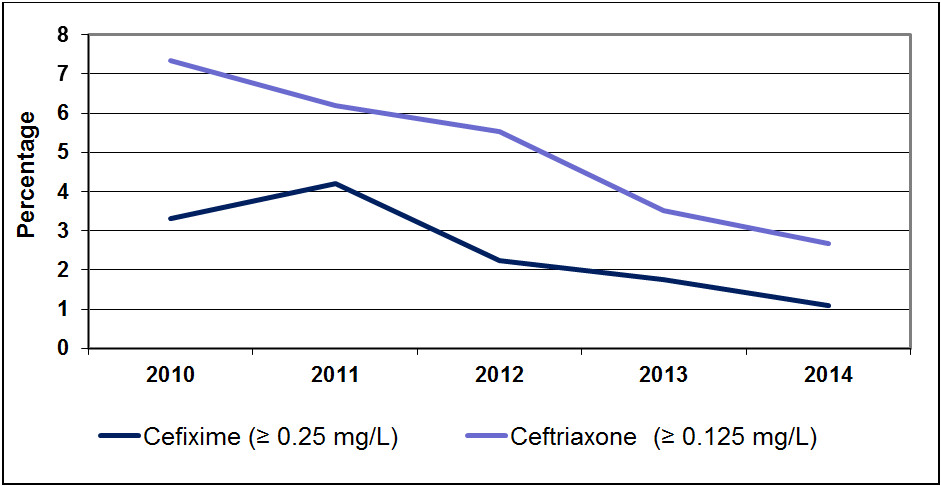
In 2014, the downward trend of isolates with decreased susceptibilities to cephalosporins continued. According to WHO (2012) definitions (isolates with MICs ≥ 0.25 mg/L for cefixime and ≥ 0.125 mg/L for ceftriaxone have decreased susceptibility), 1.1% of isolates (42/3,809) were identified as having decreased susceptibility to cefixime and 2.7% (101/3,809) were identified as having decreased susceptibility to ceftriaxone (Figure 4).
In 2014, 3.1% of isolates (119/3,809) were identified with decreased susceptibility to ceftriaxone and/or cefixime decreasing from 5.9% in 2012 (179/3,036) and 7.6% in 2011 (254/3,360).
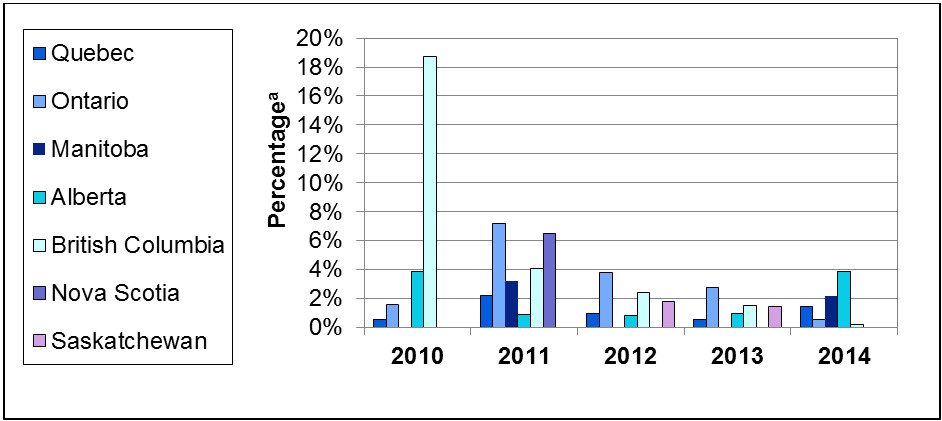
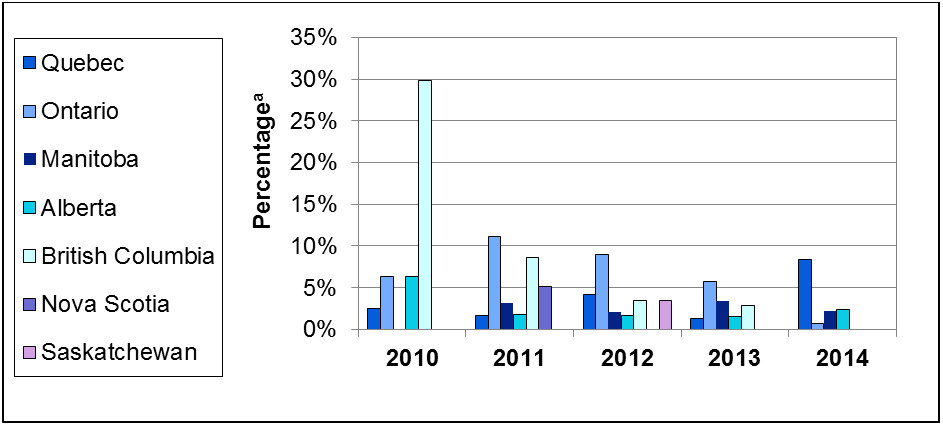
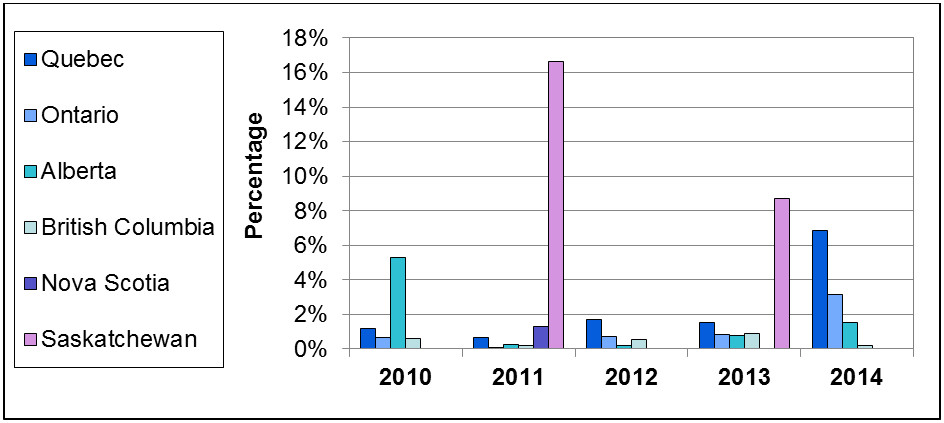
The geographical distribution of N. gonorrhoeae isolates with decreased susceptibility to cefixime and ceftriaxone within Canada are represented in Figures 5 and 6 and in Tables 6 and 7.
In 2010 and 2011, the modal MIC for cefixime was 0.125 mg/L. This decreased to 0.032 mg/L In 2014. The ceftriaxone modal MIC has remained at 0.063 mg/L from 2010 thru 2013 but decreased to 0.032 mg/L in 2014 (Figures 7-10, Tables 8 and 9).
Figure 4. Neisseria gonorrhoeae Isolates Tested by the NML between 2010 and 2014 with Decreased Susceptibility to Cefixime and CeftriaxoneFigure 4 note a
Description - Figure 4
Line graph demonstrating the proportion of Neisseria gonorrhoeae isolated in Canada with decreased susceptibility to cefixime and ceftriaxone (each antibiotic represented by its own line). The denominator used is the number of isolates tested nationally. The horizontal axis represents the year and the vertical axis represents the percentage.
| Antibiotic (MIC dilution) | Year | ||||
|---|---|---|---|---|---|
| 2010 | 2011 | 2012 | 2013 | 2014 | |
| Cefixime (≥ 0.25 mg/L) | 3.3% | 4.2% | 2.24% | 1.75% | 1.10% |
| Ceftriaxone (≥ 0.125 mg/L) | 7.34% | 6.2% | 5.53% | 3.51% | 2.68% |
Figure 5. Geographical Distribution of Neisseria gonorrhoeae Isolates with Decreased Susceptibility to Cefixime, 2010 to 2014Figure 5 note a
Description - Figure 5
A cluster bar graph showing the geographical distribution of Neisseria gonorrhoeae isolates with decreased susceptibility to cefixime (>=0.25 mg/L). The horizontal axis shows the year, the different colored bars represent the provinces. The vertical axis represents the percentage. The denominators used to determine the percentages are the number of cultures tested in each province.
| Province | Year | ||||
|---|---|---|---|---|---|
| 2010 | 2011 | 2012 | 2013 | 2014 | |
| Quebec | 0.55% | 2.20% | 0.95% | 0.56% | 1.42% |
| Ontario | 1.54% | 7.18% | 3.78% | 2.78% | 0.51% |
| Manitoba | 0.00% | 3.23% | 0.00% | 0.00% | 2.17% |
| Alberta | 3.89% | 0.88% | 0.80% | 0.97% | 3.85% |
| British Columbia | 18.71% | 4.08% | 2.42% | 1.54% | 0.20% |
| Nova Scotia | 0.00% | 6.49% | 0.00% | 0.00% | 0.00% |
| Saskatchewan | 0.00% | 0.00% | 1.75% | 1.45% | 0.00% |
| Total No. of isolates | 98 | 10 | 68 | 56 | 42 |
Figure 6. Geographical Distribution of Neisseria gonorrhoeae Isolates with Decreased Susceptibility to Ceftriaxone, 2010 to 2014Figure 6 note a
Description - Figure 6
A cluster bar graph showing the geographical distribution of Neisseria gonorrhoeae isolates with decreased susceptibility to ceftriaxone (>=0.125 mg/L). The horizontal axis shows the year, the different colored bars represent the provinces. The vertical axis represents the percentage. The denominators used to determine the percentages are the number of cultures tested in each province.
| Province | Year | ||||
|---|---|---|---|---|---|
| 2010 | 2011 | 2012 | 2013 | 2014 | |
| Quebec | 2.45% | 1.72% | 4.18% | 1.26% | 8.40% |
| Ontario | 6.36% | 11.14% | 8.95% | 5.77% | 0.68% |
| Manitoba | 0.00% | 3.23% | 2.04% | 3.45% | 2.17% |
| Alberta | 6.36% | 1.75% | 1.61% | 1.56% | 2.35% |
| British Columbia | 29.82% | 8.57% | 3.49% | 2.86% | 0.00% |
| Nova Scotia | 0.00% | 5.19% | 0.00% | 0.00% | 0.00% |
| Saskatchewan | 0.00% | 0.00% | 3.51% | 0.00% | 0.00% |
| Total No. of isolates | 218 | 208 | 168 | 112 | 101 |
Figure 7. Trends of Cefixime Susceptibilities of Neisseria gonorrhoeae Isolates Tested by the NML from 2010 to 2014Figure 7 note a
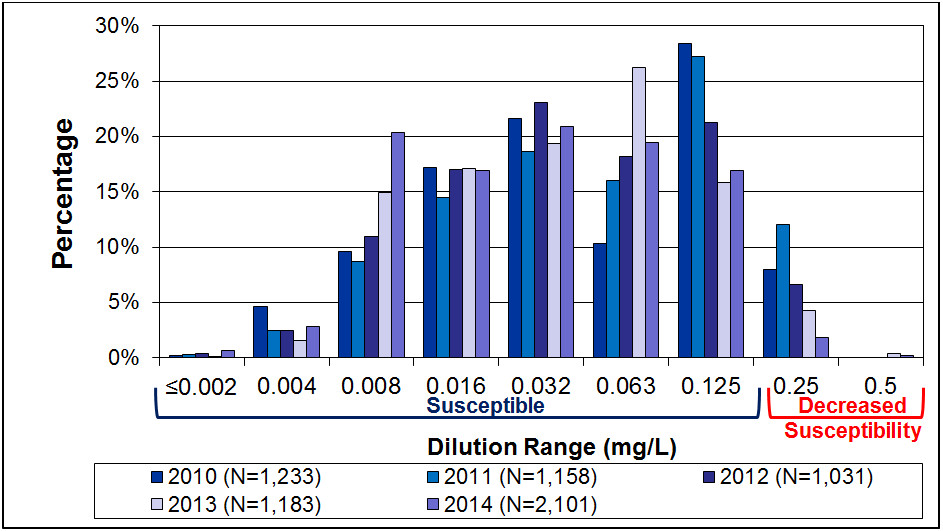
Description - Figure 7
A clustered bar chart showing the percentage of Neisseria gonorrhoeae with different minimum inhibitory concentrations (MICs) to cefixime for the years specified. Each year is represented by a different colored bar. The horizontal axis represents the dilution range of the MICs. The vertical axis represents the percentage. The denominator for calculating the percentage is the total number of viable isolates tested by the NML.
| Year | Dilutions (mg/L) | ||||||||
|---|---|---|---|---|---|---|---|---|---|
| Susceptible | Decreased Susceptibility | ||||||||
| ≤0.002 | 0.004 | 0.008 | 0.016 | 0.032 | 0.063 | 0.125 | 0.25 | 0.5 | |
| 2010 (N=1,233) |
0.25% | 4.66% | 9.65% | 17.17% | 21.59% | 10.30% | 28.37% | 8.01% | 0.00% |
| 2011 (N=1,158) |
0.35% | 2.52% | 8.67% | 14.48% | 18.65% | 16.06% | 27.20% | 12.09% | 0.00% |
| 2012 (N=1,031) |
0.39% | 2.52% | 10.94% | 17.04% | 23.08% | 18.23% | 21.24% | 6.60% | 0.00% |
| 2013 (N=1,183) |
0.08% | 1.61% | 14.96% | 17.08% | 19.36% | 26.20% | 15.89% | 4.31% | 0.42% |
| 2014 (N=2,101) |
0.67% | 2.81% | 20.37% | 16.90% | 20.89% | 19.42% | 16.94% | 1.81% | 0.19% |
Figure 8. Trends of Ceftriaxone Susceptibilities of Neisseria gonorrhoeae Isolates Tested by the NML from 2010 to 2014Figure 8 note a
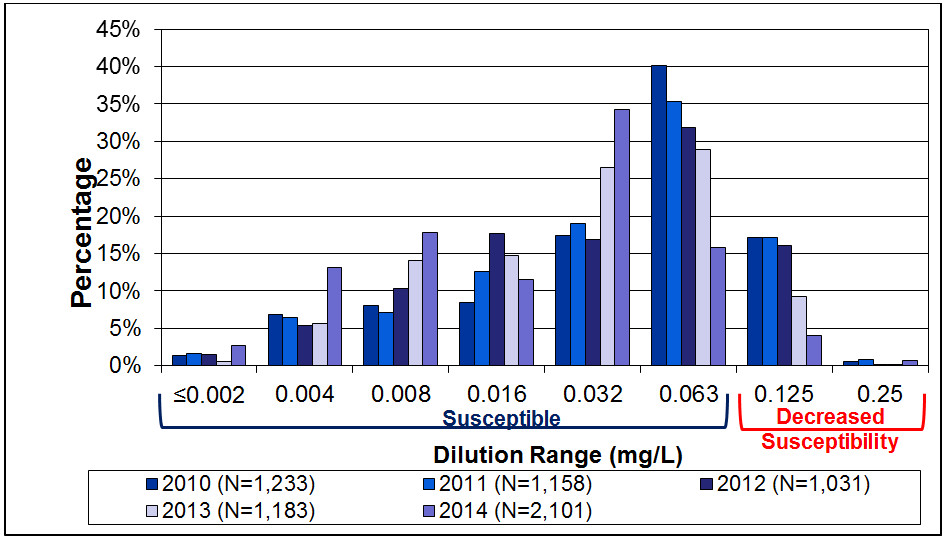
Description - Figure 8
A clustered bar chart showing the percentage of Neisseria gonorrhoeae with different minimum inhibitory concentrations (MICs) for ceftriaxone for the years specified. Each year is represented by a different colored bar. The horizontal axis represents the dilution range of the MICs. The vertical axis represents the percentage. The denominator for calculating the percentage is the total number of viable isolates tested by the NML for each year.
| Year | Dilutions (mg/L) | |||||||
|---|---|---|---|---|---|---|---|---|
| Susceptible | Decreased Susceptibility | |||||||
| ≤0.002 | 0.004 | 0.008 | 0.016 | 0.032 | 0.063 | 0.125 | 0.25 | |
| 2010 (N=1,233) |
1.39% | 6.80% | 8.11% | 8.44% | 17.38% | 40.08% | 17.21% | 0.57% |
| 2011 (N=1,158) |
1.65% | 6.42% | 7.11% | 12.58% | 18.99% | 35.30% | 17.17% | 0.78% |
| 2012 (N=1,031) |
1.55% | 5.42% | 10.26% | 17.72% | 16.94% | 31.85% | 16.07% | 0.19% |
| 2013 (N=1,183) |
0.59% | 5.66% | 14.12% | 14.71% | 26.54% | 28.91% | 9.30% | 0.17% |
| 2014 (N=2,101) |
2.66% | 13.09% | 17.75% | 11.57% | 34.27% | 15.85% | 4.05% | 0.76% |
Figure 9. Cefixime Susceptibilities of Neisseria gonorrhoeae Isolates Tested by the NML from 2010 to 2014Figure 9 note aFigure 9 note b

Description - Figure 9
A stacked bar chart for cefixime. Each whole bar represents a year. Each bar is divided to represent the percentage of isolates with a specific MIC. The horizontal axis shows the year; the vertical axis represents the percentage. The denominator used to determine the percentage is the total number of viable isolates tested by the NML.
| Dilutions (mg/L) | Year | |||||
|---|---|---|---|---|---|---|
| 2010 | 2011 | 2012 | 2013 | 2014 | ||
| 0.032 mg/L | Susceptible | 21.5% | 18.7% | 23.1% | 19.4% | 20.9% |
| 0.063 mg/L | 10.0% | 16.1% | 18.2% | 26.2% | 19.4% | |
| 0.125 mg/L | 28.1% | 27.2% | 21.2% | 15.9% | 16.9% | |
| 0.25 mg/L | Decreased Susceptibility | 8.0% | 12.1% | 6.6% | 4.3% | 1.8% |
| 0.5 mg/L | 0.0% | 0.0% | 0.0% | 0.4% | 0.2% | |
Figure 10. Ceftriaxone Susceptibilities of Neisseria gonorrhoeae Isolates Tested by the NML from 2010 to 2014Figure 10 note aFigure 10 note b
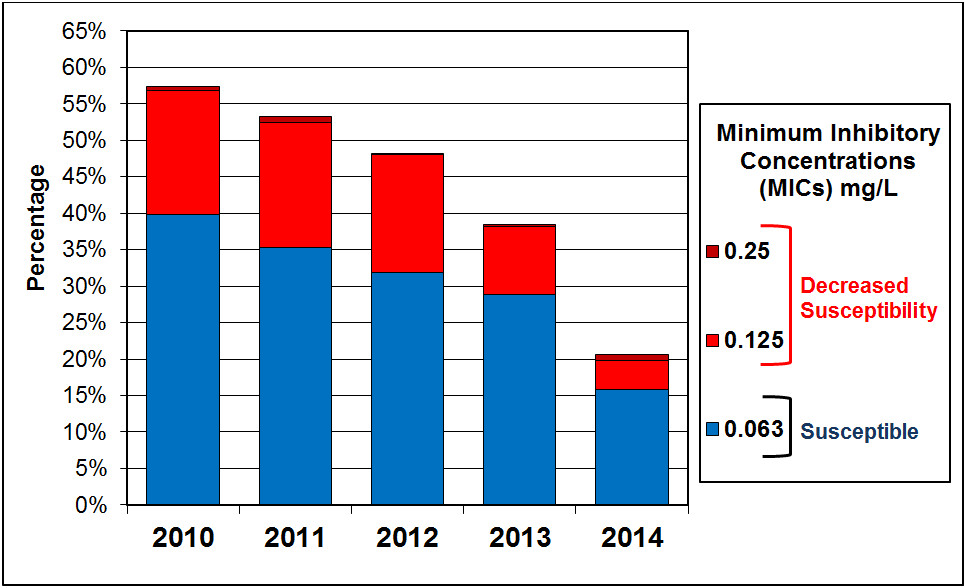
Description - Figure 10
A stacked bar chart for ceftriaxone. Each whole bar represents a year. Each bar is divided to represent the percentage of isolates with a specific MIC. The horizontal axis shows the year; the vertical axis represents the percentage. The denominator used to determine the percentage is the total number of viable isolates tested by the NML.
| Dilutions (mg/L) | Year | |||||
|---|---|---|---|---|---|---|
| 2010 | 2011 | 2012 | 2013 | 2014 | ||
| 0.063 mg/L | Susceptible | 39.8% | 35.3% | 31.9% | 28.9% | 15.8% |
| 0.125 mg/L | Decreased Susceptibility | 17.0% | 17.2% | 16.1% | 9.3% | 4.1% |
| 0.25 mg/L | 0.6% | 0.8% | 0.2% | 0.2% | 0.8% | |
Azithromycin
The distribution of azithromycin resistant isolates across Canada is represented in Figure 11 and Table 10. Azithromycin resistant N. gonorrhoeae have been slowly increasing since 2011 when it was 0.4% (13/3,360) to 1.2% (37/3,195) in 2013. In 2014, the proportion increased to 3.3% (127/3,809), including 38 isolates from an outbreak (ST-10567). The proportion of azithromycin resistant isolates excluding the outbreak isolates is 2.3% (89/3,809).
The modal MIC for azithromycin remained at 0.5 mg/L between 2010 and 2012. In 2013 and 2014, the modal MIC decreased to 0.25 mg/L (Figures 12 and 13 and Table 11). Between 2009 and 2012, five isolates with high level azithromycin resistance (MIC ≥256 mg/L) were identified in Canada.
Figure 11. Geographical Distribution of Azithromycin Resistant Neisseria gonorrhoeae Isolates, 2010 to 2014Figure 11 note a
Description - Figure 11
A cluster bar chart showing the distribution of azithromycin resistant Neisseria gonorrhoeae isolates throughout the provinces from 2009 to 2013. The horizontal axis shows the year, the different colored bars represent the provinces The vertical axis represents the percentage with the denominator being the number of cultures tested in province.
| Province | Year | ||||
|---|---|---|---|---|---|
| 2010 | 2011 | 2012 | 2013 | 2014 | |
| Quebec | 1.18% | 0.67% | 1.67% | 1.54% | 6.86% |
| Ontario | 0.64% | 0.08% | 0.74% | 0.85% | 3.17% |
| Alberta | 5.30% | 0.22% | 0.20% | 0.78% | 1.50% |
| British Columbia | 0.58% | 0.20% | 0.54% | 0.88% | 0.20% |
| Nova Scotia | 0.00% | 1.30% | 0.00% | 0.00% | 0.00% |
| Saskatchewan | 0.00% | 16.67% | 0.00% | 8.70% | 0.00% |
| Total No. of AzR isolates | 37 | 13 | 26 | 37 | 127 |
Figure 12. Trends of Azithromycin Susceptibilities of Neisseria gonorrhoeae Isolates Tested by the NML from 2010 to 2014Figure 12 note aFigure 12 note b
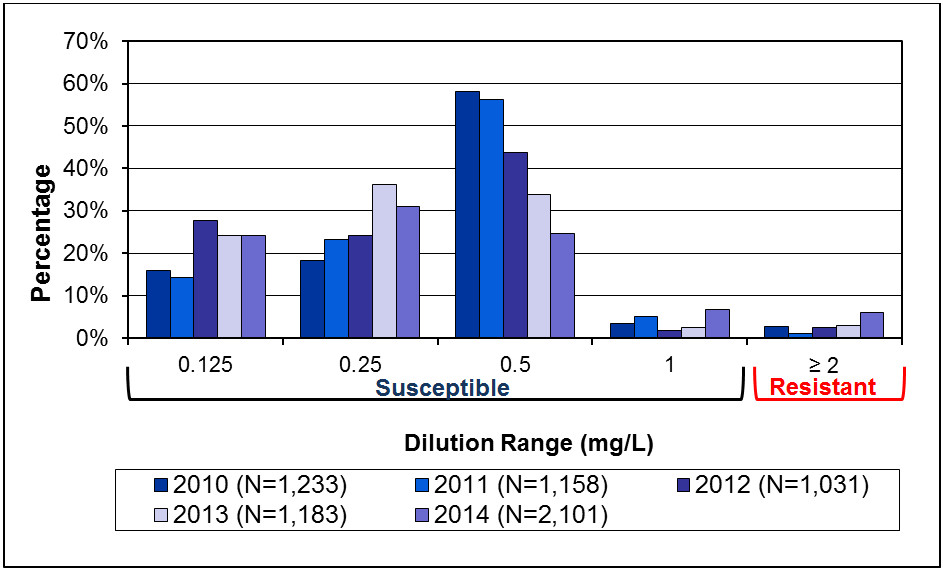
Description - Figure 12
Clustered bar chart showing the percentage of Neisseria gonorrhoeae within different minimum inhibitory concentrations (MICs) for azithromycin for the years specified. Each year is represented by a different colored bar. The horizontal axis represents the dilution range of the MICs. The vertical axis represents the percentage. The denominator for calculating the percentage is the total number of viable isolates tested by the NML for each year.
| Year | Dilution (mg/L) | ||||
|---|---|---|---|---|---|
| Susceptible | Resistant | ||||
| 0.125 | 0.25 | 0.5 | 1 | ≥2 | |
| 2010 (N=1,233) | 16.06% | 18.25% | 58.15% | 3.57% | 2.83% |
| 2011 (N=1,158) | 14.25% | 23.32% | 56.13% | 5.18% | 1.12% |
| 2012 (N=1,031) | 27.74% | 24.15% | 43.65% | 1.84% | 2.52% |
| 2013 (N=1,183) | 24.26% | 36.18% | 33.90% | 2.54% | 3.13% |
| 2014 (N=2,101) | 24.13% | 30.99% | 24.80% | 6.76% | 6.04% |
Figure 13. Azithromycin Susceptibilities of Neisseria gonorrhoeae Isolates Tested by the NML from 2010 to 2014Figure 13 note aFigure 13 note b
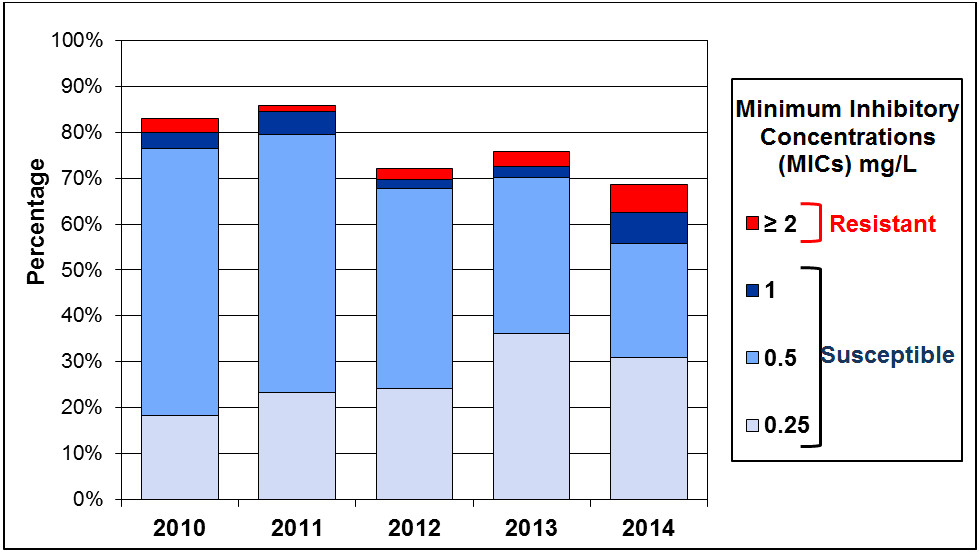
Description - Figure 13
A stacked bar chart with each whole bar representing a year. Each bar is divided into different colors which represent the percentage of isolates with a specific MIC. The horizontal axis shows the year; the vertical axis represents the percentage. The denominator used to determine the percentage is the total number of viable isolates tested by the NML.
| Dilution (mg/L) | Year | |||||
|---|---|---|---|---|---|---|
| 2010 | 2011 | 2012 | 2013 | 2014 | ||
| 0.25 mg/L | Susceptible | 18.3% | 23.3% | 24.2% | 36.2% | 31.0% |
| 0.5 mg/L | 58.2% | 56.1% | 43.7% | 33.9% | 24.8% | |
| 1 mg/L | 3.6% | 5.2% | 1.8% | 2.5% | 6.8% | |
| ≥2 mg/L | Resistant | 3.0% | 1.1% | 2.5% | 3.1% | 6.0% |
Co-Resistance - Azithromycin & Cephalosporins
In 2012, seven isolates with combined decreased susceptibility to cephalosporins and resistance to azithromycin were identified (0.2%, 7/3,036). In 2013, eight (0.3%, 8/3,195) and in 2014 only one (0.03%, 1/3,809) of these isolates were identified (Table 12). These are the first isolates to emerge in Canada with both decreased susceptibility to cephalosporins and resistance to azithromycin thus possibly threatening the success of currently recommended dual therapy treatment options.
Ciprofloxacin
The percentage of ciprofloxacin resistant isolates increased from 29.3% (937/3,195) in 2013 to 34.0% (1,296/3,809) in 2014. Percentages for each province are represented in Figure 14 and Table 13. Of the 1,296 ciprofloxacin resistant isolates identified in 2014, 96.8% (1,255/1,296) were also resistant to at least one other antibiotic; 34.5% (447/1,296) were characterized as CMRNG.
Figure 14. Geographical Distribution of Ciprofloxacin Resistant Neisseria gonorrhoeae Isolates, 2010 to 2014Figure 14 note a

Description - Figure 14
A cluster bar chart showing the distribution of ciprofloxacin resistant Neisseria gonorrhoeae isolates throughout the provinces from 2010 to 2014. The horizontal axis shows the year, the different colored bars represent the provinces The vertical axis represents the percentage with the denominator being the number of cultures tested in province.
| Province | Year | ||||
|---|---|---|---|---|---|
| 2010 | 2011 | 2012 | 2013 | 2014 | |
| Quebec | 26.64% | 24.59% | 41.41% | 38.55% | 36.82% |
| Ontario | 32.70% | 33.09% | 29.23% | 30.91% | 39.05% |
| Manitoba | 41.67% | 32.26% | 10.20% | 13.79% | 43.48% |
| Alberta | 49.47% | 28.88% | 13.08% | 16.15% | 28.85% |
| British Columbia | 71.05% | 33.27% | 22.04% | 24.23% | 20.73% |
| Nova Scotia | 7.25% | 22.08% | 0.00% | 0.00% | 0.00% |
| New Brunswick | 55.56% | 0.00% | 33.33% | 60.00% | 33.33% |
| Saskatchewan | 25.71% | 14.29% | 15.79% | 36.23% | 9.89% |
| Newfoundland | 42.86% | 0.00% | 0.00% | 100.00% | 11.11% |
| Prince Edward Island | 0.00% | 0.00% | 100.00% | 50.00% | 0.00% |
| Total No. of CipR isolates | 1,068 | 985 | 866 | 937 | 1,296 |
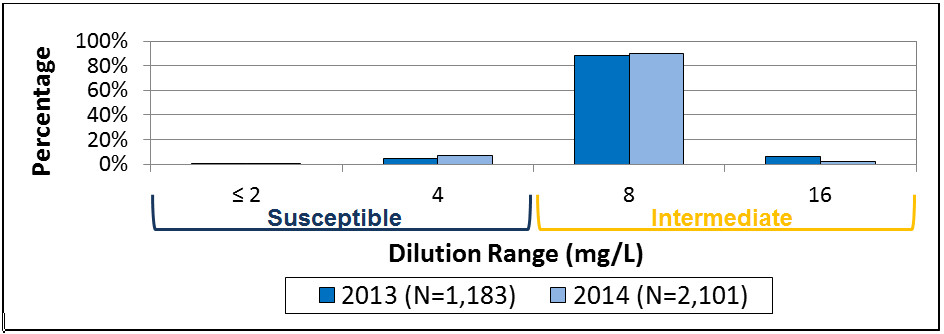
Figure 15. Trends of Ciprofloxacin Susceptibilities of Neisseria gonorrhoeae Isolates Tested by the NML from 2010 to 2014Figure 15 note a
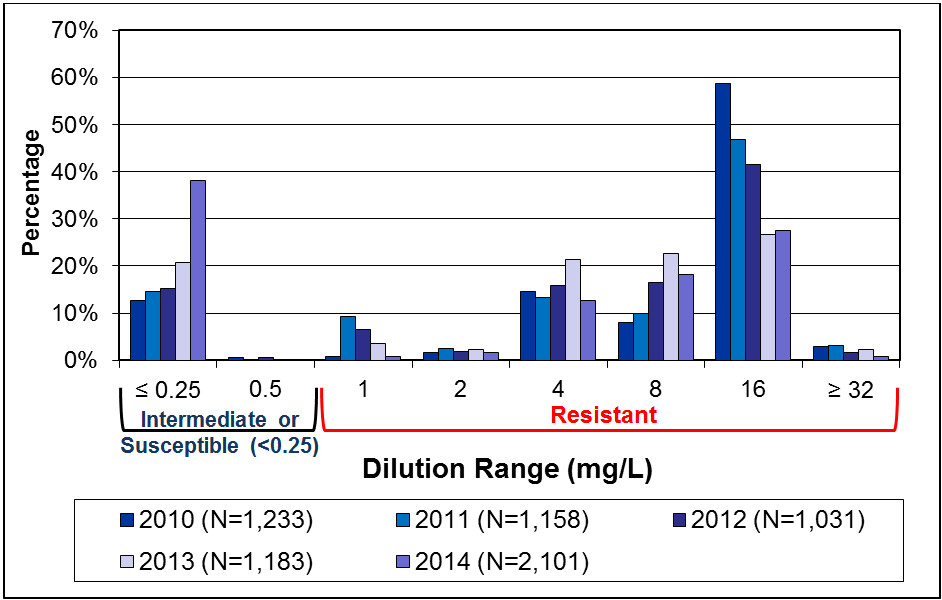
Description - Figure 15
A clustered bar chart showing the percentage of Neisseria gonorrhoeae within specific minimum inhibitory concentrations (MICs) for ciprofloxacin for the years specified. Each year is represented by a different colored bar. The horizontal axis represents the dilution range of the MICs. The vertical axis represents the percentage. The denominator for calculating the percentage is the total number of viable isolates tested by the NML for each year.
| Year | Dilution Range (mg/L) | |||||||
|---|---|---|---|---|---|---|---|---|
| Intermediate or Susceptible | Resistant | |||||||
| ≤ 0.25 | 0.5 | 1 | 2 | 4 | 8 | 16 | ≥ 32 | |
| 2010 (N=1,233) | 12.57% | 0.57% | 0.73% | 1.62% | 14.60% | 8.03% | 58.64% | 3.00% |
| 2011 (N=1,158) | 14.68% | 0.26% | 9.24% | 2.59% | 13.39% | 9.84% | 46.80% | 3.20% |
| 2012 (N=1,031) | 15.32% | 0.68% | 6.60% | 1.94% | 15.91% | 16.49% | 41.51% | 1.55% |
| 2013 (N=1,183) | 20.78% | 0.00% | 3.63% | 2.37% | 21.39% | 22.74% | 26.71% | 2.36% |
| 2014 (N=2,101) | 38.18% | 0.14% | 0.76% | 1.71% | 12.71% | 18.09% | 27.61% | 0.81% |
Ertapenem
The NML began testing ertapenem in 2012. In both 2013 and 2014, the ertapenem modal MIC was 0.063 mg/L (Figure 16).
Although there are no official MIC interpretative standards for N. gonorrhoeae for ertapenem, Unemo (2009) suggests that an ertapenem MIC of 0.032 mg/L is susceptible (S), and ertapenem MICs of 0.064 mg/L and 0.125 mg/L are not susceptible (NS).
Figure 16. Trends of Ertapenem Susceptibilities of Neisseria gonorrhoeae Isolates Tested by the NML from 2013 to 2014Figure 16 note a
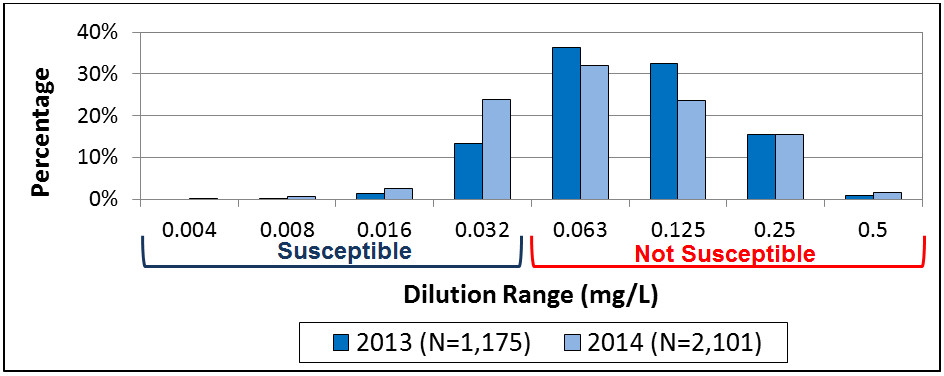
Description - Figure 16
Clustered bar chart with each year represented by a different colored bar. The horizontal axis represents the dilution range of the MICs. The vertical axis represents the percentage. The denominator for calculating the percentage is the total number of viable isolates tested by the NML for each year.
| Year | Dilution Range (mg/L) | |||||||
|---|---|---|---|---|---|---|---|---|
| Susceptible | Not Susceptible | |||||||
| 0.004 | 0.008 | 0.016 | 0.032 | 0.063 | 0.125 | 0.25 | 0.5 | |
| 2013 (N=1,175) | 0.00% | 0.26% | 1.45% | 13.28% | 36.26% | 32.43% | 15.40% | 0.94% |
| 2014 (N=2,101) | 0.24% | 0.57% | 2.52% | 23.75% | 32.08% | 23.70% | 15.52% | 1.57% |
Gentamicin
The NML began testing gentamicin in 2012. The gentamicin modal MIC for all isolates tested from 2013 to 2014 is 8 mg/L (Figure 17).
Although there are no official MIC interpretative standards for N. gonorrhoeae gentamicin, Brown (2010) used the following criteria for gentamicin: R >=32 mg/L, I from 8 to 16 mg/L and S<=4 mg/L based on the Daly (1997) study.
Figure 17. Trends of Gentamicin Susceptibilities of Neisseria gonorrhoeae Isolates Tested by the NML from 2013 to 2014Figure 17 note a
Description - Figure 17
Clustered bar chart with each year represented by a different colored bar. The horizontal axis represents the dilution range of the MICs. The vertical axis represents the percentage. The denominator for calculating the percentage is the total number of viable isolates tested by the NML for each year.
| Year | Dilution Range (mg/L) | |||
|---|---|---|---|---|
| Susceptible | Intermediate | |||
| 2 | 4 | 8 | 16 | |
| 2013 (N=1,183) | 0.08% | 4.90% | 88.59% | 6.42% |
| 2014 (N=2,101) | 0.33% | 7.00% | 90.15% | 2.52% |
Neisseria gonorrhoeae Multi-antigen Sequencing (NG-MAST)
NG-MAST molecular-based sequence typing provides a substantial level of discrimination between isolates. In 2014, the most common sequence types (STs) identified by the NML wereST-2400 [14.1% (296/2,101)], ST-5985 [14.0% (294/2,101)] andST-10451 [9.8% (205/2,101)] (Figure 18).
Canadian isolates identified in 2014 that are highly related toST-2400 (Figure 24) include ST-6360 (n=28),ST-8115 (n=7),ST-8030 (n=6) plus 19 other STs with one to four isolates in each for a total of 371 or 17.7% of isolates in theST-2400 genogroup, (STs with tbpB-563 and por alleles within 2 nucleotide base pairs of the por allele ofST-2400). Isolates of this genogroup are resistant to multiple drugs with 44.2% (164/371) and 28.6% (106/371) being Probable CMRNG and CMRNG, respectively. All of these isolates are resistant to ciprofloxacin and 19.1% (71/371) have decreased susceptibility to cefixime and/or ceftriaxone. Only 1.1% (4/371) are resistant to azithromycin (Figure 22).
ST-5985 increased in prevalence from 0.6% in 2012 to 6.1% in 2013 and then to 14.0% in 2014 (Figure 19).ST-10131 (n=15),ST-11348 (n=5) andST-10590 (n=2) plus 9 other single ST types differ fromST-5985 by only 1 base pair (Figure 24) for a total of 325 (15.5%) isolates in theST-5985 genogroup. Isolates of this genogroup are primarily TRNGs [98.5% (320/325)] with 0.9% (3/325) being TRNG and resistant to another antibiotic.
ST-10451, the 3rd most prevalent ST in 2014 (9.8%), is only 1 base pair different thanST-1407 and isolates have similar antimicrobial resistance profiles (Figure 24).ST-1407 is an internationally identified clone that has been described as a superbug, harboring high-level resistance to cephalosporins and is threatening the last recommended first-line therapy options for gonorrhea treatment (Allen, 2013; Unemo, 2010; Unemo, 2011; Unemo, 2012). ST-1407 was the prevalent ST in 2010, 2011 and 2012. In 2013, only 4.6% (54/1,183) and in 2014 only 2.2% (47/2,101) of isolates were identified asST-1407 (Figure 19). As mentioned previously,ST-10451 is highly related toST-1407, as isST-11765 (n=11),ST-6899 (n=8),ST-3158 (n=4) andST-3148 (n=3) plus 12 other STs with one to three isolates in each. These highly related isolates are all characterized with the tbpB-110 allele and have por alleles that differ by up to 4 nucleotide base pairs. A total of 13.9% of isolates (293/2,101) were eitherST-1407 or highly related sub-types ofST-1407. This percentage is slightly higher than 2013 (11.2%) but has decreased since 2012 which had 23.6% (243/1,031) of isolates within theST-1407 genogroup. The isolates in 2014'sST-1407 genogroup are primarily CMRNG [68.3% (200/293)] and Probable CMRNG [27.6% (81/293)]. All are resistant to ciprofloxacin. Only 2.4% (7/293) of isolates in thisST-1407 genogroup had decreased susceptibility to cefixime and/or ceftriaxone however, 18.8% (55/293) of them were resistant to azithromycin (Figure 22).
Distribution of STs within provinces is represented in Figures 20 and 21. ST-2400 was identified in 4 provinces including QC [48.3% (143/296)], ON [42.9% (127/296)], BC [5.1% (15/296)] and AB [3.7% (11/296)]. ST-5985, the next most prevalent ST type, was identified in BC [60.4% (177/293)], then ON [21.5% (63/293)], AB [14.7% (43/293)], SK [3.4% (10/293)] and MB [0.3% (1/293)]. ST-10451 was identified primarily in ON [96.6% (198/205)], then QC [2.9% (6/205)], and AB [0.5% (1/205)].
Figure 18. Prevalent NG-MAST Sequence Type Distribution of Neisseria gonorrhoeae Isolates Tested by the NML, 2014; N=2,101Figure 18 note a
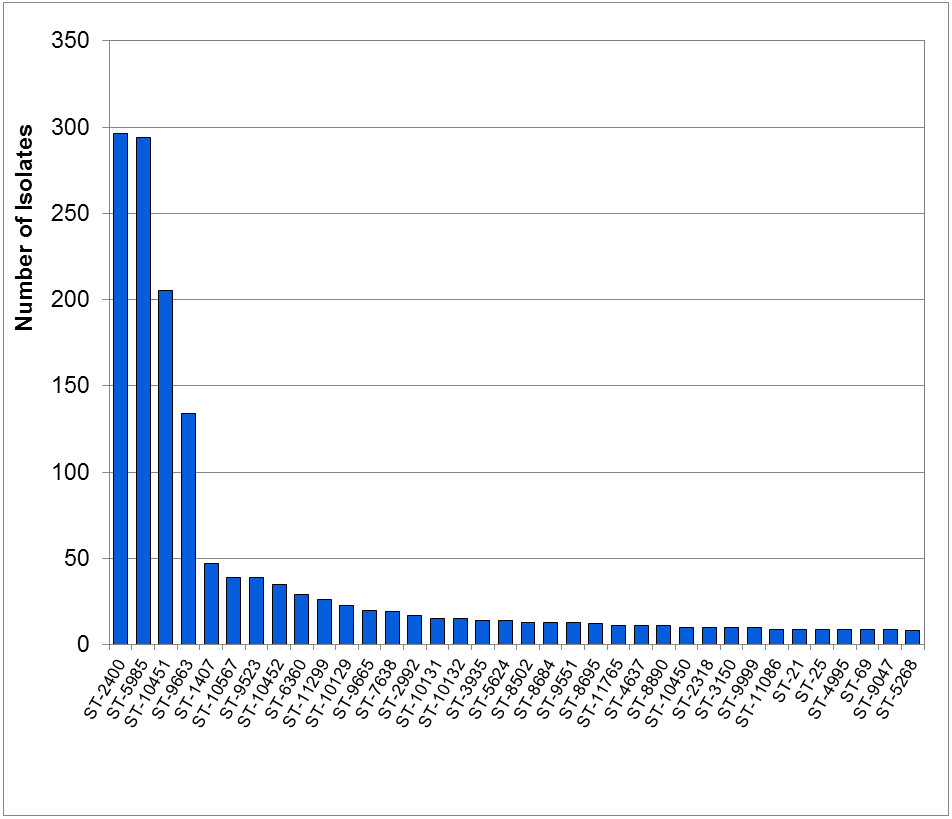
Description - Figure 18
A bar chart demonstrating the distribution of Neisseria gonorrhoeae isolates within the most prevalent sequence types (STs). Thirty-six different STs are along the horizontal axis and the vertical axis represents the number of isolates.
| NG-MAST | No. of isolates |
|---|---|
| ST-2400 | 296 |
| ST-5985 | 294 |
| ST-10451 | 205 |
| ST-9663 | 134 |
| ST-1407 | 47 |
| ST-10567 | 39 |
| ST-9523 | 39 |
| ST-10452 | 35 |
| ST-6360 | 29 |
| ST-11299 | 26 |
| ST-10129 | 23 |
| ST-9665 | 20 |
| ST-7638 | 19 |
| ST-2992 | 17 |
| ST-10131 | 15 |
| ST-10132 | 15 |
| ST-3935 | 14 |
| ST-5624 | 14 |
| ST-8502 | 13 |
| ST-8684 | 13 |
| ST-9551 | 13 |
| ST-8695 | 12 |
| ST-11765 | 11 |
| ST-4637 | 11 |
| ST-8890 | 11 |
| ST-10450 | 10 |
| ST-2318 | 10 |
| ST-3150 | 10 |
| ST-9999 | 10 |
| ST-11086 | 9 |
| ST-21 | 9 |
| ST-25 | 9 |
| ST-4995 | 9 |
| ST-69 | 9 |
| ST-9047 | 9 |
| ST-5268 | 8 |
Figure 19. Trends of Prevalent NG-MAST Sequence Types of Neisseria gonorrhoeae Isolates Tested by NML, 2010 - 2014Figure 19 note a
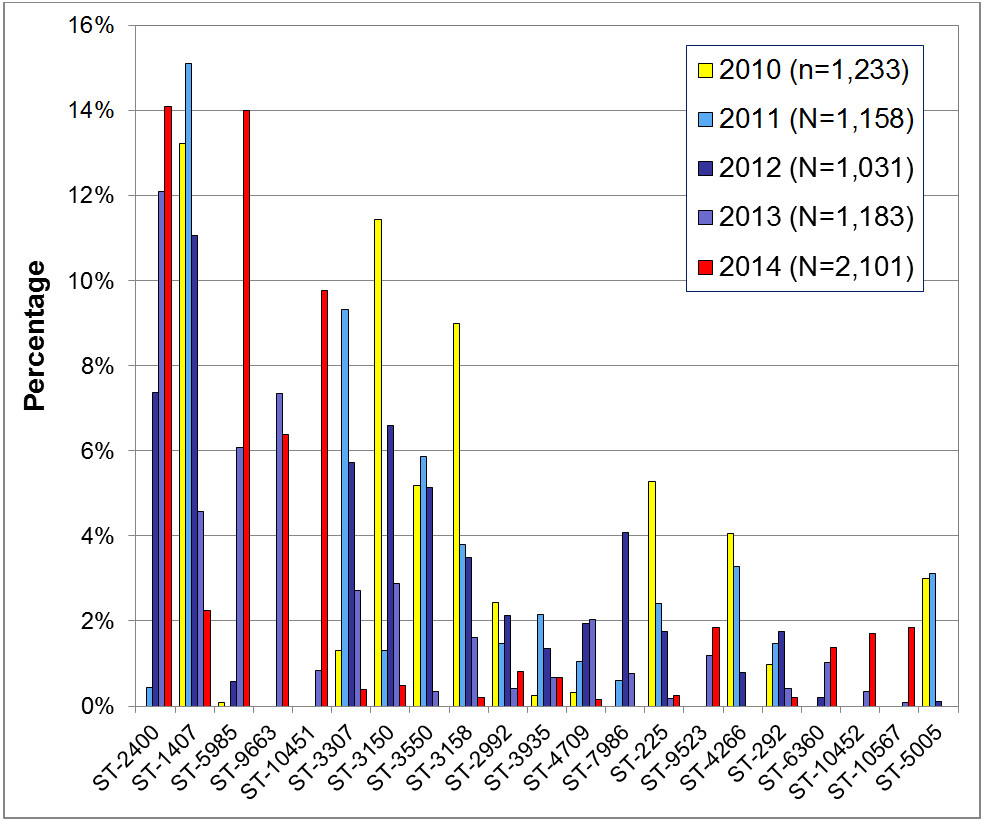
Description - Figure 19
A clustered bar chart showing the percentage of Neisseria gonorrhoeae with specific sequence types for the years specified. Each year is represented by a different colored bar. The horizontal axis represents the different STs. The vertical axis represents the percentage. The denominator for calculating the percentage is the total number of viable isolates tested by the NML for each year.
| NG-MAST | 2010 (N=1,233) |
2011 (N=1,158) |
2012 (N=1,031) |
2013 (N=1,183) |
2014 (N=2,101) |
|---|---|---|---|---|---|
| ST-2400 | 0.00% | 0.43% | 7.37% | 12.09% | 14.09% |
| ST-1407 | 13.22% | 15.11% | 11.06% | 4.56% | 2.24% |
| ST-5985 | 0.08% | 0.00% | 0.58% | 6.09% | 13.99% |
| ST-9663 | 0.00% | 0.00% | 0.00% | 7.35% | 6.38% |
| ST-10451 | 0.00% | 0.00% | 0.00% | 0.85% | 9.76% |
| ST-3307 | 1.30% | 9.33% | 5.72% | 2.70% | 0.38% |
| ST-3150 | 11.44% | 1.30% | 6.60% | 2.87% | 0.48% |
| ST-3550 | 5.19% | 5.87% | 5.14% | 0.34% | 0.00% |
| ST-3158 | 9.00% | 3.80% | 3.49% | 1.61% | 0.19% |
| ST-2992 | 2.43% | 1.47% | 2.13% | 0.42% | 0.81% |
| ST-3935 | 0.24% | 2.16% | 1.36% | 0.68% | 0.67% |
| ST-4709 | 0.32% | 1.04% | 1.94% | 2.03% | 0.14% |
| ST-7986 | 0.00% | 0.60% | 4.07% | 0.76% | 0.00% |
| ST-225 | 5.27% | 2.42% | 1.75% | 0.17% | 0.24% |
| ST-9523 | 0.00% | 0.00% | 0.00% | 1.18% | 1.86% |
| ST-4266 | 4.06% | 3.28% | 0.78% | 0.00% | 0.00% |
| ST-292 | 0.97% | 1.47% | 1.75% | 0.42% | 0.19% |
| ST-6360 | 0.00% | 0.00% | 0.19% | 1.01% | 1.38% |
| ST-10452 | 0.00% | 0.00% | 0.00% | 0.34% | 1.71% |
| ST-10567 | 0.00% | 0.00% | 0.00% | 0.08% | 1.86% |
| ST-5005 | 3.00% | 3.11% | 0.10% | 0.00% | 0.00% |
Figure 20. Provincial Distribution within Neisseria gonorrhoeae NG-MAST Sequence Types, 2014; N=2,101Figure 20 note a
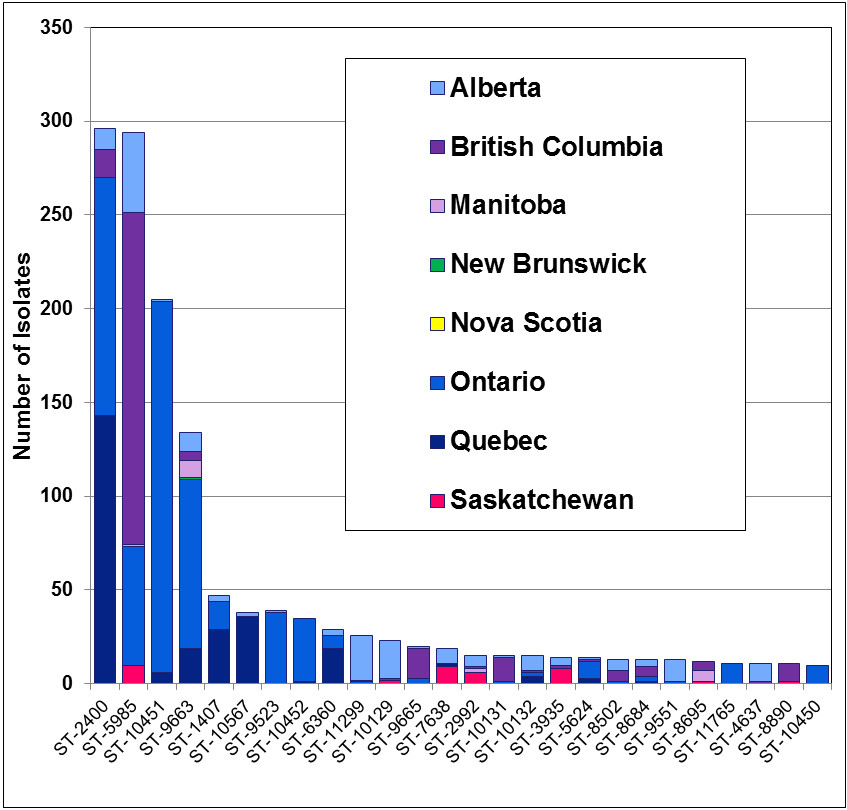
Description - Figure 20
A stacked bar chart demonstrating the number of Neisseria gonorrhoeae isolates from different provinces within the most prevalent sequence types. The horizontal axis is labelled with the different STs. The vertical axis represents the number of isolates. Each bar represents a different ST and is divided into different colors corresponding to different provinces.
| NG-MAST | Alberta | British Columbia | Manitoba | New Brunswick | Nova Scotia | Newfoundland | Ontario | Quebec | Saskatchewan |
|---|---|---|---|---|---|---|---|---|---|
| ST-2400 | 11 | 15 | 127 | 143 | |||||
| ST-5985 | 43 | 177 | 1 | 63 | 10 | ||||
| ST-10451 | 1 | 198 | 6 | ||||||
| ST-9663 | 10 | 5 | 9 | 1 | 90 | 19 | |||
| ST-1407 | 3 | 15 | 29 | ||||||
| ST-10567 | 2 | 1 | 36 | ||||||
| ST-9523 | 1 | 38 | |||||||
| ST-10452 | 34 | 1 | |||||||
| ST-6360 | 3 | 7 | 19 | ||||||
| ST-11299 | 24 | 1 | 1 | ||||||
| ST-10129 | 20 | 1 | 2 | ||||||
| ST-9665 | 1 | 16 | 3 | ||||||
| ST-7638 | 8 | 2 | 9 | ||||||
| ST-2992 | 6 | 1 | 2 | 2 | 6 | ||||
| ST-10131 | 1 | 13 | 1 | ||||||
| ST-10132 | 8 | 1 | 2 | 4 | |||||
| ST-3935 | 4 | 2 | 8 | ||||||
| ST-5624 | 1 | 1 | 9 | 3 | |||||
| ST-8502 | 6 | 6 | 1 | ||||||
| ST-8684 | 4 | 5 | 3 | 1 | |||||
| ST-9551 | 12 | 1 | |||||||
| ST-8695 | 5 | 6 | 1 | ||||||
| ST-11765 | 11 | ||||||||
| ST-4637 | 10 | 1 | |||||||
| ST-8890 | 10 | 1 | |||||||
| ST-10450 | 10 |
Figure 21. Distribution of Neisseria gonorrhoeae NG-MAST Sequence Types within Provinces, 2014; N=2,101Figure 21 note a
Figure 21a. Distribution of NG-MAST within Alberta (N=339)
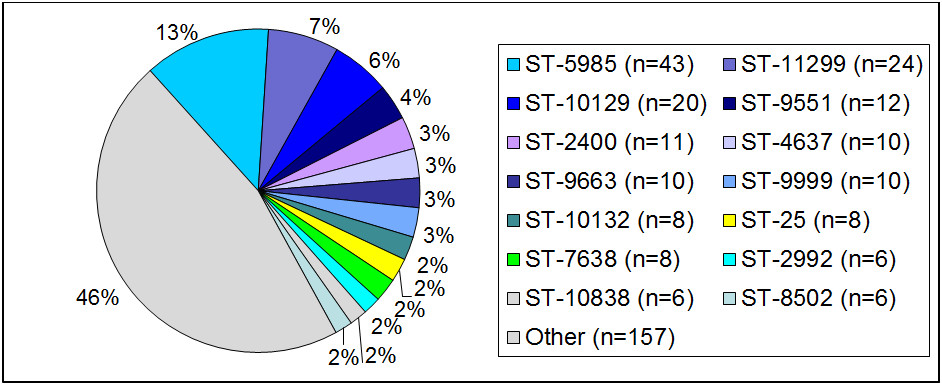
Description - Figure 21a
Pie chart is divided into segments representing the proportion of specific NG-MAST sequence types found in that province.
| NG-MAST | Number |
|---|---|
| ST-5985 | 43 |
| ST-11299 | 24 |
| ST-10129 | 20 |
| ST-9551 | 12 |
| ST-2400 | 11 |
| ST-4637 | 10 |
| ST-9663 | 10 |
| ST-9999 | 10 |
| ST-10132 | 8 |
| ST-25 | 8 |
| ST-2992 | 8 |
| ST-10838 | 6 |
| ST-8502 | 6 |
| Other | 157 |
Figure 21b. Distribution of NG-MAST within British Columbia (N=336)
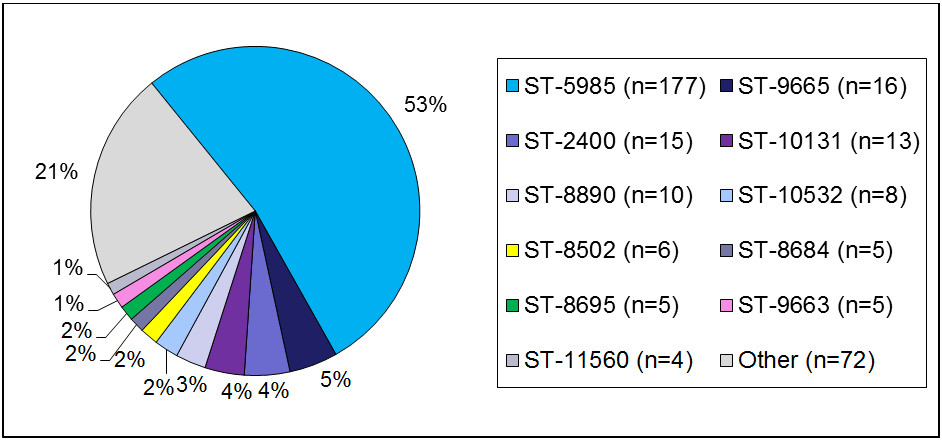
Description - Figure 21b
Pie chart is divided into segments representing the proportion of specific NG-MAST sequence types found in that province.
| NG-MAST | Number |
|---|---|
| ST-5985 | 177 |
| ST-9665 | 16 |
| ST- 2400 | 15 |
| ST-10131 | 13 |
| ST-8890 | 10 |
| ST-10532 | 8 |
| ST-8502 | 6 |
| ST-8684 | 5 |
| ST-8695 | 5 |
| ST-9663 | 5 |
| ST-11560 | 4 |
| Other | 72 |
Figure 21c. Distribution of NG-MAST within Saskatchewan (N=91)
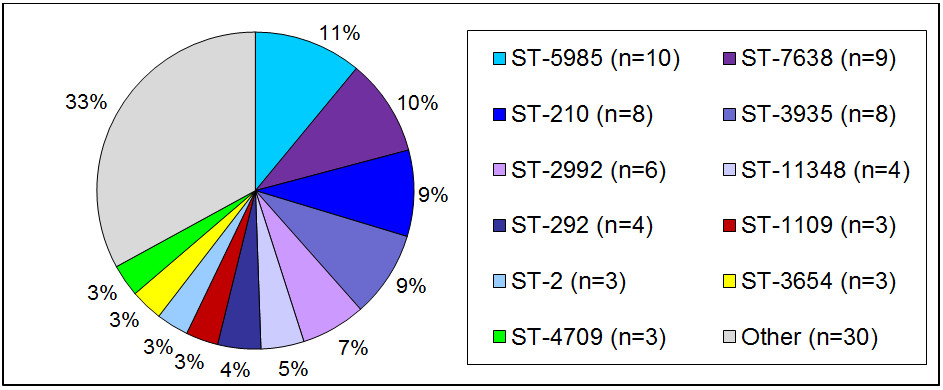
Description - Figure 21c
Pie chart is divided into segments representing the proportion of specific NG-MAST sequence types found in that province.
| NG-MAST | Number |
|---|---|
| ST-5985 | 10 |
| ST-7638 | 9 |
| ST-210 | 8 |
| ST-3935 | 8 |
| ST-2992 | 6 |
| ST-11348 | 4 |
| ST-292 | 4 |
| ST-1109 | 3 |
| ST-2 | 3 |
| ST-3654 | 3 |
| ST-4709 | 3 |
| Other | 30 |
Figure 21d. Distribution of NG-MAST within Ontario (N=855)
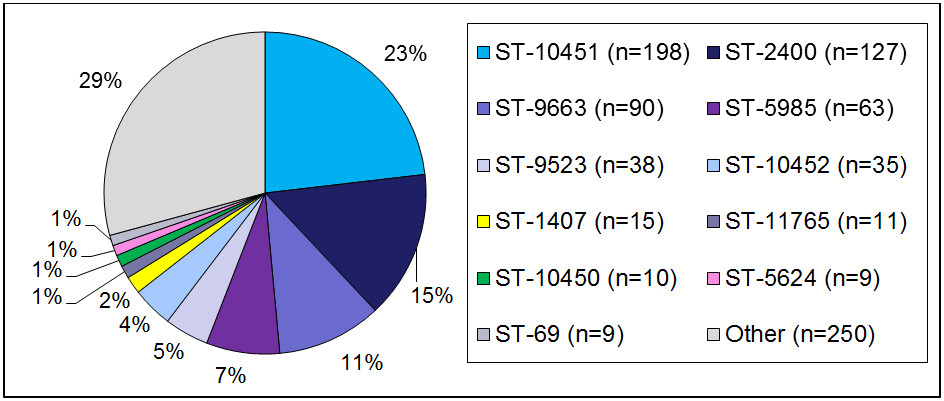
Description - Figure 21d
Pie chart is divided into segments representing the proportion of specific NG-MAST sequence types found in that province.
| NG-MAST | Number |
|---|---|
| ST-10451 | 198 |
| ST-2400 | 127 |
| ST-9663 | 90 |
| ST-5985 | 63 |
| ST-9523 | 38 |
| ST-10452 | 35 |
| ST-1407 | 15 |
| ST-11765 | 11 |
| ST-10450 | 10 |
| ST-5624 | 9 |
| ST-69 | 9 |
| Other | 250 |
Figure 21e. Distribution of NG-MAST within Quebec (N=408)
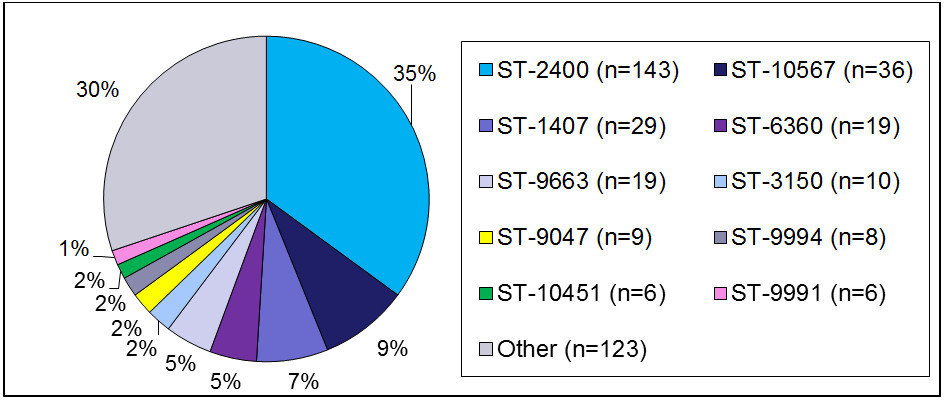
Description - Figure 21e
Pie chart is divided into segments representing the proportion of specific NG-MAST sequence types found in that province.
| NG-MAST | Number |
|---|---|
| ST-2400 | 143 |
| ST-10567 | 36 |
| ST-1407 | 29 |
| ST-6360 | 19 |
| ST-9663 | 19 |
| ST-3150 | 10 |
| ST-9047 | 9 |
| ST-9994 | 8 |
| ST-10451 | 6 |
| ST-9991 | 6 |
| Other | 123 |
Figure 22. Distribution of Resistance Characterizations within Neisseria gonorrhoeae NG-MAST Sequence Types, 2014; N=2,101Figure 22 note a
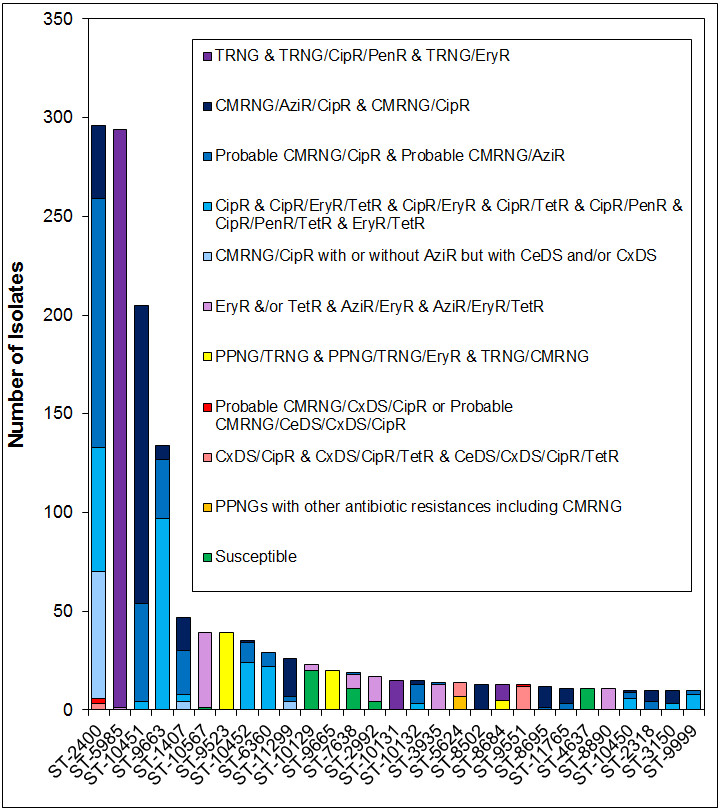
Description - Figure 22
A stacked bar chart demonstrating the antimicrobial characterization of Neisseria gonorrhoeae isolates within the most prevalent sequence types. The horizontal axis is labelled with the different STs. The vertical axis represents the number of isolates. Each bar represents a different ST and is divided into different colors corresponding to different antimicrobial characterizations.
| NG-MAST | EryR &/or TetR & AziR/EryR & AziR/EryR/TetR | CxDS/CipR & CxDS/CipR/TetR & CeDS/CxDS/CipR/TetR | CipR & CipR/EryR/TetR & CipR/EryR & CipR/TetR & CipR/PenR & CipR/PenR/TetR & EryR/TetR | PPNGs with other antibiotic resistances including CMRNG | PPNG/TRNG & PPNG/TRNG/EryR & TRNG/CMRNG | TRNG & TRNG/CipR/PenR & TRNG/EryR | Probable CMRNG/CipR & Probable CMRNG/AziR | Probable CMRNG/CxDS/CipR or Probable CMRNG/CeDS/CxDS/CipR | CMRNG/AziR/CipR & CMRNG/CipR | CMRNG/CipR with or without AziR but with CeDS and/or CxDS | Susceptible | Total |
|---|---|---|---|---|---|---|---|---|---|---|---|---|
| ST-2400 | 3 | 63 | 126 | 3 | 37 | 64 | 296 | |||||
| ST-5985 | 1 | 293 | 294 | |||||||||
| ST-10451 | 4 | 50 | 151 | 205 | ||||||||
| ST-9663 | 97 | 30 | 7 | 134 | ||||||||
| ST-1407 | 4 | 22 | 17 | 4 | 47 | |||||||
| ST-10567 | 38 | 1 | 39 | |||||||||
| ST-9523 | 39 | 39 | ||||||||||
| ST-10452 | 24 | 10 | 1 | 35 | ||||||||
| ST-6360 | 22 | 7 | 29 | |||||||||
| ST-11299 | 3 | 19 | 4 | 26 | ||||||||
| ST-10129 | 3 | 20 | 23 | |||||||||
| ST-9665 | 20 | 20 | ||||||||||
| ST-7638 | 7 | 1 | 11 | 19 | ||||||||
| ST-2992 | 13 | 4 | 17 | |||||||||
| ST-10131 | 15 | 15 | ||||||||||
| ST-10132 | 3 | 10 | 2 | 15 | ||||||||
| ST-3935 | 13 | 1 | 14 | |||||||||
| ST-5624 | 7 | 7 | 14 | |||||||||
| ST-8502 | 13 | 13 | ||||||||||
| ST-8684 | 5 | 8 | 13 | |||||||||
| ST-9551 | 12 | 1 | 13 | |||||||||
| ST-8695 | 1 | 11 | 12 | |||||||||
| ST-11765 | 3 | 8 | 11 | |||||||||
| ST-4637 | 11 | 11 | ||||||||||
| ST-8890 | 11 | 11 | ||||||||||
| ST-10450 | 6 | 3 | 1 | 10 | ||||||||
| ST-2318 | 4 | 6 | 10 | |||||||||
| ST-3150 | 3 | 7 | 10 | |||||||||
| ST-9999 | 8 | 2 | 10 |
Figure 23 outlines the NG-MAST sequence types of isolates with decreased susceptibility to cefixime (Figure 23a), decreased susceptibility to ceftriaxone (Figure 23b), azithromycin resistant isolates (Figure 23c) and susceptible isolates (Figure 23d).
The most prevalent ST of isolates with decreased susceptibility to cefixime was ST-9551 [30.2% (13/42)] followed by ST-11299, ST-1407 and ST-2400 [9.3% (4/42)] (Figure 23a).
Isolates with decreased susceptibility to ceftriaxone were primarily ST-2400 [68.6% (70/102)] with ST-9551 [3.9% (4/102)] following (Figure 23b).
The ST types identified among the AziR isolates are displayed in Figure 23c. ST-10451 [31.5% (40/127)] and ST-10567 [29.9% (38/127)] are the most prevalent.
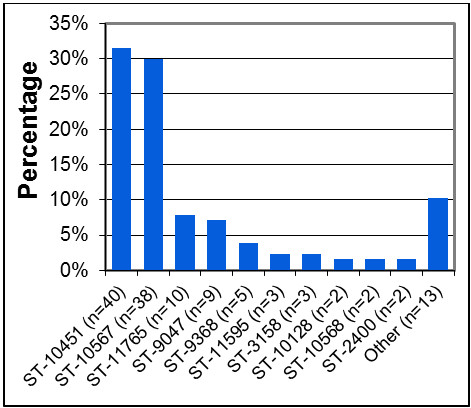
The STs of the susceptible isolates available for testing included ST-10129 [13.7% (20/146)], ST-4637 [7.5% (11/146)] and ST-7638 [7.5% (11/146)] as well as many others (Figure 23d).
Figure 23. NG-MAST Sequence Types of 2014 Neisseria gonorrhoeae IsolatesFigure 23 note a
Figure 23a. Decreased Susceptibility to Cefixime (MIC ≥ 0.25 mg/L), N=42
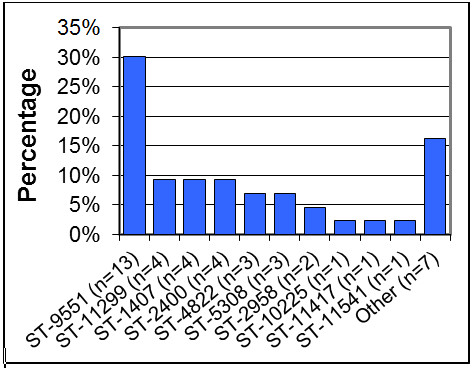
Description - Figure 23a
| NG-MAST | Percentage |
|---|---|
| ST-9551 (n=13) | 30.2% |
| ST-11299 (n=4) | 9.3% |
| ST-2400 (n=4) | 9.3% |
| ST-1407 (n=3) | 9.3% |
| ST-4822 (n=3) | 7.0% |
| ST-5308 (n=3) | 7.0% |
| ST-2958 (n=2) | 4.7% |
| ST-10225 (n=1) | 2.3% |
| ST-11417 (n=1) | 2.3% |
| ST-11541 (n=1) | 2.3% |
| Other (n=7) | 16.3% |
| Total (n=42) | 100.0% |
Figure 23b. Decreased Susceptibility to Ceftriaxone (MIC ≥ 0.125 mg/L), N=101
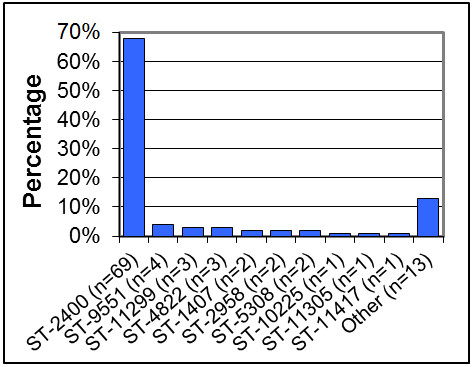
Description - Figure 23b
| NG-MAST | Percentage |
|---|---|
| ST-2400 (n=69) | 67.6% |
| ST-9551 (n=4) | 3.9% |
| ST-11299 (n=3) | 2.9% |
| ST-4822 (n=3) | 2.9% |
| ST-1407 (n=2) | 2.0% |
| ST-2958 (n=2) | 2.0% |
| ST-5308 (n=2) | 2.0% |
| ST-10225 (n=1) | 1.0% |
| ST-11305 (n=1) | 1.0% |
| ST-11417 (n=1) | 1.0% |
| Other (n=13) | 12.7% |
| Total (n=101) | 100.0% |
Figure 23c. Azithromycin Resistant (MIC ≥ 2 mg/L), N=127
Description - Figure 23c
| NG-MAST | Percentage |
|---|---|
| ST-3158 (n=10) | 27.0% |
| ST-9427 (n=6) | 16.2% |
| ST-9368 (n=3) | 8.1% |
| ST-2992 (n=2) | 5.4% |
| ST-6765 (n=2) | 5.4% |
| ST-8915 (n=2) | 5.4% |
| Other (n=12) | 32.4% |
| Total (n=127) | 100.0% |
Figure 23d. SusceptibleFigure 23 note b Isolates, N=146
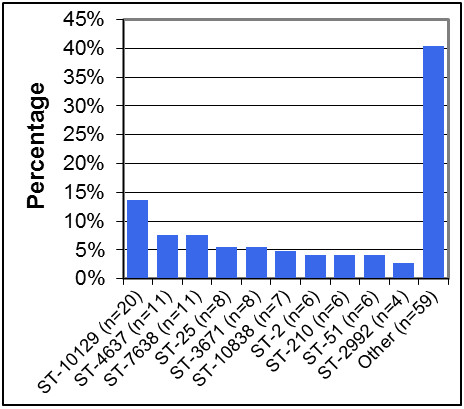
Description - Figure 23d
| NG-MAST | Percentage |
|---|---|
| ST-10129 (n=20) | 13.7% |
| ST-4637 (n=11) | 7.5% |
| ST-7638 (n=11) | 7.5% |
| ST-25 (n=8) | 5.5% |
| ST-3671 (n=8) | 5.5% |
| ST-10838 (n=7) | 4.8% |
| ST-2 (n=6) | 4.1% |
| ST-210 (n=6) | 4.1% |
| ST-51 (n=6) | 4.1% |
| ST-2992 (n=4) | 2.7% |
| Other (n=59) | 40.4% |
| Total (n=146) | 100.0% |
Figure 24. Genetic Relationship of Prevalent Neisseria gonorrhoeae NG-MAST Sequence Types, 2014Figure 24 note aFigure 24 note bFigure 24 note c
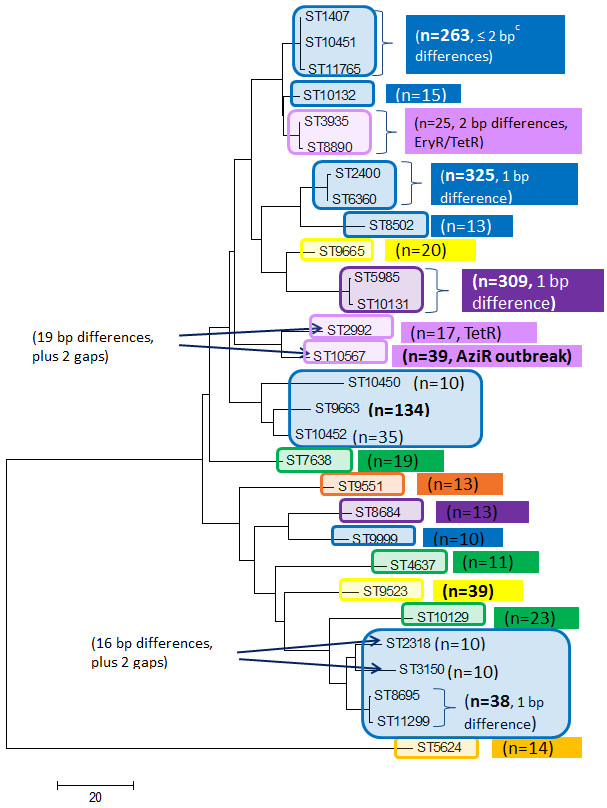
The evolutionary history was inferred using the Neighbor-Joining method (Saitu, 1987). The optimal tree with the sum of branch length = 554.32211304 is shown. The tree is drawn to scale, with branch lengths in the same units as those of the evolutionary distances used to infer the phylogenetic tree. The evolutionary distances were computed using the number of differences method (Nei, 2000) and are in the units of the number of base differences per sequence. The analysis involved 35 nucleotide sequences. Codon positions included were 1st+2nd+3rd+Noncoding. All positions containing gaps and missing data were eliminated. There were a total of 800 positions in the final dataset. Evolutionary analyses were conducted in MEGA6 (Tamura, 2013).
Description - Figure 24
The genetic relationship was inferred using the Neighbor-Joining method (Saitu, 1987). The optimal tree with the sum of branch length = 554.32211304 is shown. The tree is drawn to scale, with branch lengths in the same units as those of the evolutionary distances used to infer the phylogenetic tree. The evolutionary distances were computed using the number of differences method (Nei, 2000) and are in the units of the number of base differences per sequence. The analysis involved 35 nucleotide sequences. Codon positions included were 1st+2nd+3rd+Noncoding. All positions containing gaps and missing data were eliminated. There were a total of 800 positions in the final dataset. Evolutionary analyses were conducted in MEGA6 (Tamura, 2013).
Plasmids
Plasmid profiles for PPNG, TRNG and PPNG/TRNG isolates are shown in Figure 25. The beta-lactamase gene was encoded in three different types of plasmids of sizes 3.05 megadaltons (Mda), 3.2 Mda and 4.5 Mda. In 2014, the 3.2 Mda plasmid was the most common type amongst the 64 PPNG strains isolated at 67.2% (43/64), followed by the 3.05 Mda plasmid at 25.0% (16/64) and then the 4.5 Mda plasmid at 7.8% (5/64). These plasmids co-existed with the 2.6 Mda cryptic plasmid and sometimes with the 24.5 Mda conjugal plasmid. The 3.2 Mda plasmid is also the most common β-lactamase encoding plasmid in PPNG/TRNG strains at 66.1% (72/109). The 25.2 Mda plasmid that encodes tetracycline resistance (TetM) co-existed with the cryptic plasmids in most TRNG and PPNG/TRNG strains. Among the TRNG isolates tested in 2014, 19.4% (81/417) had the 2.6 and 25.2 Mda plasmids. TRNG isolates accounted for 89.2% of all the plasmid mediated resistance in N. gonorrhoeae in 2014 (526/590 PPNG, PPNG/TRNG and TRNG strains).
Figure 25. Plasmid Distribution within Antimicrobial Classifications of Neisseria gonorrhoeae Isolates Received by the NML, 2014
Figure 25a. PPNG (N=64)
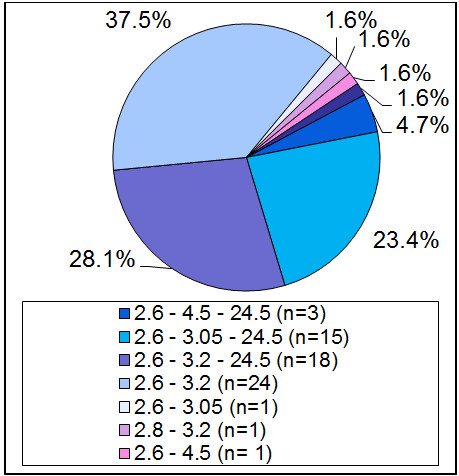
Description - Figure 25a
| Plasmid Profile | Percentage |
|---|---|
| 2.6 - 4.5 - 24.5 (n=3) | 4.7% |
| 2.6 - 3.05 - 24.5 (n=15) | 23.4% |
| 2.6 - 3.2 - 24.5 (n=18) | 28.1% |
| 2.6 - 3.2 (n=24) | 37.5% |
| 2.6 - 3.05 (n=1) | 1.6% |
| 2.8 - 3.2 (n=1) | 1.6% |
| 2.6 - 4.5 (n=1) | 1.6% |
| 4.5 (n=1) | 1.6% |
Figure 25b. PPNG/TRNG (N=109)
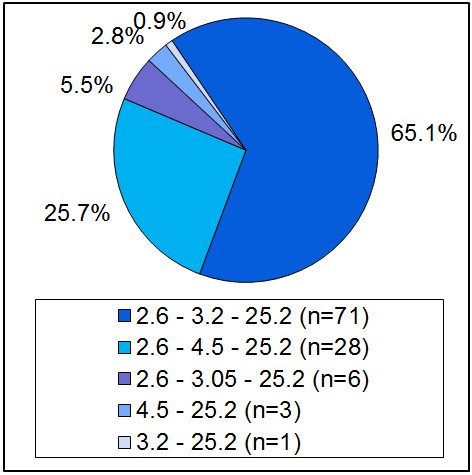
Description - Figure 25b
| Plasmid Profile | Percentage |
|---|---|
| 2.6 - 3.2 - 25.2 (n=71) | 65.1% |
| 2.6 - 4.5 - 25.2 (n=28) | 25.7% |
| 2.6 - 3.05 - 25.2 (n=6) | 5.5% |
| 4.5 - 25.2 (n=3) | 2.8% |
| 3.2 - 25.2 (n=1) | 0.9% |
Figure 25c. TRNG (N=417)
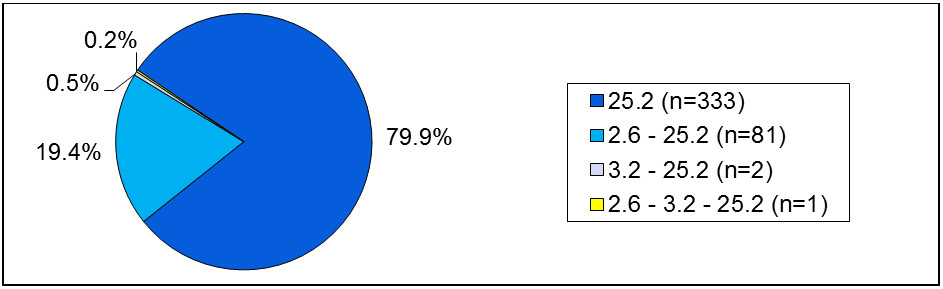
Description - Figure 25c
| Plasmid Profile | Percentage |
|---|---|
| 25.2 (n=333) | 79.9% |
| 2.6 - 25.2 (n=81) | 19.4% |
| 3.2 - 25.2 (n=2) | 0.5% |
| 2.6 - 3.2 - 25.2 (n=1) | 0.2% |
Conclusion
The evolution of antimicrobial resistance in gonorrhea is complex and the emergence and spread of resistant isolates is a recognized global public health threat. It is imperative that surveillance and monitoring of the antimicrobial susceptibilities and sequence types of N. gonorrhoeae continue to inform and subsequently mitigate the impact of antimicrobial resistance in gonorrhea. It is important to monitor changes in the characteristics and prevalence of the resistant isolate populations and their spread across the country in order to guide therapeutic recommendations. Reports of cefixime treatment failures and the observed MIC creep between 2001 and 2010 for both cefixime (from 0.016 mg/L to 0.125 mg/L) and ceftriaxone (from 0.016 mg/L to 0.063 mg/L) led to gonorrhea treatment changes. In 2011, The Canadian STI Guidelines issued updated recommendations for the use of combination gonorrhea therapy with 250 mg ceftriaxone intramuscularly and azithromycin 1 g orally as the first-line regimen in men who have sex with men (MSM) and in pharyngeal infections (Public Health Agency of Canada, 2011). The United States (CDC, 2012) and Europe (Bignell, 2013) also updated treatment recommendations to combination therapy with intramuscular ceftriaxone and oral azithromycin. Since the 2011 changes to gonorrhea treatment recommendations in Canada there has been a decrease in the proportion of isolates with elevated MICs to the cephalosporins. In 2011, 7.6% of isolates exhibited decreased susceptibility to ceftriaxone and/or cefixime according to the WHO definition (decreased susceptibility MICs ≥ 0.25 mg/L for cefixime and ≥ 0.125 mg/L for ceftriaxone). This percentage decreased to 5.9% in 2012, 3.9% in 2013 and 3.1% in 2014. Similarly, the US reported drops in decreased susceptibility to cefixime (1.4% in 2011 to 0.4% in 2013) and decreased susceptibility to ceftriaxone (0.4% in 2011 to 0.05% in 2013) (CDC, 2014). The UK reported that the prevalence of isolates with decreased cefixime susceptibility dropped from 6.3% in 2010 to 1.3% in 2013 and decreased ceftriaxone susceptibility declined from 0.3% in 2009 to 0.1% in 2013 (Public Health England, 2014).
With the decline in decreased susceptibility to cephalosporins, however, there was an increase in resistance to azithromycin in Canada (3.3%). While this percentage included 38 isolates from an outbreak (ST-10567), the proportion of azithromycin resistant isolates excluding the outbreak isolates was still 2.3%. This proportion of resistance approaches the 5% level at which an antimicrobial should be reviewed as an appropriate treatment, according to the WHO (2012). Canadian azithromycin levels were higher than the US', which ranged from 0.2% to 0.6% between 2009 and 2013 (CDC, 2014), and the UK's (MIC ≥ 1 mg/L) which reported 1.6% in 2013 (Public Health England, 2014). Australia reported 2.1% azithromycin resistance among their isolates in 2013 (Lahra, 2015).
Enhancing surveillance to include linked epidemiological and laboratory data would address the limitations in the current passive surveillance system regarding data representativeness and interpretation. A pilot program, the Enhanced Surveillance of Antimicrobial Resistant Gonorrhea (ESAG) was initiated in 2014 and is being assessed to fill this gap.
These gonococcal surveillance data will be utilized in the future iterations of the Canadian STI guidelines to provide information on the most effective treatment of N. gonorrhoeae and to reduce the prevalence and spread of drug resistant gonorrhea. This surveillance is particularly important as molecular testing, which provides no susceptibility data, becomes the most commonly used method for the diagnosis of N. gonorrhoeae in Canada.
Appendix
Appendix A
Appendix B
References
- Allen VG, Mitterni L, Seah C, Rebbapragada A, Martin IE, Lee C, Siebert H, Towns L, Melano RG, Lowe DE. 2013. Neisseria gonorrhoeae treatment failure and susceptibility to cefixime in Toronto, Canada. JAMA 2013;309:163-170.
- Barry PM and Klausner JD. The use of cephalosporins for gonorrhoea: The impending problem of resistance. Expert Opin Pharmacother 2009;10:555-577.
- Bignell C, Unemo M. European STI Guidelines Editorial Board. 2012 European guideline on the diagnosis and treatment of gonorrhoea in adults. Int J STD AIDS 2013;24:85-92.
- Brown LB, Krysiak R, Kamanga G, Mapanje C, Kanyamula H, Banda B, Mhango C, Hoffman M, Kamwendo D, Hobbs M, Hosseinipour M, Martinson F, Cohen MS, Hoffman IF. Neisseria gonorrhoeae antimicrobial susceptibility in Lilongwe, Malawi, 2007. Sex Transm Dis 2010;37:169-172
- Centers for Disease Control and Prevention. Sexually Transmitted Disease Surveillance 2007 Supplement, gonococcal Isolate Surveillance Project (GISP) Annual report 2007. Atlanta, GA: U.S. Department of Health and Human Services, Centers for Disease Control and Prevention, March 2009. Available: http//www.cdc.gov/std/GISP2007/.
- Centers for Disease Control and Prevention (CDC). Update to CDC’s Sexually transmitted diseases treatment guidelines, 2010: oral cephalosporins no longer a recommended treatment for gonococcal infections. MMWR Morb Mortal Wkly Rep. 2012; 61:590-594.
- Centers for Disease Control and Prevention. Antibiotic Resistance Threats in the United States, 2013. Atlanta, GA: U.S. Department of Health and Human Services, Centers for Disease Control and Prevention. Available: www.cdc.gov/drugresistance/threat-report-2013/.
- Centers for Disease Control and Prevention. 2013 Sexually Transmitted Diseases Surveillance. 2014. Atlanta, GA: U.S. Department of Health and Human Services, Centers for Disease Control and Prevention. Available: http://www.cdc.gov/std/stats13/gonorrhea.htm
- Chisholm SA, Neal TJ, Alawattegama AB, Birley HDL, Howe RA, Ison CA. Emergence of high-level azithromycin resistance in Neisseria gonorrhoeae in England and Wales. J Antimicrob Chemother 2009;64:353-358.
- Clinical and Laboratory Standards Institute. Performance Standards for Antimicrobial Susceptibility Testing: Twenty-Fifth Informational Supplement M100-S25. Clinical and Laboratory Standards Institute. Wayne, PA, 2015.
- Daly CC, Hoffman I, Hobbs M, Maida M, Zimba D, Davis R, Mughogho G, Cohen MS. Development of an antimicrobial susceptibility surveillance system for Neisseria gonorrhoeae in Malawi: Comparison of methods. J Clin Micro 1997;35:2985-2988.
- Ehret JM, Nims LJ, Judson FN. A clinical isolate of Neisseria gonorrhoeae with in vitro resistance to erythromycin and decreased susceptibility to azithromycin. Sex Transm Dis 1996;23:270-272.
- Golparian D, Hellmark B, Fredlund H, Unemo M. Emergence, spread and characteristics of Neisseria gonorrhoeae isolates with in vitro decreased susceptibility and resistance to extended-spectrum cephalosporins in Sweden. Sex Transm Infect 2010;86:454-460.
- Ison CA, Hussey J, Sankar KN, Evans J, Alexander S. Gonorrhoea treatment failures to cefixime and azithromycin in England, 2010. Euro Surveill 2011; 16(14):pii=19833.
- Lahra MM. Australian Gonococcal Surveillance Programme Annual Report, 2013. Commun Dis Intell. 2015;38:E137.
- Martin IMC, Ison CA, Aanensen DM, Fenton KA, Spratt BG. Rapid sequence-based identification of gonococcal transmission clusters in a large metropolitan area. J Infect Dis 2004;189:1497-1505.
- Nei M, Kumar S. Molecular Evolution and Phylogenetics. 2000. Oxford University Press, New York.
- Pandori M, Barry PM, Wu A, Ren A,, Whittington WLH, Liska S, Klausner JD. Mosaic penicillin-binding protein 2 in Neisseria gonorrhoeae isolates collected in 2008 in San Francisco, California. Antimicrob Agents Chemother 2009;53:4032-4034.
- Public Health Agency of Canada, 2011. Important Notice - Public Health Information Update on the Treatment of Gonococcal Infection. Available at: http://www.phac-aspc.gc.ca/std-mts/sti-its/alert/2011/alert-gono-eng.php.
- Public Health Agency of Canada.2015. Notifiable Diseases On-Line. http://dsol-smed.phac-aspc.gc.ca/dsol-smed/ndis/charts.php?c=pl Accessed: 01 Sept 2015.
- Public Health England. GRASP 2013 report; The Gonococcal Resistance to Antimicrobial Surveillance Programme (England and Wales). 2014.2014442:1.
- Saitou N, Nei M. The neighbor-joining method: A new method for reconstructing phylogenetic trees. Mol Biol Evol 1987;4:406-425.
- Tamura K, Stecher G, Peterson D, Filipski A, Kumar S. MEGA6: Molecular Evolutionary Genetics Analysis version 6.0. Mol Biol Evol 2013;30:2725-2729.
- Tapsall J. Antibiotic resistance in Neisseria gonorrhoeae is diminishing available treatment options for gonorrhoea: some possible remedies. Expert Rev Anti Infect Ther 2006;4:619-628.
- Tapsall JW, Ray S, Limnios A. Characteristics and population dynamics of mosaic penA allele-containing Neisseria gonorrhoeae isolates collected in Sydney, Australia, in 2007-2008. Antimicrob Agents Chemother 2010;54:554-556.
- Unemo M, Fasth O, Fredlund H, Limnios A, Tapsall J. Phenotypic and genetic characterization of the 2008 WHO Neisseria gonorrhoeae reference strain panel intended for global quality assurance and quality control of gonococcal antimicrobial resistance surveillance for public health purposes. J Antimicrob Chemother 2009;63:1142-1151.
- Unemo M, Golparian D, Syversen G, Vestrheim DF, Moi H. Two cases of verified clinical failures using internationally recommended first-line cefixime for gonorrhoea treatment, Norway, 2010. Euro Surveill 2010;15(47): pii=19721.
- Unemo M, Golparian D, Hestner A. Ceftriaxone treatment failure of pharyngeal gonorrhoeae verified by international recommendations. Sweden, July 2013. Euro Surveill 2011:16:pii=19792.
- Unemo M, Golparian D, Potočnik M, Jeverica S. Treatment failure of pharyngeal gonorrhoea with internationally recommended first-line ceftriaxone verified in Slovenia, September 2011. Euro Surveill 2012;17(25):pii=20200.
- World Health Organization (WHO). Emergence of multi-drug resistant Neisseria gonorrhoeae - Threat of global rise in untreatable sexually transmitted infections. 2011. Available from: http://whqlibdoc.who.int/hq/2011/WHO_RHR_11.14_eng.pdf. Accessed 6 May 2011.
- World Health Organization (WHO). Global action plan to control the spread and impact of antimicrobial resistance in Neisseria gonorrhoeae. 2012. Available from: http://www.who.int/reproductivehealth/publications/rtis/9789241503501/en/. Accessed 22 May 2012.