
Transfusion Error Surveillance System (TESS): 2012-2016 Report
Download the alternative format
(PDF format, 731 KB, 49 pages)
Organization: Public Health Agency of Canada
Type: Report
Published: 2021-03-03
Table of Contents
- Foreword
- Acknowledgment
- Abbreviations
- Executive Summary
- Introduction
- Methods
- Results
- Section 1. Overall errors, TESS 2012-2016
- a) Errors reported by hospitals of various transfusion volumes
- b) Summary report of errors by type and hospital of various transfusion volumes
- c) Errors by type and year
- d) Three most frequent events that were attributable to each type of error
- e) Localisation of errors
- f) Errors that did not reach (near-miss events) and reached the patient (actual events) by type
- g) Errors by type and potential severity
- h) Errors by type and occurrence time
- Section 2. Errors that did not reach the patient (near-miss events)
- Section 3. Errors that reached the patient (actual events)
- Section 4. Potential severity of errors
- Section 1. Overall errors, TESS 2012-2016
- Discussion
- Data Limitations
- Summary
- References
- Appendix
Foreword
The Centre for Communicable Diseases and Infection Control (CCDIC) of the Public Health Agency of Canada (PHAC) is pleased to present the Transfusion Error Surveillance System (TESS), 2012-2016 Report. This report presents transfusion error surveillance data submitted between 2012 and 2016 by participating Canadian sentinel hospitals.
The TESS is a voluntary surveillance system established by PHAC to capture non-nominal data on errors occurring at any point in the transfusion chain, including those detected before or after the transfusion of blood components and fractionated plasma products to the patient and those that may or may not have resulted in adverse transfusion reactions. The overall objective is to identify potential areas for improvement in the transfusion chain and ultimately, improve transfusion processes and patient safety in Canada.
CCDIC, in partnership with participating provinces and territories, is responsible for the collection, management, and analysis of data, and the production of reports to support evidence-based public health decisions.
Acknowledgment
The development of the Transfusion Error Surveillance System (TESS) would not have been possible without the collaborative support and continued commitment of the many transfusion safety officers, medical laboratory technologists, and other healthcare professionals in hospitals and Blood Transfusion Services. Their dedication to reducing errors and increasing patient safety has led to the collection and analysis of 2012-2016 TESS data.
Abbreviations
- AHTR
- Acute Haemolytic Transfusion Reaction
- DC
- Distributor Codes
- DHTR
- Delayed Haemolytic Transfusion Reaction
- FNHTR
- Febrile Non-Haemolytic Transfusion Reaction
- IM
- Inventory Management
- IVIG
- Intravenous Immunoglobulin
- MS
- Miscellaneous
- PC
- Product Check-in
- PR
- Product Request
- PS
- Product Selection
- RP
- Request for Pick-up
- SC
- Sample Collection
- SH
- Sample Handling
- SOP
- Standard Operating Procedure
- SR
- Sample Receipt
- ST
- Sample Testing
- TACO
- Transfusion Associated Circulatory Overload
- TESS
- Transfusion Error Surveillance System
- UI
- Unit Issue
- UM
- Unit Manipulation
- US
- Unit Storage
- UT
- Unit Transfusion
Executive Summary
The Transfusion Error Surveillance System (TESS) was initiated by the Public Health Agency of Canada (PHAC) in 2005, in conjunction with 11 hospitals, to monitor errors occurring in the transfusion chain. Currently, 15 hospitals in 4 Canadian provinces and territories (P/Ts) participate in the surveillance as sentinel sites and report all errors to PHAC on a quarterly basis.
Overall, a total number of 50,925 errors were reported from 2012 to 2016. The most frequent errors reported were related to sample collection (SC) (n=17,485; 34.3%), unit transfusion (UT) (n=7,040; 13.8%), and sample handling (SH) (n=5,721; 11.2%). The majority (n=48,256; 94.8%) of all errors did not reach the patient (near-miss events).
Of the 2,669 errors that reached the patient (actual events), approximately 97.5% (n=2,602) caused no harm at the time of reporting. Two point five percent (n=67) caused some harm to the patient (recipient), which were errors related to product request (PR) (n=49), UT (n=15), and product selection (PS) (n=2), and sample testing (ST, n=1). These four types of errors were linked to 45 cases of transfusion-associated circulatory overload (TACO), 11 cases of febrile non-haemolytic reactions, 3 cases of minor allergic reactions, 2 cases of acute haemolytic reaction, 2 cases of delayed serologic reaction, 1 cases of incorrect dose administered, 1 case of IVIG headache, and 1 case of ABO incompatibility. Of the 2,669 errors that reached the patient, 29.7% (n=791) were related to the request for blood product pick-up (RP), 20.6% (n=548) to PR, and 19.2% (n=513) to UT. From 2012 to 2016, there was a decreasing trend in the annual rates of SC, SH, and ST errors that reached the patient.
The TESS data demonstrate that blood transfusions are safe in participating Canadian hospitals, as only 0.1% (n=67) of all errors reported to the TESS resulted in harm. No cases resulted in death. The TESS data also highlight potential areas for improvement. For example, most errors that escaped detection occurred during PR and UT processes. Thus, more system and process innovations, knowledge translations, attention, and awareness are required during these two processes to improve the safe delivery of blood to Canadians.
Data collected through the TESS can help facilitate the identification and evaluation of preventive measures designed to improve the transfusion process and patient safety.
Introduction
Blood transfusion is a very safe and effective treatment when performed according to hospital policies and procedures. Transfusion safety depends on a complex multistep process, beginning with the decision to order an appropriate blood component or fractionated plasma product. The process is then followed by sample collection, labeling, transportation, handling, storing, pre-transfusion testing, issuing and the transfusion of blood components and fractionated plasma products to the patient. Due to robust precautionary measures, the risk of an adverse reaction following transfusion is very low in developed countries, including Canada. However, errors may occur at each step of the multistep transfusion process and these errors can cause administrative delays in the transfusion procedure, product wastage, sample re-collection, unnecessary transfusions, adverse transfusion reactions, and deathFootnote 1. These errors have the potential to negatively impact patient safety and to increase costs of the healthcare system. Therefore, mitigating the risk of errors is a fundamental step in improving patient safety.
In 2005, the Transfusion Error Surveillance System (TESS) was initiated by the Public Health Agency of Canada (PHAC) as a sentinel pilot surveillance system with 11 hospitalsFootnote 2Footnote 3. The objective was to monitor the incidence and trends of errors that can occur at any step in the transfusion chain. Currently, 15 hospitals across four provinces (Québec, British Columbia, Ontario, and Nova Scotia) participate in the TESS. The TESS data serve as a complement to data collected through the Transfusion Transmitted Injuries Surveillance System (TTISS), which monitors the incidence of adverse reactions following blood transfusion in CanadaFootnote 4. In addition, numerous other non-sentinel hospitals submit data to TESS for their own use of the data; their non-sentinel data are not reported here.
Participating hospitals provide anonymous data on a quarterly basis using a secure electronic web-based server maintained by the PHAC. In addition to data on errors, participating hospitals provide the number of blood components or fractionated plasma products received, requested, prepared, and issued, and the number of samples received and tests performed, which are used as denominator for calculating error rates. This allows for comparing error rates between sites and hospital locations/wards as well as across similar hospital sizes or transfusion practices.
The TESS allows hospitals to identify the points along the transfusion chain where errors most commonly occur, including those that are detected prior to the blood transfusion. Corrective action can be taken to minimize errors in those areas and prevent adverse reactions. Following the implementation of intervention measures, future TESS data may be used to evaluate the effectiveness of such measures. Findings may also provide comparable benchmarks for other hospitals in Canada and for international comparisons.
Methods
Details on the TESS’s methods, including definitions, data collection, classification, categorization data management, data quality control, and analysis of errors, have already been described in previous reportsFootnote 2Footnote 3.
Definition of error:
Errors reported through the TESS are defined as unexpected and unplanned deviations from standard operating procedures or applicable laws and regulations, usually attributable to a human or system problem that could:
- Adversely affect the safety, efficacy or quality of blood components, and fractionated plasma products (plasma derivatives) as well as the safety of recipients, and/or;
- Result in inefficiencies or cost-ineffective care.
Errors are classified as near-miss events or actual events:
- Near-miss events are classified into two mutually exclusive categories, planned or unplanned discovery, based on whether the errors were detected by a standardized mechanism/process or by chance, respectively:
- Planned discovery occurs when a near-miss event was detected by a standardized mechanism/process;
- Unplanned discovery occurs when a near-miss event was detected by chance.
- Actual events refer to an error or deviation from standard procedures or policies that reached or caused impact to the patient. Actual events are classified into two mutually exclusive categories, based on whether or not they caused any harm to the patient:
- Harm: The patient had an unintended or inadequate response to transfusion or suffered a negative impact or adverse transfusion reaction as a result of the error;
- No harm: The patient did not have any known negative clinical consequences at the time of reporting as a result of the error.
Error type and error coding:
Errors captured through TESS are also categorized according to their occurrence point in the transfusion chain. Figure 1 illustrates this multistep transfusion process where each type of error can occur. For instance, all errors described with distributor codes (DC) are errors that occur at the distributor/supplier level of blood components or fractionated plasma products, whereas unit transfusion (UT) errors occur at the time of transfusion in clinical settings. There are errors that occur only in the transfusion service or clinical settings (e.g., medical/surgical wards, operating rooms, emergency rooms, out-patient clinics and procedures [Out-patient clinics], intensive care units, and obstetrics). The transfusion service errors were divided into nine process types according to the point in the transfusion process, and clinical setting errors were divided into five types. Table 1 provides a summary of blood suppliers, transfusion services, and clinical settings.
A set of predefined standardized alpha-numeric codes that are used to classify each type of errors are described in detail in the TESS User’s manual. Table 2 presents general error codes where the letters in the codes indicate the type of error. Errors are further sub-categorized into numeric values to differentiate specific errors within each type. A complete listing of the error codes is provided in Appendix 1.
To ensure the consistency of error coding across participating sites in the TESS, PHAC organises monthly error coding meetings to discuss complex cases for which error coding may be difficult. Baseline training for error coding is also offered to new sites prior to participating in the TESS.
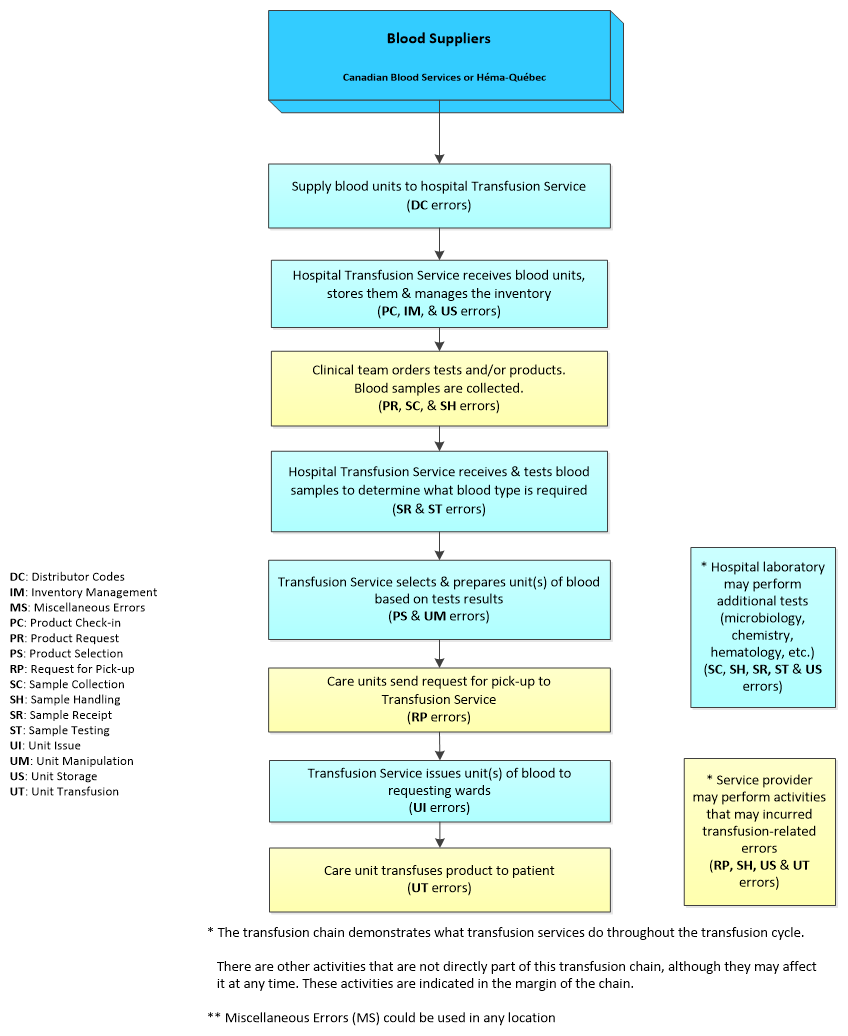
Figure 1 - Text description
The transfusion chain starts with blood suppliers (including Canadian Blood Services, Héma-Québec, and hospitals that may serve as suppliers to others) that supply blood products to transfusion services which manage the inventory in hospitals. Requests for products to transfusion services are initiated/placed from various hospital wards by doctors' prescriptions. Upon receipt of these requests, transfusion services determine what blood type is required and prepare the product as per the prescription, then issued it to the requesting ward for infusion. At each level of the processing of the request, specific transfusion errors may occur. Errors related to distributor codes (DC) at the supplier level, those related to: product check-in (PC), inventory management (IM), unit storage (US), sample receipt (SR), sample testing (ST), product selection (PS), as well as unit manipulation (UM) and issue (UI) can only occur at the transfusion services level (laboratory setting); while those related to: product request (PR), sample collection (SC), sample handling (SH), request for pick-up (RP), and unit transfusion (UT) would happen only at the clinical setting (ward) level.
| Point in the Transfusion Process | Error Code | Type of Error |
|---|---|---|
| Blood Suppliers | DC | Distributor codesFootnote * |
| Transfusion Services | DC | Distributor codes |
| PC | Product check-in | |
| IM | Inventory management | |
| US | Unit storage | |
| SR | Sample receipt | |
| ST | Sample testing | |
| PS | Production selection | |
| UM | Unit manipulation | |
| UI | Unit issue | |
| MS | Miscellaneous | |
| Clinical Settings | PR | Product request |
| SC | Sample collection | |
| SH | Sample handling | |
| RP | Request for pick-up | |
| UT | Unit transfusion | |
| MS | Miscellaneous | |
|
||
| Error Code | Type of Error | Description | Corresponding Denominator |
|---|---|---|---|
| DC | Distributor codes |
|
Units of product received |
| PC | Product check-in |
|
|
| US | Unit storage |
|
|
| IM | Inventory management |
|
|
| PR | Product request |
|
Units of product requested |
| SC | Sample collection |
|
Samples received |
| SH | Sample handling |
|
|
| SR | Sample receipt |
|
|
| ST | Sample testing |
|
Tests performed |
| PS | Product selection |
|
Units of product prepared |
| UM | Unit manipulation |
|
|
| RP | Request for pick-up |
|
Units of product issued |
| UI | Unit issued |
|
|
| UT | Unit transfusion |
|
|
| MS | Miscellaneous |
|
N/A |
Potential severity of transfusion error:
The potential severity is a measure of the potential harm that the error may cause to the patient if it is not detected. High severity level is assigned to errors that have the potential to cause serious injury (including death), whereas low and medium severity levels are assigned to errors with the potential to cause no or minor/transient injury, respectively. The national TESS working group defined errors of high-potential severity, listed in Table 3.
| Type of Error | Description | Error Code |
|---|---|---|
| Product request |
|
PR 01 |
Sample collection |
|
SC 01 |
|
SC 02 | |
|
SC 03 | |
|
SC 07 | |
|
SC 10 | |
| Sample handling |
|
SH 02 |
| Sample receipt |
|
SR 01 |
Sample testing |
|
ST 05 |
|
ST 09 | |
| Request for pick-up |
|
RP 01 |
Unit issue |
|
UI 04 |
|
UI 06 | |
|
UI 19 | |
Unit transfusion |
|
UT 01 |
|
UT 02 | |
| Miscellaneous |
|
MS 03 |
Data collection:
Hospital sizes were classified as the following: small transfusion volume, less than 2,000 units of red blood cells (RBCs) transfused per year; medium transfusion volume, 2,000 to 10,000 units of RBCs per year; and large transfusion volume, more than 10,000 units of RBCs per year. Data on errors were reported by 17 participating hospitals from four Canadian P/Ts in 2012. In 2014, three hospitals dropped out of the system. In 2015, a large transfusion volume hospital was reclassified as a medium transfusion volume hospital, and in 2016, a small transfusion volume hospital joined the surveillance system. As a result, from 2012 to 2016, the overall number of participating hospitals changed from 17 to 15: the number of large transfusion volume hospitals decreased from four to two, and both medium transfusion volumes and small transfusion volumes remained unchanged at five and eight, respectively.
Errors are detected using various methods, including ongoing systematic quality control (chart audit, record review, and real-time prospective transfusion audit), scheduled quality assurance, supervisory reports, and reporting by other authorized individuals. The reporting process begins with the individuals who discover the event, whether or not they are involved in the transfusion. Once an error is detected at a hospital, non-nominal data regarding the error are then collected by the site. The corresponding error type and code, as well as other pieces of information such as the date, time, and location of the error, the point in the transfusion chain at which the error occurred, the point in the transfusion chain at which the error was detected, the potential severity of the error, and its consequences to the patient, are captured using a reporting form. The data are validated and consolidated into a master file by the P/T coordinator. The data elements required for the TESS are then extracted and exported to PHAC as per the data sharing agreement between the P/T and PHAC. Data exports occur every 3 months. A user’s manual for the TESS web application was developed to assist P/T with the data transfer.
Data analysis:
Data were submitted to PHAC either through the TESS electronic warehouse, web-based database, or by Microsoft Excel files. All raw data were retained in compliance with the Directive for the collection, use and dissemination of information relating to public health (PHAC. 2013 [unpublished document]). Microsoft Excel 2010 and SAS Enterprise Guide (SAS EG) v5.1 software were used for dataset combination, data cleaning, and analysis. Before the analysis and report preparation, all data were reviewed for errors, inconsistencies, and completeness. Follow-up validation was done with the reporting jurisdictions to resolve any concerns or data quality issues.
In this report, the term “rate” refers to the number of errors occurring in each year per 100,000 units of products received, requested, prepared, or issued, or per 100,000 samples received or tests performed,depending on the error type. Table 4 summarizes the number of units of blood components and fractionated plasma products received, requested, prepared, and issued before transfusion.
| Denominator Data | 2012 | 2013 | 2014 | 2015 | 2016 | Total |
|---|---|---|---|---|---|---|
| Total number of samples received | 144,586 | 132,391 | 104,850 | 98,494 | 110,580 | 590,901 |
| Total number of tests performed | 301,088 | 271,578 | 218,707 | 195,920 | 219,203 | 1,206,496 |
| Total units of products received | 202,618 | 189,354 | 154,229 | 144,669 | 156,657 | 847,527 |
| a. Blood components | 110,202 | 98,536 | 77,978 | 70,955 | 76,423 | 434,094 |
| b. Fractionated plasma products | 92,416 | 90,818 | 76,251 | 73,714 | 80,245 | 413,444 |
| Total units of products requested | 211,414 | 198,946 | 158,695 | 140,496 | 167,277 | 876,828 |
| a. Blood components | 119,362 | 107,419 | 82,743 | 74,796 | 85,367 | 469,687 |
| b. Fractionated plasma products | 92,052 | 91,527 | 75,952 | 65,700 | 81,910 | 407,141 |
| Total units of products prepared | 225,684 | 213,881 | 171,548 | 151,794 | 178,607 | 941,514 |
| a. Blood components | 130,866 | 120,924 | 94,553 | 87,587 | 96,980 | 530,910 |
| b. Fractionated plasma products | 94,818 | 92,957 | 76,995 | 73,329 | 81,710 | 419,809 |
| Total units of products issued | 210,290 | 198,046 | 158,034 | 140,008 | 166,714 | 873,092 |
| a. Blood components | 118,287 | 106,613 | 82,126 | 77,149 | 84,927 | 469,102 |
| b. Fractionated plasma products | 92,003 | 91,433 | 75,908 | 71,652 | 81,787 | 412,783 |
No statistical procedures were used for comparative analyses, nor were any statistical techniques applied to account for missing data. Data in tables with small cell sizes (n≤5) were not suppressed, since disclosure was not deemed to pose any risk of identifying individual cases. Errors were counted by the date of error occurrence.
Results
The results are organized into four sections:
- Overview of errors
- Errors that did not reach the patient (near-miss events)
- Errors that reached the patient (actual events)
- Potential severity of errors
Section 1. Overall errors, TESS 2012-2016
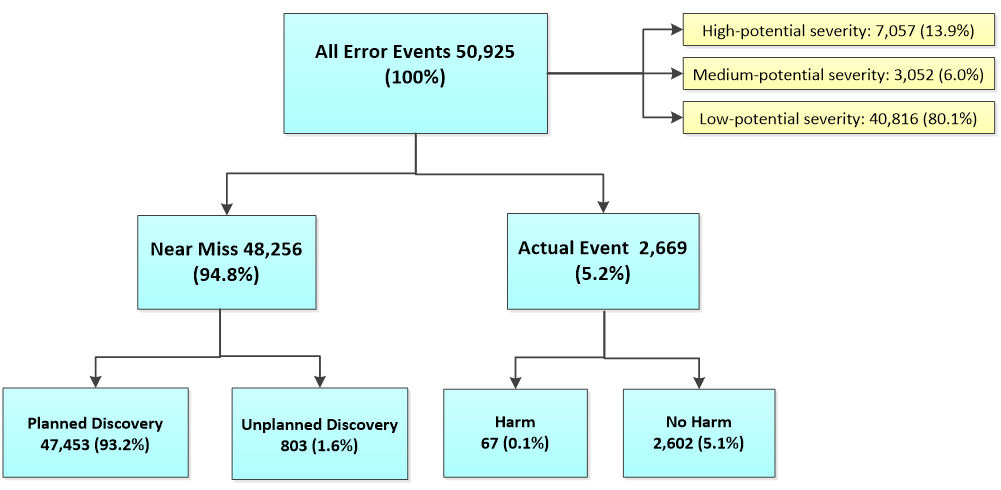
From 2012 to 2016, a total of 50,925 errors were reported (Figure 2). Approximately 94.8% (n=48,256) of all errors were near-miss events while only 5.2% (n=2,669) were actual events. Of all 50,925 error events, 0.1% (n=67) resulted in harm. Of the 48,256 near-miss events, approximately 98.3% (n=47,453) were detected by a planned discovery and 1.7% (n=803) by an unplanned discovery. Based on its potential severity, these 50,925 errors are classified into three categories: high (n=7,057; 13.9%), medium (n=3,052; 6.0%), or low (n=40,816; 80.1%).
a) Errors reported by hospitals of various transfusion volumes
| Hospital Type | 2012 | 2013 | 2014 | 2015 | 2016 | Total | |||||||||||
|---|---|---|---|---|---|---|---|---|---|---|---|---|---|---|---|---|---|
| NFootnote * | Freq. | % | N | Freq. | % | N | Freq. | % | N | Freq. | % | N | Freq. | % | Freq. | % | |
| Small (<2,000 RBC units/year) | 8 | 356 | 2.9 | 8 | 459 | 4.0 | 7 | 302 | 3.5 | 7 | 274 | 3.1 | 8 | 482 | 5.0 | 1,873 | 3.7 |
| Medium (2,000 - 10,000 RBC units/year) | 5 | 1,821 | 15.0 | 5 | 1,539 | 13.3 | 4 | 1,527 | 17.5 | 5 | 2,879 | 32.4 | 5 | 2,859 | 29.8 | 10,625 | 20.9 |
| Large (>10,000 RBC units/year) | 4 | 9,969 | 82.1 | 4 | 9,567 | 82.7 | 3 | 6,916 | 79.1 | 2 | 5,722 | 64.5 | 2 | 6,253 | 65.2 | 38,427 | 75.5 |
| Total | 17 | 12,146 | 100 | 17 | 11,565 | 100 | 14 | 8,745 | 100 | 14 | 8,875 | 100 | 15 | 9,594 | 100 | 50,925 | 100 |
|
|||||||||||||||||
Table 5 summarizes the counts of errors by year and hospitals of various transfusion volumes. Of the 50,925 errors reported by participating hospitals between 2012 and 2016, hospitals of large transfusion volumes accounted for over 75% (n=38,427) and medium and small transfusion volumes accounted for 20.9% (n=10,625) and 3.7% (n=1,873), respectively.
b) Summary report of errors by type and hospital of various transfusion volumes
| Type of Error | Small (<2,000 RBC units/year) | Medium (2,000 - 10,000 RBC units/year) | Large (>10,000 RBC units/year) | Total | ||||||||
|---|---|---|---|---|---|---|---|---|---|---|---|---|
| Freq. | % | Rate per 100,000 | Freq. | % | Rate per 100,000 | Freq. | % | Rate per 100,000 | Freq. | % | Rate per 100,000 | |
| SC | 243 | 13.0 | 665.3 | 2,735 | 25.7 | 1,510.3 | 14,507 | 37.8 | 3,886.2 | 17,485 | 34.3 | 2,959.0 |
| SH | 192 | 10.3 | 525.7 | 1,068 | 10.1 | 589.8 | 4,461 | 11.6 | 1,195.0 | 5,721 | 11.2 | 968.2 |
| SR | 173 | 9.2 | 473.7 | 166 | 1.6 | 91.7 | 1,492 | 3.9 | 399.7 | 1,831 | 3.6 | 309.9 |
| ST | 110 | 5.9 | 339.8 | 796 | 7.5 | 198.8 | 1,681 | 4.4 | 217.2 | 2,587 | 5.1 | 214.4 |
| DC | 49 | 2.6 | 165.3 | 689 | 6.5 | 235.3 | 616 | 1.6 | 117.3 | 1,354 | 2.7 | 159.8 |
| IM | 24 | 1.3 | 80.9 | 131 | 1.2 | 44.7 | 345 | 0.9 | 65.7 | 500 | 1.0 | 59.0 |
| PC | 49 | 2.6 | 165.3 | 397 | 3.7 | 135.6 | 635 | 1.7 | 120.9 | 1,081 | 2.1 | 127.5 |
| US | 673 | 35.9 | 2,270.0 | 97 | 0.9 | 33.1 | 2,770 | 7.2 | 527.5 | 3,540 | 7.0 | 417.7 |
| PR | 56 | 3.0 | 223.4 | 832 | 7.8 | 269.8 | 1,782 | 4.6 | 327.9 | 2,670 | 5.2 | 304.5 |
| PS | 3 | 0.2 | 20.7 | 58 | 0.5 | 17.5 | 72 | 0.2 | 12.1 | 133 | 0.3 | 14.1 |
| UM | 35 | 1.9 | 241.9 | 181 | 1.7 | 54.6 | 509 | 1.3 | 85.4 | 725 | 1.4 | 77.0 |
| RP | 20 | 1.1 | 92.0 | 539 | 5.1 | 174.8 | 1,148 | 3.0 | 211.5 | 1,707 | 3.4 | 195.5 |
| UI | 39 | 2.1 | 179.3 | 488 | 4.6 | 158.2 | 2,284 | 5.9 | 420.7 | 2,811 | 5.5 | 322.0 |
| UT | 173 | 9.2 | 795.5 | 2,046 | 19.3 | 663.4 | 4,821 | 12.5 | 888.0 | 7,040 | 13.8 | 806.3 |
| MSFootnote * | 34 | 1.8 | NA | 402 | 3.8 | NA | 1,304 | 3.4 | NA | 1,740 | 3.4 | NA |
| Total | 1,873 | 100 | NA | 10,625 | 100 | NA | 38,427 | 100 | NA | 50,925 | 100 | NA |
|
||||||||||||
Overall, the three most common errors were related to SC (34.3%, n=17,458), UT (13.8%, n=7,040), and SH (11.2%, n=5,721) (Table 6). The corresponding rates for SC, SH and UT were 2,959, 968.2, and 806.3 per 100,000; however, this number varied depending on the hospital’s transfusion volume. Among small transfusion volume hospitals, the three most commonly reported errors were US (35.9%), SC (13%), and SH (10.3%) and among large transfusion volume hospitals, these were SC (37.8%), UT (12.5%), and SH (11.6%). From 2012 to 2016, the annual rate of US errors in hospitals with small transfusion volumes was more than four times higher compared to that in hospitals with large transfusion volumes. The rate of SC errors was more than five times higher in hospitals with large transfusion volumes compared to hospitals with small transfusion volumes.
c) Errors by type and year
| Type of Error | 2012 | 2013 | 2014 | 2015 | 2016 | |||||
|---|---|---|---|---|---|---|---|---|---|---|
| Freq. | Rate per 100,000 | Freq. | Rate per 100,000 | Freq. | Rate per 100,000 | Freq. | Rate per 100,000 | Freq. | Rate per 100,000 | |
| SC | 4,191 | 2,898.6 | 3,998 | 3,019.8 | 3,173 | 3,026.2 | 3,095 | 3,142.3 | 3,028 | 2,817.5 |
| SH | 1,122 | 776.0 | 1,354 | 1,022.7 | 1,044 | 995.7 | 886 | 899.5 | 1,315 | 1,223.6 |
| SR | 444 | 307.1 | 428 | 323.3 | 390 | 372.0 | 272 | 276.2 | 296 | 275.4 |
| ST | 634 | 210.6 | 538 | 198.1 | 512 | 234.1 | 557 | 284.3 | 347 | 158.3 |
| DC | 440 | 217.2 | 323 | 170.6 | 183 | 118.7 | 239 | 165.2 | 169 | 107.9 |
| IM | 115 | 56.8 | 86 | 45.4 | 81 | 52.5 | 94 | 65.0 | 124 | 79.2 |
| PC | 281 | 138.7 | 228 | 120.4 | 174 | 112.8 | 214 | 147.9 | 184 | 117.5 |
| US | 772 | 381.0 | 917 | 484.3 | 602 | 390.3 | 773 | 534.3 | 476 | 303.8 |
| PR | 759 | 359.0 | 562 | 282.5 | 565 | 356.0 | 357 | 239.1 | 427 | 255.3 |
| PS | 40 | 17.7 | 29 | 13.6 | 22 | 12.8 | 20 | 12.4 | 22 | 12.3 |
| UM | 207 | 91.7 | 143 | 66.9 | 123 | 71.7 | 132 | 82.0 | 120 | 67.2 |
| RP | 365 | 173.6 | 486 | 245.4 | 316 | 200.0 | 276 | 185.5 | 264 | 158.4 |
| UI | 583 | 277.2 | 662 | 334.3 | 551 | 348.7 | 396 | 266.1 | 619 | 371.3 |
| UT | 1,928 | 916.8 | 1,467 | 740.7 | 672 | 425.2 | 1,197 | 804.4 | 1,776 | 1,065.3 |
| MSFootnote * | 265 | NA | 344 | NA | 337 | NA | 367 | NA | 427 | NA |
| Total | 12,146 | NA | 11,565 | NA | 8,745 | NA | 8,875 | NA | 9,594 | NA |
|
||||||||||
In Table 7, the annual rates of errors for SC, SH, SR, and ST remained relatively stable from 2012 to 2016. An overall upward trend in UI errors was observed from 277.2 per 100,000 in 2012 to 371.3 per 100,000 in 2016.
d) Three most frequent events that were attributable to each type of error
| Description | Error Code | Freq. | Percent | Rate per 100,000 |
|---|---|---|---|---|
| Sample collection errors | ||||
| Sample collected unnecessarily | SC 08 | 8,847 | 50.6 | 1,497.2 |
| Sample haemolysed | SC 06 | 3,181 | 18.2 | 538.3 |
| Label incomplete/illegible for non-key patient identifiers | SC 12 | 2,070 | 11.8 | 350.3 |
| Sample handling errors | ||||
| No phlebotomist / witness identification | SH 05 | 2,452 | 42.9 | 415.0 |
| Patient information (other than ID) missing / incorrect on requisition | SH 07 | 1,258 | 22.0 | 212.9 |
| Sample arrives without requisition | SH 01 | 424 | 7.4 | 71.8 |
| Sample receive errors | ||||
| Sample incorrectly accessioned (test / product) | SR 04 | 765 | 41.8 | 129.5 |
| Historical review incorrect / not done | SR 02 | 472 | 25.8 | 79.9 |
| Demographic review / entry incorrect / not done | SR 03 | 386 | 21.1 | 65.3 |
| Sample testing errors | ||||
| Data entry incorrect | ST 06 | 983 | 38.0 | 81.5 |
| Data entry incomplete / not done | ST 04 | 644 | 24.9 | 53.4 |
| Final check not done / incorrect | ST 20 | 204 | 7.9 | 16.9 |
| Distributor code errors | ||||
| Packaging | DC 04 | 682 | 50.4 | 80.5 |
| Transport | DC 05 | 202 | 14.9 | 23.8 |
| Order incompletely / incorrectly filled | DC 08 | 184 | 13.6 | 21.7 |
| Inventory management errors | ||||
| Product status not / incorrectly updated in computer-internal only (available / discard) | IM 02 | 338 | 67.6 | 39.9 |
| Product ordered incorrectly / not submitted to supplier | IM 04 | 91 | 18.2 | 10.7 |
| Inventory audit not done / incorrect | IM 01 | 37 | 7.4 | 4.4 |
| Product check-in errors | ||||
| Data entry incomplete / not performed/incorrect | PC 01 | 951 | 88.0 | 112.2 |
| Inappropriate return to inventory | PC 05 | 44 | 4.1 | 5.2 |
| Unit confirmation not done / incorrect | PC 06 | 35 | 3.2 | 4.1 |
| Unit storage errors | ||||
| Inappropriate monitoring of storage device | US 03 | 3233 | 91.3 | 381.5 |
| Expired product in stock | US 02 | 145 | 4.1 | 17.1 |
| Unit storage error of unspecified nature | US 99 | 93 | 2.6 | 11.0 |
| Product / test request errors | ||||
| Inappropriate order of a blood product | PR 06 | 944 | 35.4 | 107.7 |
| Order not done / incorrect / incomplete | PR 04 | 502 | 18.8 | 57.3 |
| Order incorrectly entered (online order entry) | PR 02 | 244 | 9.1 | 27.8 |
| Product selection errors | ||||
| Incorrect type / product / unit / dose selected | PS 01 | 104 | 78.2 | 11.0 |
| Special needs not checked | PS 07 | 19 | 14.3 | 2.0 |
| Product selection errors of unspecified nature | PS 99 | 7 | 5.3 | 0.7 |
| Unit manipulation errors | ||||
| Data entry incomplete / incorrect | UM 01 | 223 | 30.8 | 23.7 |
| Special processing not done / incorrectly done | UM 09 | 200 | 27.6 | 21.2 |
| Unit Manipulation errors of unspecified nature | UM 99 | 131 | 18.1 | 13.9 |
| Request for pick-up errors | ||||
| Request for pick-up incomplete | RP 06 | 506 | 29.6 | 58.0 |
| Request for pick-up of unspecified nature | RP 99 | 361 | 21.2 | 41.3 |
| Request for pick-up on wrong patient | RP 01 | 266 | 15.6 | 30.5 |
| Unit issue errors | ||||
| Receipt verification not done (pneumatic tube issue) | UI 21 | 1,735 | 61.7 | 198.7 |
| Data entry incomplete / incorrect | UI 01 | 609 | 21.7 | 69.8 |
| Not checking/incorrect checking of unit and/or patient information) | UI 09 | 147 | 5.2 | 16.8 |
| Unit transfusion errors | ||||
| Incorrect storage of product on floor | UT 04 | 1,763 | 25.0 | 201.9 |
| Documentation not returned | UT 24 | 1,572 | 22.3 | 180.0 |
| Documentation not complete / incorrect | UT 23 | 1,371 | 19.5 | 157.0 |
In Table 8, the DC errors were largely attributable to packaging (50.3%, n=682), transport (14.9%, n=202), and order incompletely or incorrectly filled (13.6%, n=184). The three most frequent SC errors were sample collected unnecessarily (50.6%, n=8,847), sample haemolysed (18.2%, n=3,181), and label incomplete/illegible for non-key patient identifiers (11.8%, n=2,070), for which the corresponding rates were 1,497.2, 538.3, and 350.3 per 100,000. The three most frequent SH errors included no phlebotomist/witness identification (42.9%, n=2,452), patient information missing/incorrect on requisition (22.0%, n=1,258), and sample arrives without requisition (7.4%, n=424).
The relative effectiveness of each clinical setting or transfusion service in the transfusion chain was assessed by comparing the proportion of errors originating from and detected by each setting/unit/service (Table 9). Of the 50,775 errors, approximately 68.5% (n=34,775) and 28.9% (n=14,681) occurred in clinical settings and in the transfusion service, respectively. The highest proportions of errors that occurred in clinical settings were medical/surgical wards (19.8%, n=10,043) and emergency rooms (16.3%, n=8,298). Of the 34,775 errors that occurred in clinical settings, approximately 94.2% (n=32,773) were detected by the transfusion service and 5.6% (n=1,947) by clinical settings. Of the 14,691 errors that occurred in the transfusion service, 97.3% (n=14,277) were discovered by the transfusion service and only 2.7% (n=395) by clinical settings.
e) Localisation of errors
| Location of error discoveryFootnote * | Location of Error Occurrence |
||||||||||
|---|---|---|---|---|---|---|---|---|---|---|---|
| Emergency rooms, Freq. (%)Footnote ** |
Intensive care units, Freq. (%) |
Medical/ surgical wards, Freq. (%) |
Obstetrics, Freq. (%) |
Operating rooms, Freq. (%) |
Out-patient clinics, Freq. (%) |
Laboratory services, Freq. (%) |
Supplier/ Service provider, Freq. (%) |
Transfusion services, Freq. (%) |
Blood supplier, Freq. (%) |
Total, Freq. (%) |
|
| Emergency rooms | 220 (2.7) | 1 (0.0) | 1 (0.0) | 0 (0.0) | 0 | 2 (0.0) | 0 (0.0) | 3 (1.0) | 28 (0.2) | 5 (0.6) | 260 (0.5) |
| Intensive care units | 4 (0.0) | 569 (10.8) | 4 (0.0) | 1 (0.0) | 5 (0.2) | 3 (0.1) | 1 (0.5) | 4 (1.3) | 76 (0.5) | 8 (1.0) | 675 (1.3) |
| Medical/ surgical wards | 24 (0.3) | 4 (0.1) | 460 (4.6) | 0 (0.0) | 0 (0.0) | 5 (0.1) | 0 (0.0) | 6 (2.0) | 74 (0.5) | 14 (1.7) | 587 (1.2) |
| Obstetrics | 0 (0.0) | 1 (0.0) | 0 (0.0) | 28 (1.4) | 1 (0.0) | 0 (0.1) | 0 (0.0) | 0 (0.0) | 8 (0.1) | 0 (0.0) | 38 (0.1) |
| Operating rooms | 4 (0.0) | 1 (0.0) | 8 (0.1) | 0 (0.0) | 322 (9.7) | 10 (0.2) | 1 (0.5) | 7 (2.3) | 62 (0.4) | 6 (0.7) | 421 (0.8) |
| Out-patient clinics | 5 (0.1) | 1 (0.0) | 2 (0.0) | 0 (0.0) | 0 (0.0) | 261 (4.5) | 3 (1.6) | 7 (2.3) | 120 (0.8) | 3 (0.4) | 402 (0.8) |
| Lab services | 9 (0.1) | 5 (0.1) | 13 (0.1) | 0 (0.0) | 7 (0.2) | 7 (0.1) | 8 (4.3) | 1 (0.3) | 2 (0.0) | 0 (0.0) | 53 (0.1) |
| Blood supplier | 0 (0.0) | 0 (0.0) | 0 (0.0) | 0 (0.0) | 0 (0.0) | 0 (0.0) | 2 (1.1) | 2 (0.7) | 27 (0.2) | 10 (1.2) | 41 (0.1) |
| Supplier/ Service provider | 3(0.0) | 2 (0.0) | 4 (0.0) | 0 (0.0) | 3 (0.1) | 1 (0.0) | 0 (0.0) | 3 (1.0) | 7 (0.0) | 0 (0.0) | 23 (0.0) |
| Transfusion services | 8,029 (96.8) | 4,695 (88.9) | 9,551 (95.1) | 1,989 (98.5) | 2,975 (89.8) | 5,534 (95.0) | 172 (92.0) | 268 (89.0) | 14,277 (97.2) | 785 (94.5) | 48,275 (95.1) |
| Total | 8,298 (100) | 5,279 (100) | 10,043 (100) | 2,019 (100) | 3,313 (100) | 5,823 (100) | 187 (100) | 268 (100) | 14,681 (100) | 831 (100) | 50,775 (100) |
|
|||||||||||
| Type of Error | Location of Error |
|||||||||||
|---|---|---|---|---|---|---|---|---|---|---|---|---|
| Emergency rooms | Intensive care units | Medical/surgical wards | Obstetrics | Operating rooms | Out-patient clinics | |||||||
| Freq. | Rate per 100,000 | Freq. | Rate per 100,000 | Freq. | Rate per 100,000 | Freq. | Rate per 100,000 | Freq. | Rate per 100,000 | Freq. | Rate per 100,000 | |
| SC | 5,013 | 4,450.7 | 1,629 | 5,516.2 | 4,863 | 4,357.1 | 1,117 | 2,573.0 | 911 | 5066.2 | 2,259 | 1,073.9 |
| SH | 1,173 | 1,041.4 | 731 | 2,475.4 | 1,323 | 1,185.4 | 427 | 983.6 | 305 | 1696.1 | 1,327 | 630.8 |
| PR | 442 | 710.5 | 513 | 392.1 | 755 | 476.8 | 268 | 3,760.9 | 188 | 149.0 | 273 | 87.1 |
| RP | 288 | 467.2 | 501 | 383.6 | 555 | 353.8 | 88 | 1,248.9 | 89 | 70.5 | 114 | 36.5 |
| UT | 527 | 854.8 | 1,295 | 991.5 | 776 | 494.7 | 86 | 1,220.6 | 1,262 | 999.9 | 1,136 | 363.4 |
|
||||||||||||
In Table 10, the two locations with the highest rates of SC errors were intensive care units and operating rooms, with 5,516.2 and 5,066.2 per 100,000, respectively. SH errors also had the highest rates in intensive care units and operating rooms. Obstetrics had the highest rates of PR, UT, and RP errors.
f) Errors that did not reach (near-miss events) and reached the patient (actual events) by type
| Type of Error | Actual Events | Near-Miss Events | ||||
|---|---|---|---|---|---|---|
| Freq. | % | Rate per 100,000 | Freq. | % | Rate per 100,000 | |
| SC | 44 | 0.3 | 7.4 | 17,441 | 99.7 | 2,951.6 |
| SH | 126 | 2.2 | 21.3 | 5,595 | 97.8 | 946.9 |
| SR | 102 | 5.6 | 17.3 | 1,728 | 94.4 | 292.4 |
| ST | 100 | 3.9 | 8.3 | 2,488 | 96.1 | 206.2 |
| DC | 69 | 5.1 | 8.1 | 1,285 | 94.9 | 151.6 |
| IM | 34 | 6.8 | 4.0 | 466 | 93.2 | 55.0 |
| PC | 20 | 1.9 | 2.4 | 1,061 | 98.1 | 125.2 |
| US | 2 | 0.1 | 0.2 | 3,538 | 99.9 | 417.4 |
| PR | 548 | 20.5 | 62.5 | 2,122 | 79.5 | 242.0 |
| PS | 45 | 33.8 | 4.8 | 88 | 66.2 | 9.3 |
| UM | 57 | 7.9 | 6.1 | 668 | 92.1 | 70.9 |
| RP | 791 | 46.3 | 90.6 | 916 | 53.7 | 104.9 |
| UI | 144 | 5.1 | 16.5 | 2,667 | 94.9 | 305.5 |
| UT | 513 | 7.3 | 58.8 | 6,527 | 92.7 | 747.6 |
| MSFootnote * | 74 | 4.3 | NA | 1,666 | 95.7 | NA |
| Total | 2,669 | 5.2 | NA | 48,256 | 94.8 | NA |
|
||||||
The three highest percentages of actual events were RP (46.3%), PS (33.8%), and PR (20.5%) errors with corresponding cumulative rates of 90.6, 4.8, and 62.5 per 100,000, respectively. The three highest percentages of near-miss events were US (99.9%), SC (99.7%), and PC (98.1%) errors, with corresponding cumulative rates of 417.4, 2,951.6, and 125.2 per 100,000, respectively (Table 11).
g) Errors by type and potential severity
| Type of Error | High Potential Severity | Medium Potential Severity | Low Potential Severity | ||||||
|---|---|---|---|---|---|---|---|---|---|
| Freq. | % | Rate per 100,000 | Freq. | % | Rate per 100,000 | Freq. | % | Rate per 100,000 | |
| SC | 2,840 | 16.2 | 480.6 | 129 | 0.7 | 21.8 | 14,516 | 83.0 | 2,456.6 |
| SH | 1,724 | 30.1 | 291.8 | 247 | 4.3 | 41.8 | 3,750 | 65.5 | 634.6 |
| SR | 184 | 10.1 | 31.1 | 222 | 12.1 | 37.6 | 1,424 | 77.8 | 241.0 |
| ST | 166 | 6.4 | 13.8 | 456 | 17.6 | 37.8 | 1,966 | 76.0 | 163.0 |
| DC | 149 | 11.0 | 17.6 | 82 | 6.1 | 9.7 | 1,123 | 82.9 | 132.5 |
| IM | 6 | 1.2 | 0.7 | 43 | 8.6 | 5.1 | 451 | 90.2 | 53.2 |
| PC | 11 | 1.0 | 1.3 | 48 | 4.4 | 5.7 | 1,022 | 94.5 | 120.6 |
| US | 7 | 0.2 | 0.8 | 19 | 0.5 | 2.2 | 3,514 | 99.3 | 414.6 |
| PR | 988 | 37.0 | 112.7 | 755 | 28.3 | 86.1 | 927 | 34.7 | 105.7 |
| PS | 21 | 15.8 | 2.2 | 61 | 45.9 | 6.5 | 51 | 38.3 | 5.4 |
| UM | 33 | 4.6 | 3.5 | 98 | 13.5 | 10.4 | 594 | 81.9 | 63.1 |
| RP | 306 | 17.9 | 35.0 | 123 | 7.2 | 14.1 | 1,278 | 74.9 | 146.4 |
| UI | 168 | 6.0 | 19.2 | 133 | 4.7 | 15.2 | 2,510 | 89.3 | 287.5 |
| UT | 178 | 2.5 | 20.4 | 514 | 7.3 | 58.9 | 6,348 | 90.2 | 727.1 |
| MSFootnote * | 276 | 15.9 | NA | 122 | 7.0 | NA | 1,342 | 77.1 | NA |
| Total | 7,057 | 13.9 | NA | 3,052 | 6.0 | NA | 40,816 | 80.1 | NA |
|
|||||||||
Of all the 50,925 errors reported between 2012 and 2016, 7,057 (13.9%) were considered to be high-potential severity/risk, 3,052 (6%) medium-potential severity, and 40,816 (80.1%) low-potential severity. The percentages of high-severity cases varied across different types of errors. A large percentage of high-potential severity errors were related to PR (37%), SH (30.1%), RP (17.9%), and SC (16.2%) (Table 12).
h) Errors by type and occurrence time
| Type of Error | Time of Day |
|||||||||||
|---|---|---|---|---|---|---|---|---|---|---|---|---|
| 00:00 - 04:00 | 04:00 - 08:00 | 08:00 - 12:00 | 12:00 - 16:00 | 16:00 - 20:00 | 20:00 - 24:00 | |||||||
| Freq. | % | Freq. | % | Freq. | % | Freq. | % | Freq. | % | Freq. | % | |
| SC | 1,132 | 6.5 | 2,098 | 12.0 | 5,010 | 28.7 | 4,094 | 23.4 | 2,741 | 15.7 | 2,409 | 13.8 |
| SH | 352 | 6.2 | 585 | 10.2 | 1,642 | 28.7 | 1,579 | 27.6 | 890 | 15.6 | 673 | 11.8 |
| SR | 145 | 7.9 | 138 | 7.5 | 458 | 25.0 | 600 | 32.8 | 321 | 17.5 | 168 | 9.2 |
| ST | 150 | 5.8 | 260 | 10.0 | 620 | 24.0 | 784 | 30.3 | 461 | 17.8 | 313 | 12.1 |
| DC | 82 | 6.1 | 79 | 5.8 | 515 | 38.0 | 353 | 26.1 | 200 | 14.8 | 125 | 9.2 |
| IM | 94 | 18.8 | 52 | 10.4 | 134 | 26.8 | 117 | 23.4 | 51 | 10.2 | 52 | 10.4 |
| PC | 22 | 2.0 | 40 | 3.7 | 476 | 44.0 | 360 | 33.3 | 112 | 10.4 | 71 | 6.6 |
| US | 574 | 16.2 | 425 | 12.0 | 1,074 | 30.3 | 702 | 19.8 | 352 | 9.9 | 413 | 11.7 |
| PR | 281 | 10.5 | 336 | 12.6 | 773 | 29.0 | 666 | 24.9 | 377 | 14.1 | 237 | 8.9 |
| PS | 7 | 5.3 | 8 | 6.0 | 31 | 23.3 | 42 | 31.6 | 27 | 20.3 | 18 | 13.5 |
| UM | 59 | 8.1 | 67 | 9.2 | 192 | 26.5 | 220 | 30.3 | 115 | 15.9 | 72 | 9.9 |
| RP | 137 | 8.0 | 128 | 7.5 | 429 | 25.1 | 450 | 26.4 | 336 | 19.7 | 227 | 13.3 |
| UI | 157 | 5.6 | 188 | 6.7 | 966 | 34.4 | 850 | 30.2 | 412 | 14.7 | 238 | 8.5 |
| UT | 403 | 5.7 | 602 | 8.6 | 2,640 | 37.5 | 1,642 | 23.3 | 949 | 13.5 | 804 | 11.4 |
| MS | 149 | 8.6 | 211 | 12.1 | 434 | 24.9 | 601 | 34.5 | 139 | 8.0 | 206 | 11.8 |
| Total | 3,744 | 7.4 | 5,217 | 10.2 | 15,394 | 30.2 | 13,060 | 25.6 | 7,483 | 14.7 | 6,026 | 11.8 |
|
||||||||||||
The majority of events (55.8%) occurred from 8:00 AM to 4:00 PM. A large number of IM and US errors occurred from 0:00 AM to 4:00 AM (Table 13).
Section 2. Errors that did not reach the patient (near-miss events)
| Type of Error | 2012 | 2013 | 2014 | 2015 | 2016 | |||||
|---|---|---|---|---|---|---|---|---|---|---|
| Freq. | Rate per 100,000 | Freq. | Rate per 100,000 | Freq. | Rate per 100,000 | Freq. | Rate per 100,000 | Freq. | Rate per 100,000 | |
| SC | 4,175 | 2,887.6 | 3,991 | 3,014.6 | 3,161 | 3,014.8 | 3,090 | 3,137.2 | 3,024 | 2,734.7 |
| SH | 1,071 | 740.7 | 1,324 | 1,000.1 | 1,018 | 970.9 | 876 | 889.4 | 1,306 | 1,181.0 |
| SR | 418 | 289.1 | 407 | 307.4 | 373 | 355.7 | 252 | 255.9 | 278 | 251.4 |
| ST | 598 | 198.6 | 517 | 190.4 | 494 | 225.9 | 541 | 276.1 | 338 | 154.2 |
| DC | 424 | 209.3 | 302 | 159.5 | 172 | 111.5 | 224 | 154.8 | 163 | 104.0 |
| IM | 108 | 53.3 | 82 | 43.3 | 77 | 49.9 | 91 | 62.9 | 108 | 68.9 |
| PC | 278 | 137.2 | 226 | 119.4 | 172 | 111.5 | 205 | 141.7 | 180 | 114.9 |
| US | 770 | 380.0 | 917 | 484.3 | 602 | 390.3 | 773 | 534.3 | 476 | 303.8 |
| PR | 630 | 298.0 | 433 | 217.6 | 437 | 275.4 | 276 | 196.4 | 346 | 206.8 |
| PS | 26 | 11.5 | 16 | 7.5 | 17 | 9.9 | 15 | 9.9 | 14 | 7.8 |
| UM | 195 | 86.4 | 128 | 59.8 | 111 | 64.7 | 122 | 80.4 | 112 | 62.7 |
| RP | 224 | 106.5 | 239 | 120.7 | 162 | 102.5 | 152 | 108.6 | 139 | 83.4 |
| UI | 558 | 265.3 | 622 | 314.1 | 536 | 339.2 | 362 | 258.6 | 589 | 353.3 |
| UT | 1,867 | 887.8 | 1,410 | 712.0 | 608 | 384.7 | 969 | 692.1 | 1,673 | 1,003.5 |
| MSFootnote * | 248 | NA | 331 | NA | 320 | NA | 355 | NA | 412 | NA |
| Total | 11,590 | NA | 10,945 | NA | 8,260 | NA | 8,303 | NA | 9,158 | NA |
|
||||||||||
A downward trend in the annual rate per 100,000 of DC errors that did not reach the patient was observed from 209.3 in 2012 to 104 in 2016. Annual rates of SC, SH, SR, and ST errors that did not reach the patient remained relatively stable (Table 14).
| Type of Error | 2012 | 2013 | 2014 | 2015 | 2016 | |||||
|---|---|---|---|---|---|---|---|---|---|---|
| Freq. | Rate per 100,000 | Freq. | Rate per 100,000 | Freq. | Rate per 100,000 | Freq. | Rate per 100,000 | Freq. | Rate per 100,000 | |
| SC | 4,152 | 2,871.6 | 3,978 | 3,004.7 | 3,147 | 3,001.4 | 3,077 | 3,124.0 | 3,018 | 2,729.2 |
| SH | 1,063 | 735.2 | 1,317 | 994.8 | 1,012 | 965.2 | 869 | 882.3 | 1,302 | 1,177.4 |
| SR | 408 | 282.2 | 389 | 293.8 | 367 | 350.0 | 242 | 245.7 | 274 | 247.8 |
| ST | 560 | 186.0 | 484 | 178.2 | 466 | 213.1 | 514 | 262.4 | 330 | 150.5 |
| DC | 417 | 205.8 | 296 | 156.3 | 168 | 108.9 | 223 | 154.1 | 159 | 101.5 |
| IM | 102 | 50.3 | 76 | 40.1 | 74 | 48.0 | 88 | 60.8 | 108 | 68.9 |
| PC | 269 | 132.8 | 222 | 117.2 | 167 | 108.3 | 203 | 140.3 | 178 | 113.6 |
| US | 764 | 377.1 | 916 | 483.8 | 600 | 389.0 | 773 | 534.3 | 476 | 303.8 |
| PR | 606 | 286.6 | 415 | 208.6 | 425 | 267.8 | 254 | 180.8 | 335 | 200.3 |
| PS | 23 | 10.2 | 13 | 6.1 | 11 | 6.4 | 13 | 8.6 | 12 | 6.7 |
| UM | 190 | 84.2 | 123 | 57.5 | 107 | 62.4 | 121 | 79.7 | 110 | 61.6 |
| RP | 215 | 102.2 | 231 | 116.6 | 157 | 99.3 | 145 | 103.6 | 135 | 81.0 |
| UI | 541 | 257.3 | 611 | 308.5 | 530 | 335.4 | 351 | 250.7 | 583 | 349.7 |
| UT | 1,825 | 867.8 | 1,375 | 694.3 | 566 | 358.2 | 930 | 664.2 | 1,646 | 987.3 |
| MSFootnote * | 232 | NA | 312 | NA | 308 | NA | 350 | NA | 404 | NA |
| Total | 11,367 | NA | 10,758 | NA | 8,105 | NA | 8,153 | NA | 9,070 | NA |
|
||||||||||
Of the 48,256 near-miss events, discovery was planned for 47,453 errors (98.3%), and discovery was unplanned for 803 (1.7%). There was a downward trend in the annual rate of DC errors that did not reach the patient and that were detected through a planned discovery, from 205.8 to 101.5 per 100,000 between 2012 and 2016 (Table 15).
| Type of Error | 2012 | 2013 | 2014 | 2015 | 2016 | |||||
|---|---|---|---|---|---|---|---|---|---|---|
| Freq. | Rate per 100,000 | Freq. | Rate per 100,000 | Freq. | Rate per 100,000 | Freq. | Rate per 100,000 | Freq. | Rate per 100,000 | |
| SC | 23 | 15.9 | 13 | 9.8 | 14 | 13.4 | 13 | 13.2 | 6 | 5.4 |
| SH | 8 | 5.5 | 7 | 5.3 | 6 | 5.7 | 7 | 7.1 | 4 | 3.6 |
| SR | 10 | 6.9 | 18 | 13.6 | 6 | 5.7 | 10 | 10.2 | 4 | 3.6 |
| ST | 38 | 12.6 | 33 | 12.2 | 28 | 12.8 | 27 | 13.8 | 8 | 3.6 |
| DC | 7 | 3.5 | 6 | 3.2 | 4 | 2.6 | 1 | 0.7 | 4 | 2.6 |
| IM | 6 | 3.0 | 6 | 3.2 | 3 | 1.9 | 3 | 2.1 | 0 | 0.0 |
| PC | 9 | 4.4 | 4 | 2.1 | 5 | 3.2 | 2 | 1.4 | 2 | 1.3 |
| US | 6 | 3.0 | 1 | 0.5 | 2 | 1.3 | 0 | 0.0 | 0 | 0.0 |
| PR | 24 | 11.4 | 18 | 9.0 | 12 | 7.6 | 22 | 15.7 | 11 | 6.6 |
| PS | 3 | 1.3 | 3 | 1.4 | 6 | 3.5 | 2 | 1.3 | 2 | 1.1 |
| UM | 5 | 2.2 | 5 | 2.3 | 4 | 2.3 | 1 | 0.7 | 2 | 1.1 |
| RP | 9 | 4.3 | 8 | 4.0 | 5 | 3.2 | 7 | 5.0 | 4 | 2.4 |
| UI | 17 | 8.1 | 11 | 5.6 | 6 | 3.8 | 11 | 7.9 | 6 | 3.6 |
| UT | 42 | 20.0 | 35 | 17.7 | 42 | 26.6 | 39 | 27.9 | 27 | 16.2 |
| MSFootnote * | 16 | NA | 19 | NA | 12 | NA | 5 | NA | 8 | NA |
| Total | 223 | NA | 187 | NA | 155 | NA | 150 | NA | 88 | NA |
|
||||||||||
A downward trend in the annual rates of PC and SC errors that did not reach the patient and that were detected through an unplanned discovery was observed between 2012 and 2016 (Table 16).
| Type of Error | Small (<2,000 RBC units/year) | Medium (2,000 - 10,000 RBC units/year) | Large (>10,000 RBC units/year) | |||
|---|---|---|---|---|---|---|
| Freq. | Rate per 100,000 | Freq. | Rate per 100,000 | Freq. | Rate per 100,000 | |
| SC | 243 | 665.3 | 2,705 | 1,493.8 | 14,493 | 3,882.5 |
| SH | 185 | 506.5 | 1,054 | 582.0 | 4,356 | 1,166.9 |
| SR | 170 | 465.5 | 136 | 75.1 | 1,422 | 380.9 |
| ST | 108 | 333.6 | 739 | 184.6 | 1,641 | 212.1 |
| DC | 43 | 145.0 | 642 | 219.3 | 600 | 114.3 |
| IM | 20 | 67.5 | 120 | 41.0 | 326 | 62.1 |
| PC | 46 | 155.2 | 383 | 130.8 | 632 | 120.4 |
| US | 673 | 2,270.0 | 96 | 32.8 | 2,769 | 527.3 |
| PR | 46 | 183.5 | 760 | 246.5 | 1,316 | 242.2 |
| PS | 3 | 20.7 | 42 | 12.7 | 43 | 7.2 |
| UM | 35 | 241.9 | 161 | 48.6 | 472 | 79.2 |
| RP | 10 | 46.0 | 459 | 148.8 | 447 | 82.3 |
| UI | 36 | 165.5 | 405 | 131.3 | 2,226 | 410.0 |
| UT | 158 | 726.5 | 1,821 | 590.4 | 4,548 | 837.7 |
| MSFootnote * | 33 | NA | 352 | NA | 1,281 | NA |
| Total | 1,809 | NA | 9,875 | NA | 36,572 | NA |
|
||||||
The rates of SC and SH errors were higher in hospitals of large transfusion volumes than those of small transfusion volumes. However, the rate of US errors was four times higher in hospitals of small transfusion volumes than those of large transfusion volumes (Table 17).
Section 3. Errors that reached the patient (actual events)
| Type of Error | 2012 | 2013 | 2014 | 2015 | 2016 | |||||
|---|---|---|---|---|---|---|---|---|---|---|
| Freq. | Rate per 100,000 | Freq. | Rate per 100,000 | Freq. | Rate per 100,000 | Freq. | Rate per 100,000 | Freq. | Rate per 100,000 | |
| SC | 16 | 11.1 | 7 | 5.3 | 12 | 11.4 | 5 | 5.1 | 4 | 3.6 |
| SH | 51 | 35.3 | 30 | 22.7 | 26 | 24.8 | 10 | 10.2 | 9 | 8.1 |
| SR | 26 | 18.0 | 21 | 15.9 | 17 | 16.2 | 20 | 20.3 | 18 | 16.3 |
| ST | 36 | 12.0 | 21 | 7.7 | 18 | 8.2 | 16 | 8.2 | 9 | 4.1 |
| DC | 16 | 7.9 | 21 | 11.1 | 11 | 7.1 | 15 | 10.4 | 6 | 3.8 |
| IM | 7 | 3.5 | 4 | 2.1 | 4 | 2.6 | 3 | 2.1 | 16 | 10.2 |
| PC | 3 | 1.5 | 2 | 1.1 | 2 | 1.3 | 9 | 6.2 | 4 | 2.6 |
| US | 2 | 1.0 | 0 | 0.0 | 0 | 0.0 | 0 | 0.0 | 0 | 0.0 |
| PR | 129 | 61.0 | 129 | 64.8 | 128 | 80.7 | 81 | 57.7 | 81 | 48.4 |
| PS | 14 | 6.2 | 13 | 6.1 | 5 | 2.9 | 5 | 3.3 | 8 | 4.5 |
| UM | 12 | 5.3 | 15 | 7.0 | 12 | 7.0 | 10 | 6.6 | 8 | 4.5 |
| RP | 141 | 67.1 | 247 | 124.7 | 154 | 97.4 | 124 | 88.6 | 125 | 75.0 |
| UI | 25 | 11.9 | 40 | 20.2 | 15 | 9.5 | 34 | 24.3 | 30 | 18.0 |
| UT | 61 | 29.0 | 57 | 28.8 | 64 | 40.5 | 228 | 162.8 | 103 | 61.8 |
| MSFootnote * | 17 | NA | 13 | NA | 17 | NA | 12 | NA | 15 | NA |
| Total | 556 | NA | 620 | NA | 485 | NA | 572 | NA | 436 | NA |
|
||||||||||
The counts and annual rates of errors that reached the patient are presented in Table 18. The annual rates of SC errors that reached the patient diminished over twofold from 11.1 to 3.6 per 100,000 from 2012 to 2016. There was a downward trend in the annual rates of SH errors that reached the patient, from 35.3 to 8.1 per 100,000 between 2012 and 2016. The annual rates of ST errors that reached the patient decreased over three times from 12 to 4.1 per 100,000 from 2012 to 2016.
As presented in Table 19, the cumulative rate of PR errors that reached the patient was more than two times higher in hospitals with large transfusion volumes than those with small transfusion volumes. The cumulative rate of DC errors that reached the patient was more than seven times higher in hospitals with small transfusion volumes than those with large transfusion volumes.
| Type of Error | Small (<2,000 RBC units/year) | Medium (2,000 - 10,000 RBC units/year) | Large (>10,000 RBC units/year) | |||
|---|---|---|---|---|---|---|
| Freq. | Rate per 100,000 | Freq. | Rate per 100,000 | Freq. | Rate per 100,000 | |
| SC | 0 | 0.0 | 30 | 16.6 | 14 | 3.8 |
| SH | 7 | 19.2 | 14 | 7.7 | 105 | 28.1 |
| SR | 3 | 8.2 | 30 | 16.6 | 70 | 18.8 |
| ST | 2 | 6.2 | 57 | 14.2 | 40 | 5.2 |
| DC | 6 | 20.2 | 47 | 16.1 | 16 | 3.0 |
| IM | 4 | 13.5 | 11 | 3.8 | 19 | 3.6 |
| PC | 3 | 10.1 | 14 | 4.8 | 3 | 0.6 |
| US | 0 | 0.0 | 1 | 0.3 | 1 | 0.2 |
| PR | 10 | 39.9 | 72 | 23.4 | 466 | 85.8 |
| PS | 0 | 0.0 | 16 | 4.8 | 29 | 4.9 |
| UM | 0 | 0.0 | 20 | 6.0 | 37 | 6.2 |
| RP | 10 | 46.0 | 80 | 25.9 | 701 | 129.1 |
| UI | 3 | 13.8 | 83 | 26.9 | 58 | 10.7 |
| UT | 15 | 69.0 | 225 | 72.9 | 273 | 50.3 |
| MSFootnote * | 1 | NA | 50 | NA | 23 | NA |
| Total | 64 | NA | 750 | NA | 1,855 | NA |
|
||||||
| Type of Error | Procedure Delayed Cancelled | Transfusion Delayed | Adverse Reaction | Product Transfused-No Reaction | Incorrect Dose Administered | Lost Traceability | Total | % | ||||||
|---|---|---|---|---|---|---|---|---|---|---|---|---|---|---|
| Freq. | % | Freq. | % | Freq. | % | Freq. | % | Freq. | % | Freq. | % | |||
| SC | 1 | 2.3 | 37 | 84.1 | 0 | 0.0 | 6 | 13.6 | 0 | 0.0 | 0 | 0.0 | 44 | 100 |
| SH | 3 | 2.4 | 103 | 81.7 | 0 | 0.0 | 20 | 15.9 | 0 | 0.0 | 0 | 0.0 | 126 | 100 |
| SR | 2 | 2.0 | 42 | 41.2 | 0 | 0.0 | 57 | 55.9 | 1 | 1.0 | 0 | 0.0 | 102 | 100 |
| ST | 6 | 6.0 | 56 | 56.0 | 1 | 1.0 | 37 | 37.0 | 0 | 0.0 | 0 | 0.0 | 100 | 100 |
| DC | 1 | 1.4 | 62 | 89.9 | 0 | 0.0 | 5 | 7.2 | 1 | 1.4 | 0 | 0.0 | 69 | 100 |
| IM | 0 | 0.0 | 13 | 38.2 | 0 | 0.0 | 3 | 8.8 | 0 | 0.0 | 18 | 52.9 | 34 | 100 |
| PC | 0 | 0.0 | 20 | 100.0 | 0 | 0.0 | 0 | 0.0 | 0 | 0.0 | 0 | 0.0 | 20 | 100 |
| US | 0 | 0.0 | 1 | 50.0 | 0 | 0.0 | 1 | 50.0 | 0 | 0.0 | 0 | 0.0 | 2 | 100 |
| PR | 9 | 1.6 | 380 | 69.3 | 49 | 8.9 | 101 | 18.4 | 9 | 1.6 | 0 | 0.0 | 548 | 100 |
| PS | 0 | 0.0 | 20 | 44.4 | 1 | 2.2 | 22 | 48.9 | 2 | 4.4 | 0 | 0.0 | 45 | 100 |
| UM | 2 | 3.5 | 35 | 61.4 | 0 | 0.0 | 15 | 26.3 | 4 | 7.0 | 1 | 1.8 | 57 | 100 |
| RP | 2 | 0.3 | 785 | 99.2 | 0 | 0.0 | 2 | 0.3 | 2 | 0.3 | 0 | 0.0 | 791 | 100 |
| UI | 0 | 0.0 | 72 | 50.0 | 0 | 0.0 | 60 | 41.7 | 6 | 4.2 | 6 | 4.2 | 144 | 100 |
| UT | 1 | 0.2 | 61 | 11.9 | 15 | 2.9 | 140 | 27.3 | 25 | 4.9 | 271 | 52.8 | 513 | 100 |
| MS | 4 | 5.4 | 62 | 83.8 | 0 | 0.0 | 6 | 8.1 | 2 | 2.7 | 0 | 0.0 | 74 | 100 |
| Total | 31 | 1.2 | 1,749 | 65.5 | 66 | 2.5 | 475 | 17.8 | 52 | 1.9 | 296 | 11.1 | 2,669 | 100 |
Of the 2,669 errors that reached the patient, 2.5% (n=66) resulted in adverse reaction; 65.5% (n=1,749) were attributable to transfusion delay; 17.8% (n=475) of errors that did not result in an adverse reaction were discovered after the product had been transfused; and 11.1% (n=296) were associated with lost traceability (Table 20).
| Event definition | Event code | ABO incompati-bility | TACO | OtherFootnote * | Acute haemolytic transfusion reaction | Delayed haemolytic transfusion reaction | Febrile non-haemolytic reaction | IVIG Headache | Minor allergic reaction | Incorrect dose administered | Total (%) |
|---|---|---|---|---|---|---|---|---|---|---|---|
| Order not done / incorrect / incomplete | PR 04 | 0 | 7 | 0 | 0 | 0 | 0 | 0 | 0 | 0 | 7 (10.4) |
| Inappropriate order of a blood product | PR 06 | 0 | 9 | 0 | 0 | 1 | 9 | 0 | 2 | 0 | 21 (31.3) |
| Product request error of unspecified nature | PR 99 | 0 | 21 | 0 | 0 | 0 | 0 | 0 | 0 | 0 | 21 (31.3) |
| Incorrect type / product / unit / dose selected | PS 01 | 0 | 0 | 0 | 1 | 0 | 0 | 0 | 0 | 1 | 2 (3.0) |
| Sample testing error of unspecified nature | ST 99 | 0 | 0 | 0 | 0 | 1 | 0 | 0 | 0 | 0 | 1 (1.5) |
| Administered product to wrong patient | UT 01 | 1 | 0 | 1 | 0 | 0 | 0 | 0 | 0 | 0 | 2 (3.0) |
| Administered wrong type / dose of product to patient | UT 02 | 0 | 0 | 0 | 1 | 0 | 0 | 0 | 0 | 0 | 1 (1.5) |
| Appropriate monitoring of patient not done | UT 11 | 0 | 2 | 0 | 0 | 0 | 0 | 0 | 0 | 0 | 2 (3.0) |
| Guidelines for infusion time not followed | UT 25 | 0 | 6 | 0 | 0 | 0 | 0 | 0 | 1 | 0 | 7 (10.4) |
| Transfusion reaction protocol not followed | UT 26 | 0 | 0 | 0 | 0 | 0 | 2 | 1 | 0 | 0 | 3 (4.5) |
| Total (%) | 1 (1.5) | 45 (67.2) | 1 (1.5) | 2 (3.0) | 2 (3.0) | 11 (16.4) | 1 (1.5) | 3 (4.5) | 1 (1.5) | 67 (100) | |
|
|||||||||||
Approximately 2.5% (n=67) of the errors that reached the patient resulted in harm (Table 21). The most common cases of harm were TACO (45 cases, 67.2%), febrile non-haemolytic reactions (FNHR) (11 cases, 16.4%), minor allergic reactions (3 cases, 4.5%), acute haemolytic transfusion reaction (AHTR) (2 cases, 3%), and delayed haemolytic transfusion reaction (DHTR) (2 cases, 3%). Errors that led to TACO were related to PR [product order not done or incorrect (PR 04), inappropriate order of a blood product (PR 06), other unspecified PR error (PR 99)], and UT [not following guidelines for infusion time (UT 25) and appropriate monitoring of patient not done (UT 11)]. Those that resulted in febrile non-haemolytic and minor allergic reactions were due to PR [inappropriate order of blood product (PR 06)] and UT [not following transfusion reaction protocol (UT 26) and not following guidelines for infusion time (UT 25)]. Other harmful events that resulted from errors included a case of ABO incompatibility due to administered wrong type / dose of product to patient (UT 01) and a case of IVIG-related headache caused by not following transfusion reaction protocol (UT 26).
Those two cases of AHTR occurred in the year 2012 and 2015, respectively. The first case was related to the incorrect product selected. Two units of group O incompatible apheresis plasma were selected and transferred to an urgent patient of unknown blood group. Laboratory work was initiated, however, the test results were not available prior to transfusion due to the urgency of the situation. As per follow-up laboratory tests, the patient was group B positive and showed evidence of hemolysis after the transfusion, which resolved within a few days of the event. The second case was an issue regarding an administered wrong dose to patient combined with a computerized provider order entry (CPOE) error. The physician ordered more IVIG than required, which caused a 4th dose of IVIG to a Group A patient and resulted in severe hemolysis after the administration. No further information on the patient was provided.
Section 4. Potential severity of errors
| Type of Error | 2012 | 2013 | 2014 | 2015 | 2016 | |||||
|---|---|---|---|---|---|---|---|---|---|---|
| Freq. | Rate per 100,000 | Freq. | Rate per 100,000 | Freq. | Rate per 100,000 | Freq. | Rate per 100,000 | Freq. | Rate per 100,000 | |
| SC | 500 | 345.8 | 613 | 463.0 | 617 | 588.5 | 587 | 596.0 | 523 | 473.0 |
| SH | 324 | 224.1 | 386 | 291.6 | 393 | 374.8 | 317 | 321.8 | 304 | 274.9 |
| SR | 44 | 30.4 | 38 | 28.7 | 41 | 39.1 | 28 | 28.4 | 33 | 29.8 |
| ST | 50 | 16.6 | 41 | 15.1 | 26 | 11.9 | 28 | 14.3 | 21 | 9.6 |
| DC | 37 | 18.3 | 36 | 19.0 | 18 | 11.7 | 39 | 27.0 | 19 | 12.1 |
| IM | 1 | 0.5 | 1 | 0.5 | 1 | 0.6 | 0 | 0.0 | 3 | 1.9 |
| PC | 1 | 0.5 | 5 | 2.6 | 1 | 0.6 | 4 | 2.8 | 0 | 0.0 |
| US | 1 | 0.5 | 1 | 0.5 | 4 | 2.6 | 0 | 0.0 | 1 | 0.6 |
| PR | 233 | 110.2 | 203 | 102.0 | 188 | 118.5 | 162 | 115.3 | 202 | 120.8 |
| PS | 7 | 3.1 | 3 | 1.4 | 6 | 3.5 | 3 | 2.0 | 2 | 1.1 |
| UM | 11 | 4.9 | 10 | 4.7 | 2 | 1.2 | 7 | 4.6 | 3 | 1.7 |
| RP | 67 | 31.9 | 83 | 41.9 | 59 | 37.3 | 43 | 30.7 | 54 | 32.4 |
| UI | 38 | 18.1 | 46 | 23.2 | 23 | 14.6 | 33 | 23.6 | 28 | 16.8 |
| UT | 17 | 8.1 | 42 | 21.2 | 36 | 22.8 | 35 | 25.0 | 48 | 28.8 |
| MSFootnote * | 61 | NA | 62 | NA | 94 | NA | 29 | NA | 30 | NA |
| Total (%) | 1,392 (19.7) | NA | 1,570 (22.2) | NA | 1,509 (21.4) | NA | 1,315 (18.6) | NA | 1,271 (18.0) | NA |
|
||||||||||
High-potential severity UT errors increased threefold from 8.1 to 28.8 per 100,000 from 2012 to 2016. Downward trends in the annual rates of ST errors were observed from 16.6 to 9.6 per 100,000 from 2012 to 2016. Both high-potential severity SC and SH were relatively stable over time (Table 22).
| Type of Error | Location of Error |
|||||||||||
|---|---|---|---|---|---|---|---|---|---|---|---|---|
| Emergency rooms | Intensive care units | Medical/surgical wards | Obstetrics | Operating rooms | Out-patient clinics | |||||||
| Freq. | Rate per 100,000 | Freq. | Rate per 100,000 | Freq. | Rate per 100,000 | Freq. | Rate per 100,000 | Freq. | Rate per 100,000 | Freq. | Rate per 100,000 | |
| SC | 647 | 574.4 | 383 | 1,296.9 | 763 | 683.6 | 370 | 852.3 | 143 | 795.2 | 478 | 227.2 |
| SH | 461 | 409.3 | 186 | 629.8 | 415 | 371.8 | 122 | 281.0 | 111 | 617.3 | 383 | 182.1 |
| PR | 192 | 308.6 | 251 | 191.8 | 376 | 237.5 | 27 | 378.9 | 42 | 33.3 | 95 | 30.3 |
| RP | 51 | 82.7 | 100 | 76.6 | 79 | 50.4 | 8 | 113.5 | 23 | 18.2 | 13 | 4.2 |
| UT | 23 | 37.3 | 28 | 21.4 | 49 | 31.2 | 2 | 28.4 | 45 | 35.7 | 22 | 7.0 |
|
||||||||||||
High-potential severity SC errors occurred most frequently in intensive care units (1,296.9 per 100,000). The two locations with the highest rate of high-potential severity SH errors were intensive care units and operating rooms, with 629.3 and 617.3 per 100,000, respectively. High-potential severity PR and RP errors occurred most frequently in obstetrics with rates of 378.9 and 113.5 per 100,000, respectively. The two locations with the highest rate of high-potential severity UT errors were the emergency rooms and operating rooms, with 37.3 and 35.7 per 100,000, respectively (Table 24).
| Type of Error | 2012 | 2013 | 2014 | 2015 | 2016 | |||||
|---|---|---|---|---|---|---|---|---|---|---|
| Freq. | Rate per 100,000 | Freq. | Rate per 100,000 | Freq. | Rate per 100,000 | Freq. | Rate per 100,000 | Freq. | Rate per 100,000 | |
| SC | 41 | 28.4 | 33 | 24.9 | 31 | 29.6 | 14 | 14.2 | 10 | 9.0 |
| SH | 52 | 36.0 | 80 | 60.4 | 47 | 44.8 | 32 | 32.5 | 36 | 32.6 |
| SR | 58 | 40.1 | 59 | 44.6 | 48 | 45.8 | 33 | 33.5 | 25 | 22.6 |
| ST | 127 | 42.2 | 116 | 42.7 | 90 | 41.2 | 79 | 40.3 | 43 | 19.6 |
| DC | 17 | 8.4 | 21 | 11.1 | 13 | 8.4 | 14 | 9.7 | 17 | 10.9 |
| IM | 10 | 4.9 | 8 | 4.2 | 11 | 7.1 | 9 | 6.2 | 5 | 3.2 |
| PC | 11 | 5.4 | 12 | 6.3 | 8 | 5.2 | 9 | 6.2 | 8 | 5.1 |
| US | 9 | 4.4 | 4 | 2.1 | 2 | 1.3 | 1 | 0.7 | 3 | 1.9 |
| PR | 275 | 130.1 | 144 | 72.4 | 190 | 119.7 | 81 | 57.7 | 65 | 38.9 |
| PS | 19 | 8.4 | 16 | 7.5 | 6 | 3.5 | 10 | 6.6 | 10 | 5.6 |
| UM | 29 | 12.8 | 28 | 13.1 | 21 | 12.2 | 11 | 7.2 | 9 | 5.0 |
| RP | 37 | 17.6 | 36 | 18.2 | 18 | 11.4 | 20 | 14.3 | 12 | 7.2 |
| UI | 36 | 17.1 | 32 | 16.2 | 26 | 16.5 | 21 | 15.0 | 18 | 10.8 |
| UT | 153 | 72.8 | 207 | 104.5 | 55 | 34.8 | 58 | 41.4 | 41 | 24.6 |
| MSFootnote * | 19 | NA | 37 | NA | 30 | NA | 14 | NA | 22 | NA |
| Total | 893 | NA | 833 | NA | 596 | NA | 406 | NA | 324 | NA |
|
||||||||||
The total reported errors of medium-potential severity decreased from 2012 to 2016, with the highest frequency of errors (n=893) reported in 2012 and the lowest frequency of errors (n=324) reported in 2016. Downward trends in the annual rates of ST, UM, and UI errors of medium-potential severity were also observed. The annual rates of DC and PC errors of medium-potential severity remained relatively stable. The rates of SR, ST, UI, and RP remained stable up until 2015 and then decreased in 2016. Of the 3,052 errors reported from 2012-2016, a high frequency of medium-potential severity errors were related to PR, UT, and ST. Overall, PR had the highest annual error rate in 2012 and 2014-2016, whereas UT errors had the highest annual rate in 2013.
| Type of Error | 2012 | 2013 | 2014 | 2015 | 2016 | |||||
|---|---|---|---|---|---|---|---|---|---|---|
| Freq. | Rate per 100,000 | Freq. | Rate per 100,000 | Freq. | Rate per 100,000 | Freq. | Rate per 100,000 | Freq. | Rate per 100,000 | |
| SC | 3,650 | 2,524.4 | 3,352 | 2,531.9 | 2,525 | 2,408.2 | 2,494 | 2,532.1 | 2,495 | 2,256.3 |
| SH | 746 | 516.0 | 888 | 670.7 | 604 | 576.1 | 537 | 545.2 | 975 | 881.7 |
| SR | 343 | 237.2 | 331 | 250.0 | 301 | 287.1 | 211 | 214.2 | 238 | 215.2 |
| ST | 456 | 151.5 | 381 | 140.3 | 396 | 181.1 | 450 | 229.7 | 283 | 129.1 |
| DC | 386 | 190.5 | 266 | 140.5 | 152 | 98.6 | 186 | 128.6 | 133 | 84.9 |
| IM | 104 | 51.3 | 77 | 40.7 | 69 | 44.7 | 85 | 58.8 | 116 | 74.0 |
| PC | 269 | 132.8 | 211 | 111.4 | 165 | 107.0 | 201 | 138.9 | 176 | 112.3 |
| US | 762 | 376.1 | 912 | 481.6 | 596 | 386.4 | 772 | 533.6 | 472 | 301.3 |
| PR | 251 | 118.7 | 215 | 108.1 | 187 | 117.8 | 114 | 81.1 | 160 | 95.6 |
| PS | 14 | 6.2 | 10 | 4.7 | 10 | 5.8 | 7 | 4.6 | 10 | 5.6 |
| UM | 167 | 74.0 | 105 | 49.1 | 100 | 58.3 | 114 | 75.1 | 108 | 60.5 |
| RP | 261 | 124.1 | 367 | 185.3 | 239 | 151.2 | 213 | 152.1 | 198 | 118.8 |
| UI | 509 | 242.0 | 584 | 294.9 | 502 | 317.7 | 342 | 244.3 | 573 | 343.7 |
| UT | 1,758 | 836.0 | 1,218 | 615.0 | 581 | 367.6 | 1,104 | 788.5 | 1,687 | 1,011.9 |
| MSFootnote * | 185 | NA | 245 | NA | 213 | NA | 324 | NA | 375 | NA |
| Total | 9,861 | NA | 9,162 | NA | 6,640 | NA | 7,154 | NA | 7,999 | NA |
|
||||||||||
Of the 40,816 low-potential severity errors that were reported from 2012 to 2016, the highest frequency of total errors was reported in 2012 (n=9,861) and the lowest frequency of total errors was reported in 2014 (n=6,640). The error rates for SC, SR, ST, PC, PR, PS, UM, and UI remained relatively stable from 2012 to 2016. Overall, SC errors had the highest low-potential severity error rate and PS errors had the lowest error rate in each year throughout the five-year period. Overall, the highest rate was SC errors in 2012, with 2,524.4 per 100,000 and the lowest rate was PS errors in 2015, with 4.6 per 100,000.
| Potential Severity | Small (<2,000 RBC units/year) | Medium (2,000 - 10,000 RBC units/year) | Large (>10,000 RBC units/year) | |||
|---|---|---|---|---|---|---|
| Freq. | % | Freq. | % | Freq. | % | |
| High | 125 | 6.7 | 2,139 | 20.1 | 4,793 | 12.5 |
| Medium | 69 | 3.7 | 892 | 8.4 | 2,091 | 5.4 |
| Low | 1,679 | 89.6 | 7,594 | 71.5 | 31,543 | 82.1 |
| Total | 1,873 | 100 | 10,625 | 100 | 38,427 | 100 |
There was a variation in the percentage of reported high-potential severity errors between the hospital sites. The percentage of high-potential severity errors was higher in hospitals of large and medium transfusion volumes than in those of small transfusion volumes (Table 26).
Discussion
The near-misses are not truly indicative of organizational weakness; instead, they may demonstrate that predetermined plans and corrective actions are performed before transfusion. The planned discovery of near-misses can help evaluate current detection and intervention procedures for identifying and mitigating events. Additionally, reporting the unplanned discovery of near-misses can help to identify where mechanisms to detect errors before transfusion may be lacking. As actual events indicate a weakness in the blood transfusion system, appropriate measures may be taken to prevent the continuation of such events. Data presented in this report will help identify critical points in the transfusion chain to develop preventative measures for future improvement.
Although near-misses are discovered and corrected before the transfusion, they are still defined as errors in TESS. These events can still have consequences on the healthcare system and can indirectly impact patients. For example, among the 17,485 SC errors reported by participating hospitals, over 68% of cases were haemolysed samples or were associated with samples that were collected unnecessarily. In addition, intensive care units and operating rooms were identified as clinical areas where SC errors occurred commonly. These errors often resulted in delays in the issuing of blood (due to time needed to correct events before blood product issue), non-productive workload, iatrogenic anemia for infants (due to additional blood loss for samples that cannot be tested), and delayed procedures that were waiting for redrawing sample.
The TESS provides valuable information on errors regardless of their level of severity. The data can be used to identify issues that risk the patient’s safety (e.g., an incident with or without an adverse reaction) and quality issues such as deviations from standard operating procedures (SOPs).
Annual rates of SC errors that indicate to have the potential to cause an ABO-incompatible transfusion remained relatively high and stable from 2012-2016. Despite such a high rate of SC errors, the transfusion service team and clinical health care workers were able to detect the majority of SC errors according to the SOP before an incompatible transfusion could occur because more than 95% of these SC errors were detected by a planned recovery mechanism. Furthermore, there is a decreasing trend in the rate of SC errors that reached the patient from 2012-2016. These results demonstrate that the TESS working group has shown that it is possible to improve some error tracking within clinical and transfusion areas even when there are safety SOPs in place. Future work will target interventions to increase timely error tracking in the clinical settings, particularly those related to sample collection and transfusion documentation. Further analysis is required to understand trends in errors and the impact of intervention measures, with the aim of improving transfusion process, patient safety, and mitigating error-related healthcare costs.
Data Limitations
The trends observed from 2012 to 2016 should be interpreted with caution since the composition of hospitals participating in TESS changed over time and for some errors, the corresponding rates are based on low numbers which are more prone to fluctuation over time. Furthermore, the true incidence of bedside transfusion errors in TESS may be underestimated because surveillance data rely on reporting of clinically relevant events or on indirect methods. Improved error detection capabilities, data cleaning and validation, shortened reporting delay, and changes in reporting practices at the jurisdictional level can contribute to changes in observed trends. Once the data for the summary report has been validated, adjustments made to individual P/T data will be updated in that year's national data. As a result of comparing dynamic databases, small discrepancies between PHAC and provincial or territorial numbers are expected.
Summary
Overall, SC, UT, and SH errors remain the most frequent errors. Transfusion services, medical/surgical wards, and emergency rooms are the locations where most errors occur. Although the total number of errors recorded remains substantially high (n=50,925), only 5.2% (n=2,669) of errors reached the patient, demonstrating that near-misses are much more frequent than actual events. Among the 2,669 actual events that reached the patient, only 2.5% (n=67) resulted in harm to the patient. As clinical settings were less effective in reporting errors, it may be appropriate to audit, review, and update the current transfusion error reporting procedures in these settings. Particular attention may be given to procedures targeting errors related to PR, RP, and UT, as these errors collectively represented the majority of the errors that reached the patient. Enhancing error reporting in both transfusion services and clinical settings will help identify problematic areas for improving transfusion safety. Continued participation in error identification and report efforts through the TESS is a key piece of the ongoing efforts to improve the safety of transfusions in Canada.
References
- Footnote 1
-
Bolton-Maggs PH and Cohen H. Serious Hazards of Transfusion (SHOT) haemovigilance and progress is improving transfusion safety. Br J Haematol 2013;163:303-314.
- Footnote 2
-
Centre for Communicable Diseases and Infection Control. Transfusion Error Surveillance System (TESS)—2008-2011 Summary Results. Centre for Communicable Diseases and Infection Control: Public Health Agency of Canada; 2014.
- Footnote 3
-
Centre for Communicable Diseases and Infection Control. Transfusion Error Surveillance System (TESS)—2012-2013 Report. Centre for Communicable Diseases and Infection Control: Public Health Agency of Canada; 2015.
- Footnote 4
-
Centre for Communicable Diseases and Infection Control. Transfusion Transmitted Injury Surveillance System (TTISS), Summary Results for 2011-2015. Centre for Communicable Diseases and Infection Control: Public Health Agency of Canada; 2019.
Appendix
Appendix 1. Types of errors and corresponding descriptions
| Error Code | Description of Event |
|---|---|
| Errors related to Distributor Codes (DC) | |
| DC 00 | Not specified |
| DC 01 | Collection issues |
| DC 02 | Processing/Testing issues |
| DC 03 | Labelling incorrect |
| DC 04 | Incorrect packaging of product for transport |
| DC 05 | Transport delayed / sent to wrong location |
| DC 06 | Look-back / Trace-back issues |
| DC 07 | Recall process not / incorrectly followed |
| DC 08 | Order incompletely / incorrectly filled |
| DC 99 | Other |
| Errors related to Product Check-in (PC) | |
| PC 00 | Not specified |
| PC 01 | Data entry incomplete/not performed/incorrect |
| PC 05 | Inappropriate return to inventory |
| PC 06 | Unit confirmation not done / incorrect |
| PC 07 | Administrative check not done / incorrect |
| PC 99 | Other |
| Errors related to Inventory Management (IM) | |
| IM 00 | Not specified |
| IM 01 | Inventory audit not done / incorrect |
| IM 02 | Product status not / incorrectly updated in computer-internal only (available / discard) |
| IM 03 | Supplier recall / look back / trace back not addressed appropriately |
| IM 04 | Product ordered incorrectly / not submitted to supplier |
| IM 99 | Other |
| Errors related to Unit Storage (US) | |
| US 00 | Not specified |
| US 01 | Incorrect storage of product in transfusion service |
| US 02 | Expired product in stock |
| US 03 | Inappropriate monitoring of storage device |
| US 04 | Unit stored on incorrect shelf (Group / Autologous / Reserved) |
| US 99 | Other |
| Errors related to Product Request (PR) | |
| PR 00 | Not specified |
| PR 01 | Order for wrong patient |
| PR 02 | Order incorrectly entered (online order entry) |
| PR 03 | Special needs not indicated (e.g. auto, CMV negative) |
| PR 04 | Order not done / incorrect / incomplete |
| PR 06 | Inappropriate order of a blood product (includes duplicate orders) |
| PR 07 | Wrong product ordered (type) |
| PR 99 | Other |
| Errors related to Sample Collection (SC) | |
| SC 00 | Not specified |
| SC 01 | Sample labelled with wrong patient identification |
| SC 02 | Not Labelled |
| SC 03 | Wrong patient collected (not from intended patient) |
| SC 04 | Collected in wrong tube type |
| SC 05 | Sample NSQ (Non-sufficient quantity) |
| SC 06 | Sample haemolysed |
| SC 07 | Label incomplete /illegible for key patient identifiers (name, identification, birthdate) |
| SC 08 | Sample collected unnecessarily |
| SC 09 | Requisition arrives without samples |
| SC 10 | Armband incorrect / not available |
| SC 12 | Label incomplete / illegible for non-key patient identifiers |
| SC 99 | Other |
| Errors related to Sample Handling (SH) | |
| SH 00 | Not specified |
| SH 01 | Sample arrives without requisition |
| SH 02 | Paperwork and sample ID do not match |
| SH 03 | Patient ID incomplete/illegible on requisition |
| SH 04 | No patient ID on requisition |
| SH 05 | No phlebotomist / witness identification |
| SH 06 | Sample arrives with incorrect type of requisition |
| SH 07 | Patient information (other than ID) missing / incorrect on requisition |
| SH 10 | Sample transport issues |
| SH 11 | Incorrect test ordered / requested |
| SH 12 | Test not ordered / requested |
| SH 99 | Other |
| Errors related to Sample Receipt (SR) | |
| SR 00 | Not specified |
| SR 01 | Sample accepted in error |
| SR 02 | Historical review incomplete or inadequate / not done |
| SR 03 | Demographic review / entry incorrect / not done |
| SR 04 | Sample incorrectly accessioned (test / product) |
| SR 99 | Other |
| Errors related to Sample Testing (ST) | |
| ST 00 | Not specified |
| ST 02 | Appropriate sample check(s) not done / incorrect |
| ST 03 | Computer warning overridden |
| ST 04 | Data entry incomplete / not done |
| ST 05 | Sample labelled with incorrect accession label |
| ST 06 | Data entry incorrect |
| ST 09 | Sample / test tubes mixed up / mislabelled |
| ST 12 | Testing not done (ordered / confirmatory) |
| ST 13 | Incorrect testing method chosen |
| ST 14 | Testing performed incorrectly (did not follow SOP) |
| ST 15 | Test result misinterpreted |
| ST 16 | Inappropriate reagents used for testing |
| ST 19 | Additional testing not performed |
| ST 20 | Final check not done / incorrect |
| ST 21 | Administrative check not done / incorrect (after the fact, record review, audit) |
| ST 22 | Sample storage incorrect / inappropriate |
| ST 98 | Quality control related (only to be used as 2nd event code) |
| ST 99 | Other |
| Errors related to Request for Pick-up (RP) | |
| RP 00 | Not specified |
| RP 01 | Request for pick-up on wrong patient |
| RP 02 | Incorrect type / dose of product requested for pick-up |
| RP 03 | Product requested prior to obtaining consent |
| RP 04 | Product requested for pick-up, patient not ready / unavailable |
| RP 05 | Product requested for pick-up IV not ready |
| RP 06 | Request for pick-up incomplete (no Pt. Id, MRN / or product indicated) |
| RP 10 | Product transport issues (internal) |
| RP 99 | Other |
| Errors related to Product Selection (PS) | |
| PS 00 | Not specified |
| PS 01 | Incorrect type / product / unit / dose selected |
| PS 07 | Special needs not checked |
| PS 09 | Special needs misinterpreted |
| PS 99 | Other |
| Errors related to Unit Manipulation (UM) | |
| UM 00 | Not specified |
| UM 01 | Data entry incomplete / incorrect |
| UM 04 | Final check not done / incorrect |
| UM 05 | Labelling incorrect |
| UM 09 | Special processing not done / incorrectly done |
| UM 10 | Administrative check not done / incorrect |
| UM 99 | Other |
| Errors related to Unit Issue (UI) | |
| UI 00 | Not specified |
| UI 01 | Data entry incomplete / incorrect |
| UI 04 | Product issued to wrong patient |
| UI 06 | LIS warning overridden (in error or outside SOP) |
| UI 09 | Not checking/incorrect checking of unit and/or patient information) |
| UI 11 | Product delivered to the incorrect location by the Transfusion Service (physical delivery) |
| UI 19 | Wrong type / dose of product issued to right patient |
| UI 21 | Receipt verification not done (pneumatic tube issue) |
| UI 22 | Issue approval not obtained / documented |
| UI 99 | Other |
| Errors related to Unit Transfusion (UT) | |
| UT 00 | Not specified |
| UT 01 | Administered product to wrong patient |
| UT 02 | Administered wrong type / dose of product to patient |
| UT 04 | Incorrect storage of product on floor |
| UT 05 | Bedside check not done / incorrect (unit / patient info) |
| UT 06 | Administered product with incompatible IV fluid |
| UT 08 | Wrong unit / product chosen from satellite refrigerator |
| UT 11 | Appropriate monitoring of patient not done |
| UT 12 | Floor/clinic did not check for existing units in their area |
| UT 13 | Labelling incorrect |
| UT 22 | Order / consent check not done / incorrect |
| UT 23 | Documentation not complete / incorrect |
| UT 24 | Documentation not returned |
| UT 25 | Guidelines for product infusion not followed |
| UT 26 | Transfusion reaction protocol not followed |
| UT 27 | Monitoring of satellite fridge not done / incorrect |
| UT 28 | Inappropriate preparation of product |
| UT 29 | Product storage tracking incorrect / not done |
| UT 99 | Other |
| Miscellaneous Errors (MS) | |
| MS 00 | Not specified |
| MS 03 | Patient registration incomplete / incorrect |
| MS 04 | Equipment / computer failure |
| MS 05 | Equipment QC not done / documented |
| MS 06 | Reagent/material event |
| MS 07 | Patient incurred event |
| MS 99 | Other |