
Adverse Events Following Immunization (AEFI) Quarterly Report for 2014 – Q3
Safety assessment summary for this Quarter:
- No significant vaccine safety concerns were identified in quarter 3 of 2014.
- An increase in reports of Kawasaki syndrome to the end of 2014 Q3 relative to previous years has been noted (15 in 2014 versus 5, 1 and 8 in 2011, 2012 and 2013 respectively). Several different vaccines were involved including 4 following rotavirus vaccine given with a variety of other regularly scheduled infant vaccines. Kawasaki syndrome is known to occur with highest frequency in infants and toddlers and viral infections have been implicated causes. The increase may be coincidental but has been flagged as a potential concern and will be monitored closely with a more detailed report to follow as part of the Q4 report for 2014. (See Table 3)
- All serious cases were reviewed and most found either to be expected (based on known vaccine-related adverse reactions) or to have alternate explanations, such as community acquired infection; exposures to other agents, such as antibiotics; or pre-existing problems like cardiac disease.
- As in previous quarters the total count of AEFI reports received was lower than that seen in previous quarters reflecting a gap in reporting from jurisdictions that are implementing new electronic reporting systems. We expect an increase in reports received in subsequent quarters to balance this gap.
- An increase in reports of intussusception following rotavirus vaccine noted in Q2 of 2014 was not seen in Q3.
Vaccines are closely monitored in Canada at all phases of the vaccine product 'life cycle' from discovery through market authorization (pre-market) and beyond, as people begin using them (post-market). Many stakeholders are involved in various activities related to vaccine safety assessment and monitoring including the federal government, provincial, territorial and local public health authorities, health care providers, vaccine industry and the public. The Public Health Agency of Canada (the Agency) conducts vigilant post-market safety surveillance through a national reporting system, the Canadian Adverse Events Following Immunization Surveillance System (CAEFISS).
The primary purpose of vaccine post market surveillance is to detect safety concerns. These concerns include a possible increase in the severity or frequency of expected reactions, or occurrence of one or more unexpected events (i.e. an event that is not consistent with Canadian product information or labelling). This allows immunization providers and public health immunization program providers to take public health action at the level of the:
- individual (e.g. further investigation to confirm a diagnosis and determine possible causes, consultation to rule out allergy to one or more vaccine components, or evaluate whether or not to give subsequent doses of a vaccine), and/or
- immunization program (e.g. investigation of a cluster of adverse events, review of procedures to ensure that vaccine storage requirements have been strictly followed, or consider a change in policy to adopt a less reactogenic vaccine).
The Agency also shares adverse event following immunization (AEFI) data with Health Canada, the vaccine regulator in Canada, to enable regulatory action related to vaccines marketed in Canada. These actions may include issuing communications to immunization providers or the public regarding the safety concern or requiring additional information or investigation by the vaccine distributor.
Regular vaccine safety surveillance quarterly reports summarizing CAEFISS data were initiated by the Agency in 2014. The first two Quarterly Reports, summarized all reports of adverse events following immunization (AEFI) received by the Agency in 2014 from Jan 1st to March 31st (Quarter 1) and from Apr 1st to June 30th (Quarter 2), regardless of the date the vaccine was actually given. This Quarter 3 Report provides a similar summary for all reports received from July 1st to September 30th as well as cumulative data spanning the entire year from January 1st to the end of the reporting quarter (September 30th for this report). This provides a focus on each individual quarter but also tracks the trends as Quarterly Reports accumulate during the calendar year.
Both the current (Q3) and cumulative (Q1, Q2 and Q3) quarterly data are compared to an average of all reports received during the same periods of time (Quarter 3 alone and cumulative from Jan 1st to Sept 30th for the average of the last three years (2011- 2013).
Notes on Interpretation: An AEFI is defined as "any untoward medical occurrence which follows immunization and which does not necessarily have a causal relationship with the usage of the vaccine. The adverse event may be any unfavorable or unintended sign, abnormal laboratory finding, symptom or disease". AEFI reports submitted to the Public Health Agency of Canada represent a suspicion, opinion or observation by the reporter as opposed to an assertion or proof that the vaccine may have caused the event. For most events a clear causal relationship is difficult to establish. Additional limitations to AEFI report data include varied reporting standards and underreporting, lack of certainty regarding the diagnostic validity of a reported event, missing information regarding other potential causes and other reporting biases. In short, this information should not be used to estimate the incidence of adverse events..
Results Highlighted for Quarter 3 of 2014
Cumulative counts included in this Quarterly Report (Q3) include reports received from July 1 to September 30th, 2014 and comparisons are made to the average number of reports received in the same quarter over the previous three calendar years (2011-2013). The reports analysed for 2014 were extracted from the CAEFISS database on 28-October-2014 and for 2011-2013 on 29-April-2014 by the Public Health Agency of Canada (the Agency).
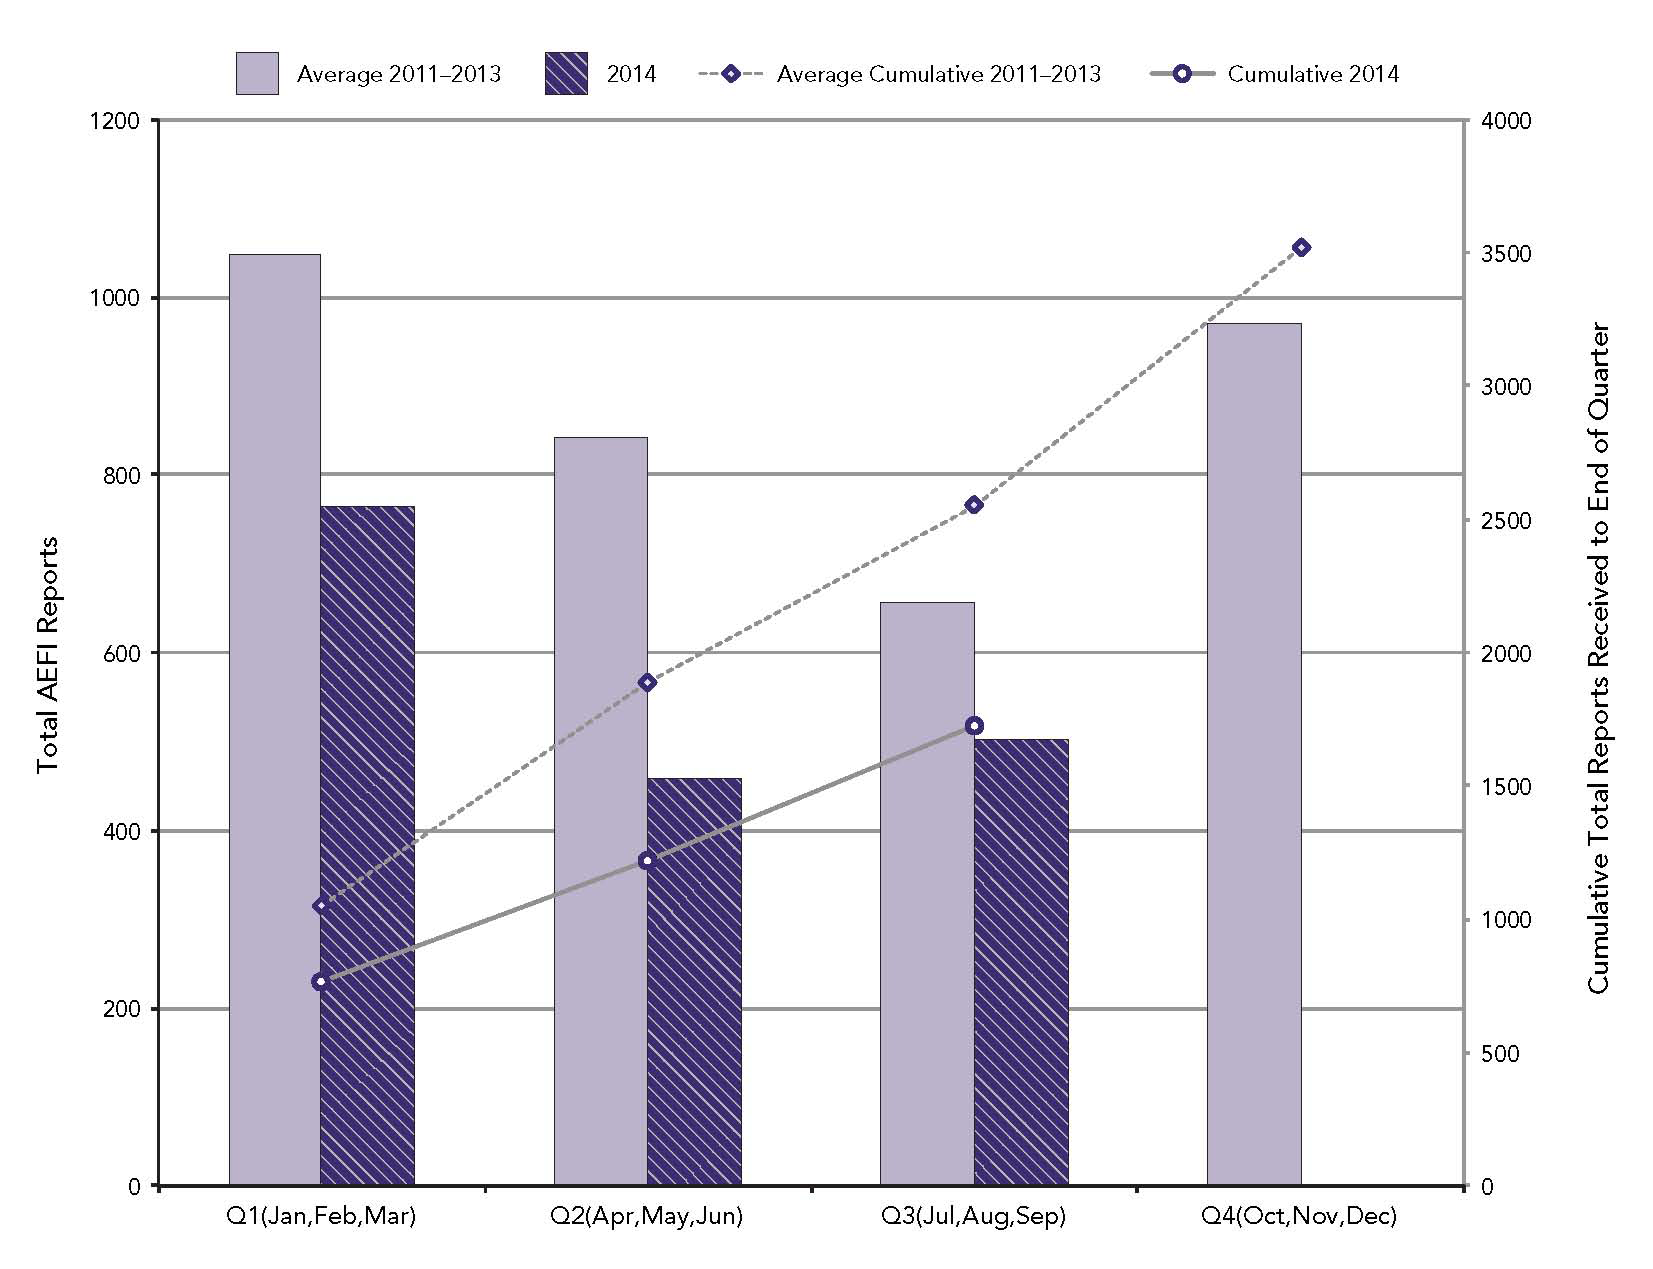
Figure 1: Total AEFI Reports by calendar quarter and cumulative to end of each quarter: 2014 vs. average for 2011-2013
A total of 502 AEFI reports were received by the Agency in Q3 of 2014. During the same periods for 2011, 2012 and 2013, the Agency received an average of 658 (range: 444-854) AEFI reports. The drop in reporting totals for Q3 in 2014 relative to previous years continues a trend seen in Q1 and Q2 and is not unusual. From time to time, there are delays in report transmission from one or more provinces and territories to the Agency, primarily for technical reasons such as implementing a new electronic AEFI reporting system. In such cases the apparent drop in one quarter will be reflected by increased numbers in subsequent quarters.
Text Equivalent
This is a combination bar and line graph. The bars show the total number of AEFI reports received each calendar quarter(Q) with Q1 encompassing January, February and March, Q2 April, May and Jun, Q3 July, August and September and Q4 October, November and December. The line shows the accumulated total reports to the end of each quarter. The primary y-axis on the left hand side of the graph is for the bar graph and shows the total count for each quarter, ranging from 0-1200. The secondary y-axis on the right hand side of the graph is for the line graph and shows the accumulated total count to the end of each quarter, ranging from 0 to 4000. The x-axis is quarter and ranges from Q1 to Q4. Two time periods are depicted on the graph.
The light purple bars shows the average total reports each quarter for 2011, 2012 and 2013: 1049 in Q1, 841 in Q2, 658 in Q3 and 971 in Q4. The dotted line shows the average cumulative total reports received by the end of each quarter for the same three years: 1890 by the end of Q2, 2548 by the end of Q3 and 3519 by the end of Q4.
The dark hatched purple bars show the total reports received each quarter for 2014: 764 in Q1, 459 in Q2 and 502 in Q3. The solid line shows that a cumulative total of 1725 reports were received by the end of Q3, 2014.
Figure 2: Total serious AEFI reports by calendar quarter and cumulative to end of each quarter: 2014 vs. average for 2011-2013.
A total of 53 AEFI reports received by the Agency in Q3 of 2014 were serious (10.6% of all AEFI reports). During the same periods for 2011, 2012 and 2013, the Agency received an average of 52 (range: 45-64) serious AEFI reports representing from 6.8-10.1% of all AEFI reports received in the same quarter for these years.

Text Equivalent
This is a combination bar and line graph. The bars show the total number of serious AEFI reports received each calendar quarter(Q) with Q1 encompassing January, February and March, Q2 April, May and Jun, Q3 July, August and September and Q4 October, November and December. The line shows the accumulated total reports to the end of each quarter. The primary y-axis on the left hand side of the graph is for the bar graph and shows the total count for each quarter, ranging from 0-80. The secondary y-axis on the right hand side of the graph is for the line graph and shows the total count to the end of each quarter, ranging from 0 to 250. The x-axis is quarter and ranges from Q1 to Q4. Two time periods are depicted on the graph.
The light purple bars show the average total reports each quarter for 2011, 2012 and 2013: 57 in Q1, 54 in Q2, 52 in Q3 and 57 in Q4. The dotted line shows the average cumulative total reports received by the end of each quarter for the same three years: 111 by the end of Q2, 163 by the end of Q3 and 220 by the end of Q4.
The dark hatched purple bars show the total reports received each quarter for 2014: 67 in Q1, 37 in Q2 and 53 in Q3. The solid line shows that a cumulative total of 157 reports were received by the end of Q3, 2014.
Frequency of serious and non-serious AEFI Reports by Age Group
There were a few slight changes in age distribution for serious AEFI reports received in Q3 for 2014 relative to previous years. Specifically, as shown in Table 1, the proportion of all serious reports for 1 to <2 year old children was higher in 2014 than previous years (32.1% versus 22.8%) where that for 65 years and older was lower (3.8% versus 14.0%). Table 2 shows the distribution for reports received from January 1 to the end of Q3 and the age differences for 2014 relative to previous years are no longer seen for 1 to <2 year olds or any other age group except seniors which contributed 5.8% of all serious reports in 2014 versus 11.8% for 2011-2013. For non-serious AEFI reports, the age group distribution was similar in 2014 to previous years both for Q3 and the cumulative reports received from January 1 to the end of Q3.
| Age Group | Serious Adverse Events (SAE) | Non-serious Adverse Events (non-SAE) | ||
|---|---|---|---|---|
| 2014 (% total) |
Average for 2011-2013 (% total) | 2014 (% total) |
Average for 2011-2013 (% total) | |
| Unknown | 0 (0) | 0 (0) | 4 (0.8) | 22 (2.2) |
| 65+ years | 2 (3.8) | 8 (14.0) | 27 (5.4) | 86 (8.7) |
| 18-<65 years | 7 (13.2) | 8 (14.0) | 124 (24.8) | 329 (33.2) |
| 7-<18 years | 6 (11.3) | 6 (10.5) | 108 (21.6) | 133 (13.4) |
| 2-<7 years | 6 (11.3) | 6 (10.5) | 59 (11.8) | 126 (12.7) |
| 1-<2 years | 17 (32.1) | 13 (22.8) | 53 (10.6) | 175 (17.6) |
| 0-<1 year | 15 (28.3) | 16 (28.1) | 74 (14.8) | 122 (12.3) |
| Age Group | Serious Adverse Events (SAE) | Non-serious Adverse Events (non-SAE) | ||
|---|---|---|---|---|
| 2014 (% total) |
Average for 2011-2013 (% total) | 2014 (% total) |
Average for 2011-2013 (% total) | |
| Unknown | 3 (1.3) | 1 (0.6) | 21 (1.3) | 57 (2.1) |
| 65+ years | 8 (5.1) | 20 (11.8) | 153 (9.8) | 216 (7.8) |
| 18-<65 years | 25(15.9) | 22 (12.9) | 535 (34.1) | 854 (30.8) |
| 7-<18 years | 12 (7.6) | 17 (10.0) | 287 (18.3) | 392 (14.1) |
| 2-<7 years | 18 (11.5) | 20 (11.8) | 212 (13.5) | 363 (13.1) |
| 1-<2 years | 42 (26.8) | 44 (25.9) | 173 (11.0) | 506 (18.3) |
| 0-<1 year | 50 (31.8) | 46 (27.1) | 187 (11.9) | 383 (13.8) |
Most common vaccines identified in Adverse Events Following Immunization (AEFI) Reports
| Number of Serious Adverse Event (SAE) Reports Received | Number of Non-Serious Adverse Event(non-SAE) Reports Received | |||
|---|---|---|---|---|
| 2014 | Average for 2011-2013 |
2014 | Average for 2011-2013 |
|
| Rota | 10 | 5 | 26 | 26 |
| DTaP-IPV-Hib | 13 | 12 | 56 | 105 |
| DTaP-HB-IPV-Hib | 7 | 5 | 20 | 40 |
| Pneu-C | 17 | 30 | 72 | 156 |
| Men-C | 14 | 24 | 63 | 124 |
| MMR | 2 | 10 | 43 | 131 |
| MMR-Var | 12 | 15 | 34 | 26 |
| Var | 2 | 6 | 19 | 76 |
| DTaP-IPV | 0 | 2 | 16 | 51 |
| Tdap-IPV | 1 | 0 | 16 | 13 |
| HPV | 1 | 1 | 35 | 24 |
| HB | 0 | <1 | 12 | 56 |
| Tdap | 1 | 1 | 60 | 79 |
| Inf | 4 | 4 | 39 | 8 |
| Zos | 1 | <1 | 21 | 17 |
| Pneu-P | 4 | 2 | 24 | 24 |
Table 3 lists the most commonly implicated vaccines among AEFI reports received for Q3 of 2014 relative to the 2011-2013 average reports received for the same quarter. The total serious AEFI reports received during the 3rd quarter of 2014 was either similar to or less than the 2011-2013 average for all vaccines except rotavirus vaccine where the count doubled from 5 to 10. This increase is in part because rotavirus vaccine public programs were just getting started in August 2011 and there was only 1 serious AEFI reported that year. In 2012 and 2013 there were 6 and 9 serious AEFI reports involving rotavirus vaccine in Quarter 3 which is closer to the 10 observed in 2014. However, there was a notable difference in the types of serious AEFI reported. Specifically 4 of the 10 serious AEFI reports in 2014 involved cases of Kawasaki syndrome onsetting 3, 7, 8 and 44 days after the 1st (2 cases) or 2nd (2 cases) dose of rotavirus vaccine. Other infant vaccines were given in all 4 cases. Three cases followed use of Rotarix (TM, GlaxoSmithKline) with the other following Rotateq (TM, Merck). All 4 cases recovered completely with appropriate treatment in hospital. Kawasaki syndrome is an illness seen primarily in infants and young children in which there is widespread inflammation of blood vessels including coronary arteries. The cause is unknown and several different factors such as viral infection are thought to play a role. Kawasaki syndrome has been temporally associated with rotavirus vaccine but a causal role has not been proven. All 4 cases were found by the IMPACT network which actively looks for Kawasaki disease as part of their syndromic adverse event surveillance. The increase in reports observed in the 3rd quarter of 2014 could be due to a combination of coincidence (given a background incidence in children <5 years ranging from 9 to 19 cases /100,000 population) and active surveillance in a population targeted to receive rotavirus vaccine. Nevertheless the increase in reports has been flagged and will be carefully followed throughout the next few quarters. In quarter 2 an increase in the reports of intussusception post rotavirus vaccine was highlighted but this was not seen in quarter 3 where there were 2 reports in 2014 which matched the 0-2 cases reported in previous quarters.
In addition to the 4 reports of Kawasaki syndrome following rotavirus given with other infant vaccines, there were an additional 3 reports of Kawasaki Syndrome in Q3, 2014: 1 after MMR-II (TM, Merck), 1 after Infanrix-IPV/Hib (TM, GlaxoSmithKline) and one after Infanrix-hexa and Priorix-Tetra (TM, GlaxoSmithKline). In total there have been 15 reports of Kawasaki syndrome from January 1st to September 30th, 2014. Rotavirus vaccine was not implicated in reports received prior to Q3. In the same period in previous years there were 5 reports in 2011, 1 report in 2012 and 8 reports in 2013. As noted above Kawasaki Syndrome is known to occur in the infant and toddler age groups and has several implicated aetiologies including viral infections. It is possible that some coincidental factor, such as an increase in viral infection outbreaks in 2014 could be contributing to the increased reporting of Kawasaki Syndrome in 2014 relative to previous years. A more detailed summary of all reports of Kawasaki syndrome will be prepared as part of the Q4 report for 2014 and efforts will be made to determine whether or not there is a general increase in the incidence of Kawasaki syndrome this year relative to the last three.
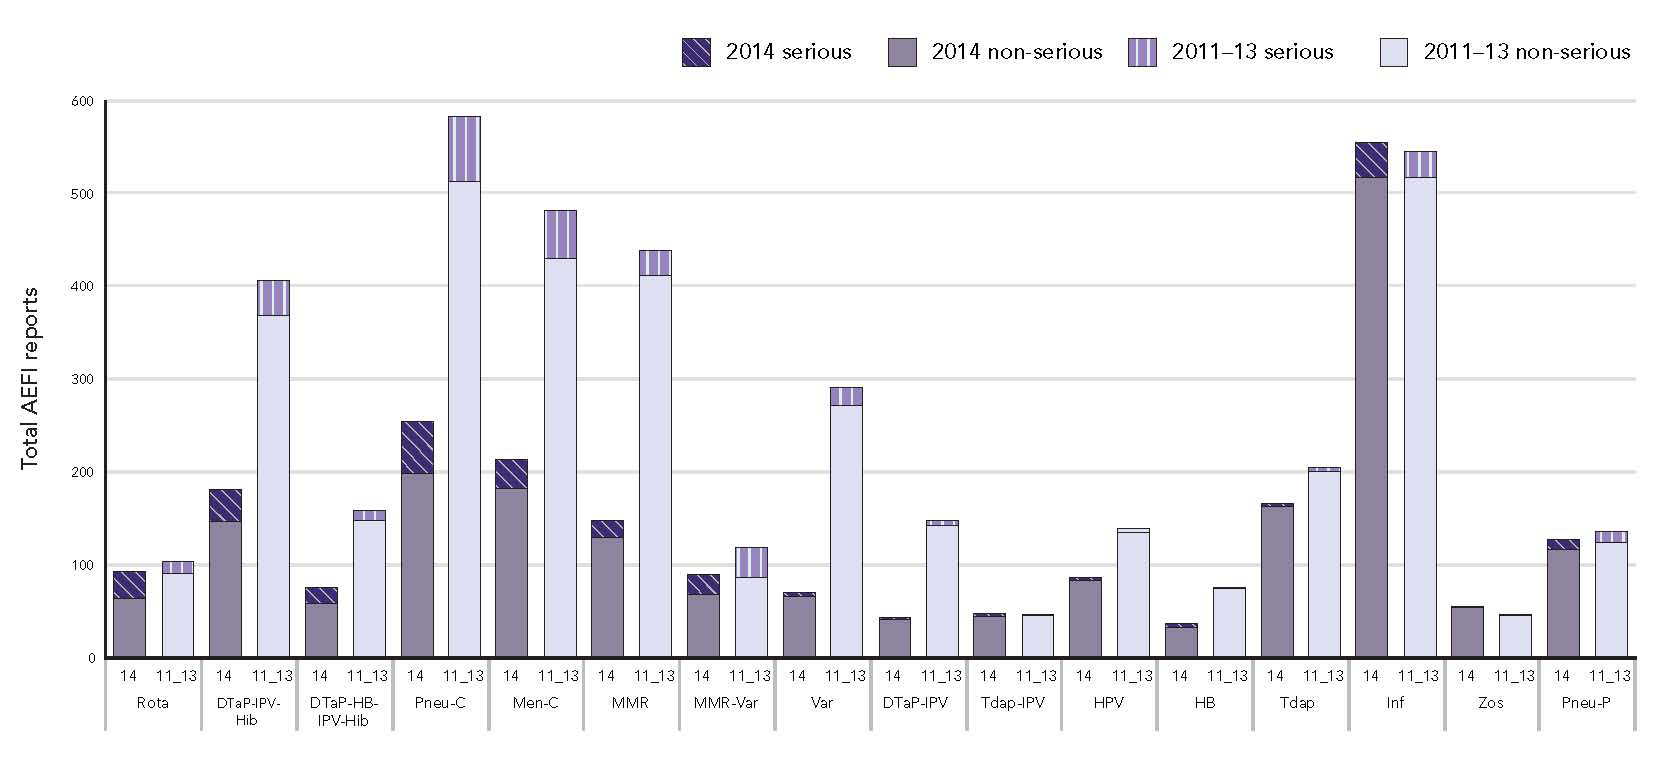
Figure 3 provides a cumulative summary of the most commonly implicated vaccines among AEFI reports received by the Agency from January 1st to September 30th 2014 (combined Quarters 1, 2 and 3) compared to the average in 2011-2013 for the same time frame. Similar to previous quarters of 2014 there was a trend for a lower frequency of non-serious adverse event reports for most commonly administered childhood vaccines (DTaP-IPV-Hib, DTap-HB-IPV-Hib, Pneu-C, Men-C, MMR, Var and DTaP-IPV) relative to the previous three years. The reason for the lower numbers for childhood vaccines (as opposed to those given to adults) is primarily accounted for by delays in reporting from jurisdictions initiating new electronic AEFI reporting infrastructure. These will be captured in subsequent quarterly reports. In contrast the total serious AEFI reporting numbers are relatively unchanged for childhood vaccines, reflecting the significance of the contribution by the IMPACT active syndromic surveillance.
Figure 3: Most common vaccines identified in AEFIs reported from January 1st to end of 3rd Quarter 2014 vs average for 2011-2013.
Text Equivalent
This is a bar graph showing total numbers of non-serious and serious AEFI reports received for specific vaccines at the Public Health Agency to the end of the third quarter (September 30) of 2014 versus the average of reports received to the end of the third quarters of 2011, 2012 and 2013. The y-axis shows the number of reports, ranging from 0 to 600. The x-axis shows specific vaccine groups based on the antigenic content rather than specific brand.
The vaccine groups shown and the number of non-serious/serious AEFI reports received for each to the end of the 3rd quarter in a) 2014 versus b) the average for 2011, 2012 and 2013 respectively are: Rotavirus: a) 64/29 versus b) 91/13, DTaP-IPV-Hib: a) 146/34 versus b) 369/37; DTaP-HB-IPV-Hib: a) 58/18 versus b) 148/10; pneumococcal conjugate: a) 198/56 versus b) 512/70; meningococcal conjugate C: a) 182/31 versus b) 430/52; MMR: a) 130/18 versus b) 411/27; MMRV: a) 69/21 versus b) 86/32; Varicella: a) 66/4 versus b) 271/19; DTaP-IPV: a) 42/1 versus b) 142/5; Tdap-IPV: a) 45/2 versus b) 45/1; HPV: a) 83/4 versus b) 134/5; HB: a) 32/5 versus b) 74/2; Tdap: a) 162/4 versus b) 200/4; Influenza: a) 517/37 versus b) 517/28; Zoster: a) 54/1 versus b) 45/2; Pneumococcal polysaccharide: a) 116/11 versus b) 124/12.
Adverse Events Following Immunization (AEFI) Reported by Main Reason and Seriousness
Classification of AEFIs for Report Purposes: all AEFI reports are reviewed daily by health professionals to assign a main reason for reporting and the associated severity. The classification adheres closely to the national AEFI reporting form in order to provide meaningful feedback to public health authorities, health professionals and the public regarding the adverse event reporting profile. The main categories used when reporting an AEFI, and those reflected on the graph below, are defined as:
- Reactions at or near the vaccination site: most reported events involve inflammation at or near the site of vaccination. Further details can be found in section 9(a) of the reporting form
- Allergic or Allergic-like Events: the most severe allergic event, anaphylaxis, is rare (≤1 episode per 100,000 doses administered). Further details can be found in section 9(b) of the reporting form.
- Neurologic events: seizures are the most commonly reported neurologic event especially in infants and toddlers who are prone to have seizures in association with fever. Such events are reported in Canada relatively frequently because they are actively sought and reported by the IMP-ACT network. Further details can be found in section 9(c) of the reporting form.
- Rash only: to be classified as 'rash only', the rash is the only sign or symptom reported. This would include hives that onset any time after immunization but are accompanied by no other signs or symptoms. Hives are a frequent occurrence in childhood and a cause is often not found.
- Other events specified on the CAEFISS report form: this could include other events such as persistent crying (continuous or unaltered crying ≥ 3 hours, intussusception, hypotonic-hyporesponsive episodes (HHE). Further details can be found in section 9(d) of the reporting form.
Events not clearly falling into one of the categories listed above are classified into one of four additional categories:
- Systemic events: these are primarily events involving many body systems often accompanied by fever. Any recognized syndromes are classified as systemic events and include such illnesses as Kawasaki syndrome, Steven-Johnson syndrome, Henoch-Schonlein purpura, fibromyalgia and serum sickness. In addition evidence for infection of one or more body parts (respiratory infection, bladder infection, etc.) are included in this category as are instances of rash that is non-allergic in origin and is accompanied by other signs and symptoms such as fever, cough and conjunctivitis. General symptoms such as fatigue, malaise, lethargy, headache, myalgias including influenza-like illnesses are classified as systemic events. Finally fever as the only adverse event reported is included in this category.
- Vaccination anxiety related events: this includes fainting (syncope) with or without seizure-like movements which may briefly accompany a fainting episode. Other events included in this category are clusters of events often seen within minutes of immunization indicative of anxiety such as pallor, shakiness, feeling cold, hyperventilation, etc.
- Miscellaneous other events: all other adverse events that don't fit into any of the above categories are captured as miscellaneous events. These may be further categorized by the predominant body system they fall under such as gastrointestinal, cardiac, genitourinary, etc.
- Vaccination error without an associated AEFI: on occasion reports are submitted of an error in immunization without any associated adverse event. Examples include use of an expired product or incorrect administration of a product (e.g. giving a vaccine into the muscle when it should have been injected subcutaneously).
The main reason for reporting serious (SAE) and non-serious (non-SAE) AEFI for Q3 of 2014 compared to the 2011-2013 average is shown in Table 4. The numbers of serious AEFI reports were roughly comparable in 2014 relative to the average for 2011-2013 in Q3.
| Main Reason for Reporting | Number of Serious Adverse Event (SAE) Reports | Number of Non-serious Adverse Event (non-SAE) Reports | ||
|---|---|---|---|---|
| 2014 | Average for 2011-2013 | 2014 | Average for 2011-2013 | |
| Reaction at or near the vaccination site | 5 | 4 | 176 | 200 |
| Allergic or allergic-like events | 2 | 2 | 49 | 57 |
| Neurologic events | 20 | 22 | 15 | 13 |
| Rash only | 0 | 1 | 71 | 144 |
| Other events specified on the CAEFISS form | 5 | 10 | 21 | 24 |
| Systemic events | 15 | 9 | 90 | 74 |
| Vaccination anxiety related events | 0 | 1 | 4 | 6 |
| Miscellaneous other events | 6 | 3 | 23 | 73 |
| Vaccination error without an associated AEFI | 0 | 0 | 0 | 15 |
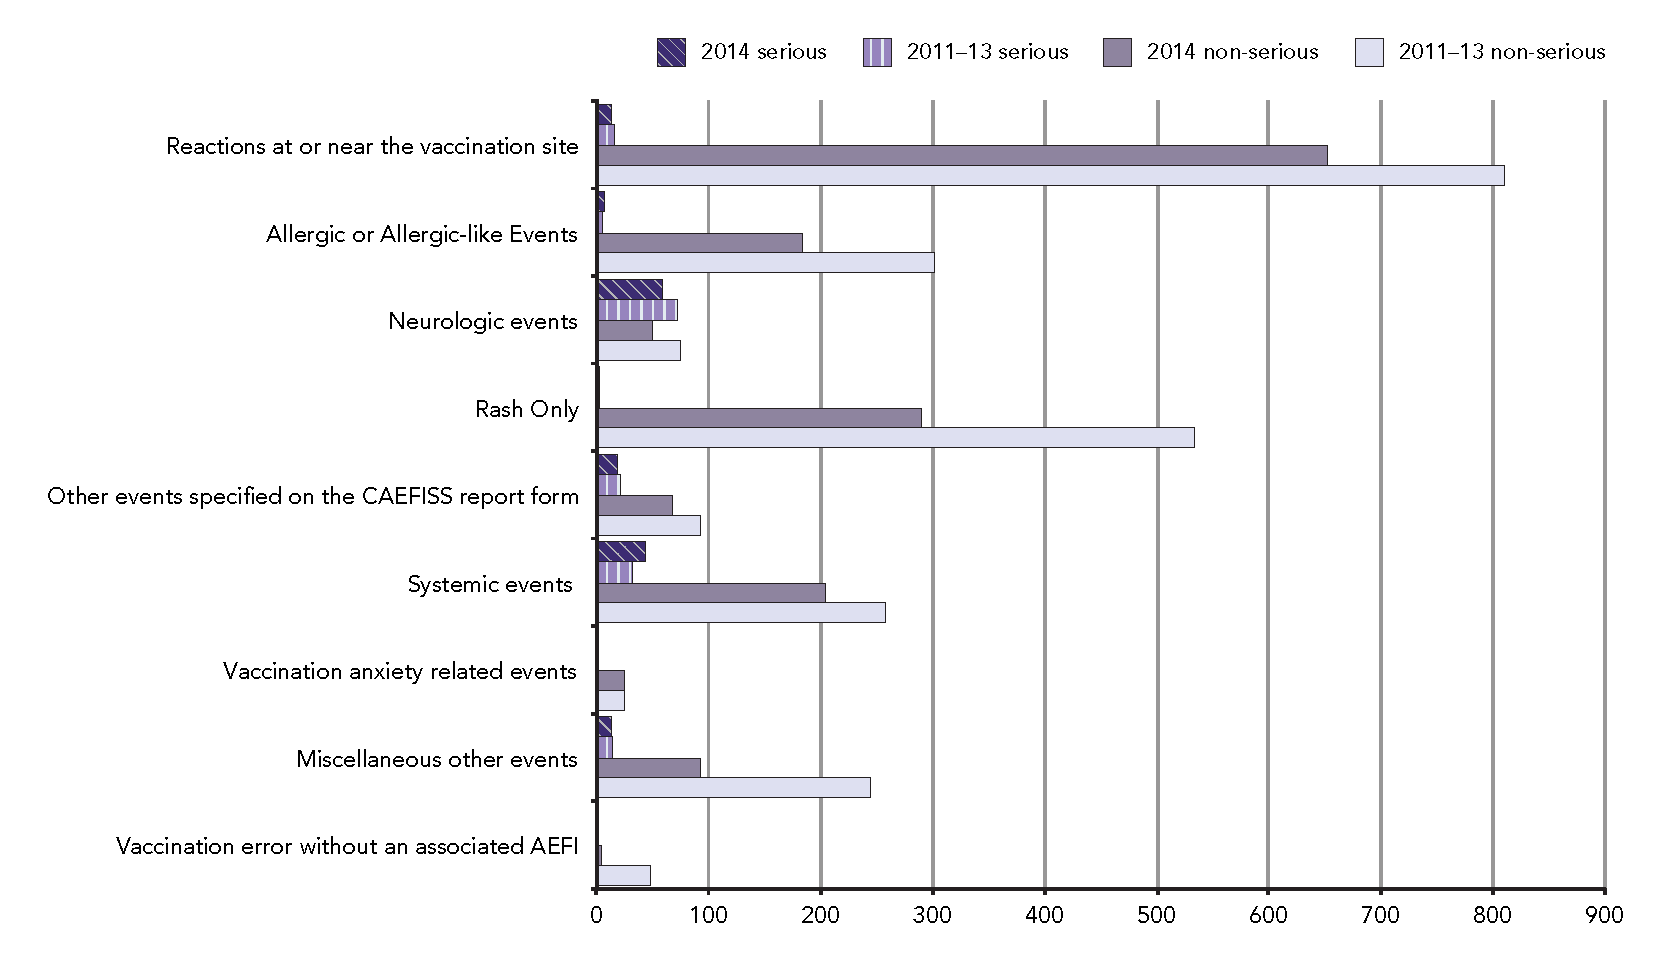
Figure 4 provides a cumulative summary of the same data for reports received from January 1st to Sept 30th (Quarters 1, 2 and 3) in 2014 compared to the average in 2011-2013. As noted in previous quarterly reports the total numbers of non-SAE reports were less 2014 than previous years, but the distribution by main reason for reporting was similar. The most frequently reported non-SAE were reactions at or near the vaccination site, rash as the only event, allergic or allergic like events and systemic events.
Figure 4: Total AEFI reports received from January 1st to end of 3rd Quarter by main reason for reporting and seriousness: 2014 vs. average for 2011-2013
Text Equivalent
This is a bar graph showing the total number of non-serious and serious reports categorized by the main reason for reporting received by the Public Health Agency of Canada to the end of the 3rd quarter (September 30th) of 2014 and the average of 2011, 2012 and 2013 for the same period.
The y-axis shows the 9 different categories of AEFI and the x-axis shows the total number of reports for each category ranging from 0 to 900.
The respective totals for non-serious/ serious AEFI reports received by the end of Q3 were: reactions at or near the vaccination site: 2014: 652/13; 2011-13: 810/16; allergic or allergic-like events: 2014: 184/7; 2011-13: 301/6; neurologic events: 2014: 49/58; 2011-13: 75/71; rash only (in other words rash without any other signs or symptoms): 2014: 290/2; 2011-2013: 533/3; Other events specified on CAEFISS report form: 2014: 68/19; 2011-13: 92/21; systemic events: 2014: 205/44; 2011-13: 258/32; vaccination anxiety related events: 2014: 24/1; 2011-13: 24/1; miscellaneous other events: 2014: 92/13; 2011-13: 244/14; vaccination error without an associated AEFI: 2014: 4/0; 2011-13: 48/0.
Analysis of Serious Adverse Events Following Immunization (SAE) Reports received by the Agency
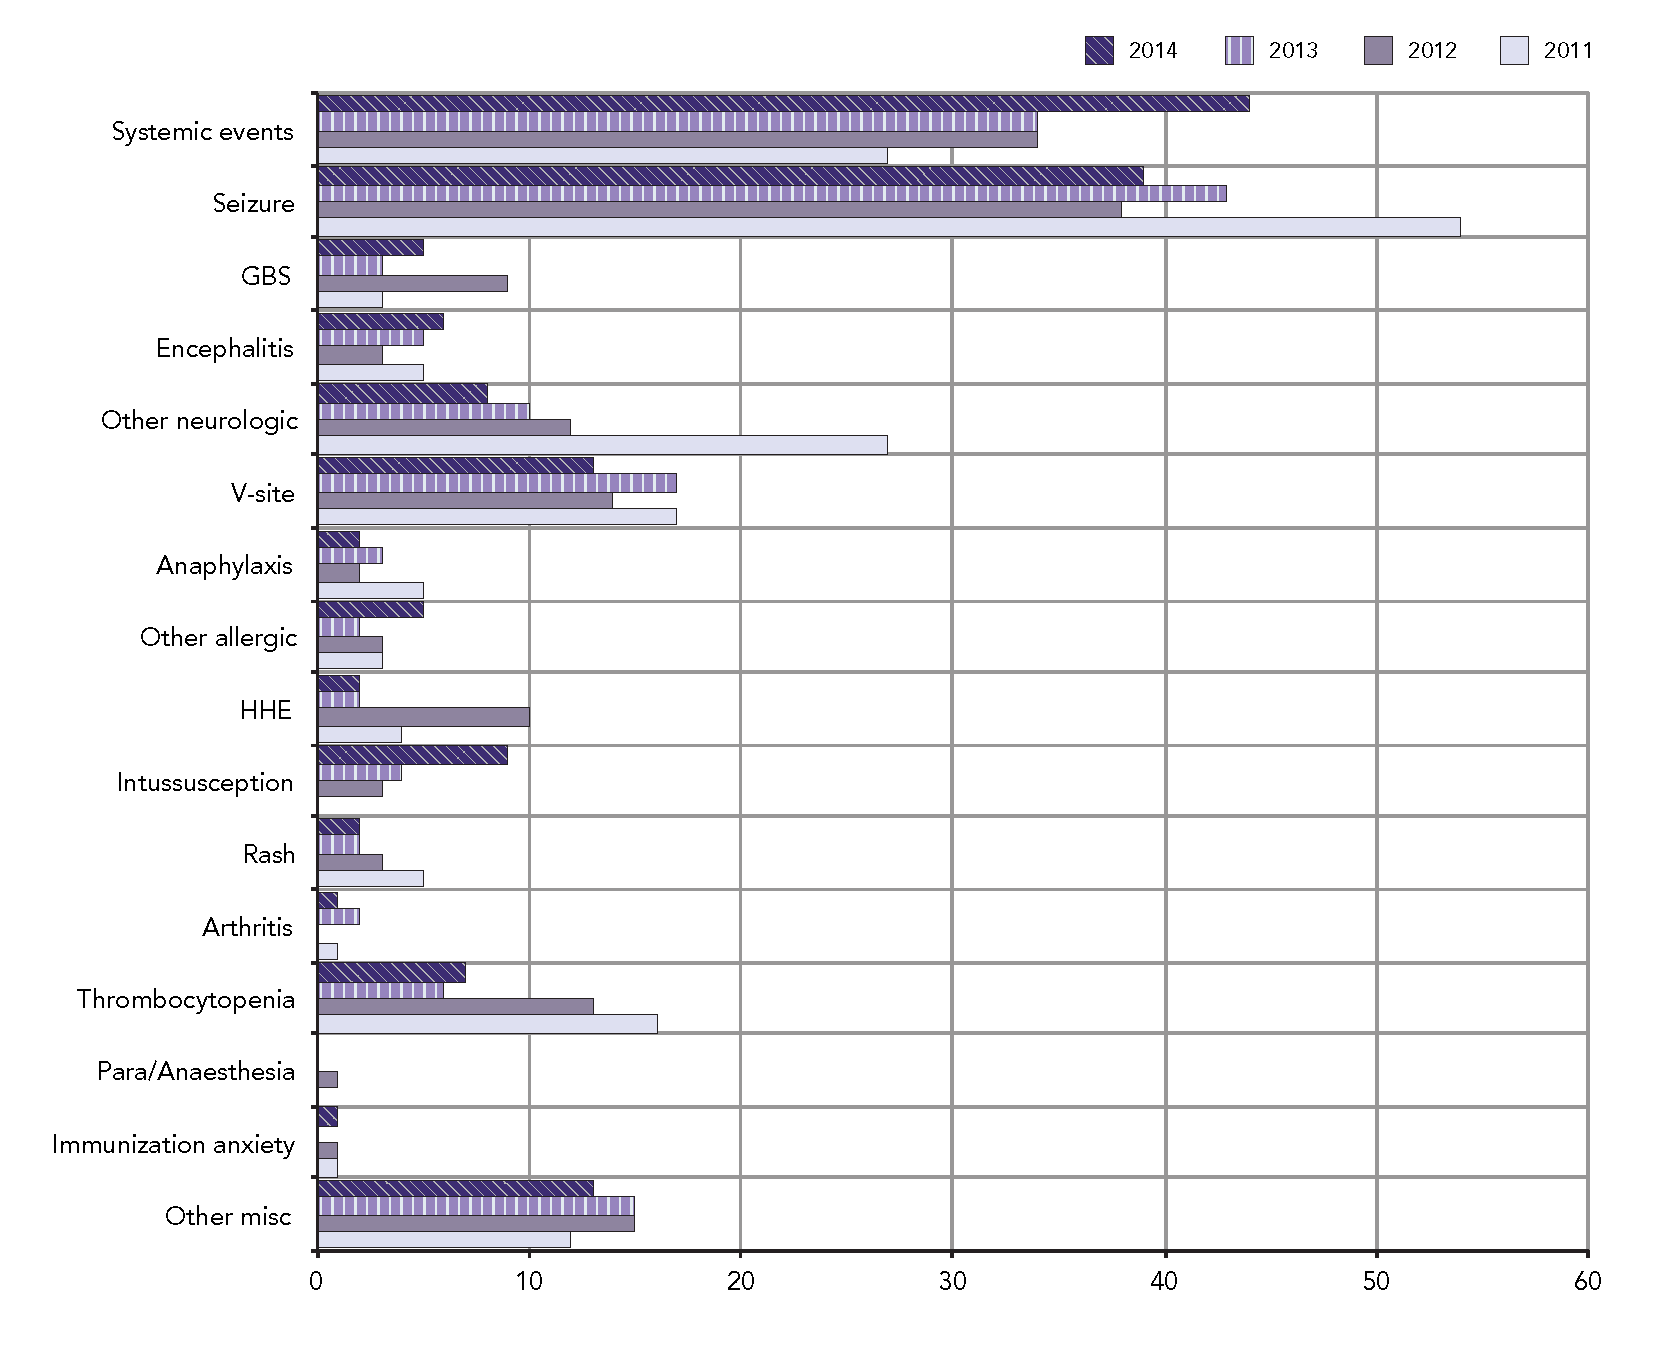
The type of serious adverse events (SAE) reported are described below. Table 5 summarizes the type of SAE reported in Q3 of 2014 compared to the 2011-2013 average. Figure 5 provides a cumulative summary of the same data collected in 2014 (Q1, Q2 and Q3) compared to the average in 2011-2013.
There were a total of 53 SAE reports in Q3 of 2014 (10.6% of 502 reports total). The average for Q3 from 2011 to 2013 was 52 serious reports (7.9% of 658 reports total). As noted in Q1 and Q2, the single most common reason for reporting SAEs in Q3 were seizures usually accompanied by fever. Febrile seizures are actively sought by the pediatric hospital-based Immunization Monitoring Program-Active (IMPACT) network which regularly provides over half of all serious AEFI reported to PHAC for children. Febrile seizures are known to occur after immunization with live attenuated vaccines such as MMR or MMRV as often as once for every 2600 vaccinations given. The events are short-lived and not associated with long term adverse outcomes. The SAE report profile for Q3 2014 was not dissimilar to what has been seen in the same quarter in past years allowing for some small number variation.
| Types of SAE reports | 2011 | 2012 | 2013 | 2014 |
|---|---|---|---|---|
| Systemic events | 12 | 6 | 9 | 15 |
| Seizure | 20 | 17 | 17 | 15 |
| GBS | 0 | 0 | 1 | 1 |
| Encephalitis | 0 | 2 | 0 | 1 |
| Other neurologic | 3 | 2 | 4 | 3 |
| V-site | 7 | 2 | 3 | 5 |
| Anaphylaxis | 3 | 1 | 1 | 0 |
| Other allergic | 1 | 0 | 0 | 2 |
| HHE | 1 | 3 | 1 | 0 |
| Intussusception | 0 | 0 | 2 | 2 |
| Rash | 3 | 0 | 0 | 0 |
| Arthritis | 1 | 0 | 1 | 0 |
| Thrombocytopenia | 9 | 8 | 3 | 3 |
| Para/Anaesthesia | 0 | 0 | 0 | 0 |
| Immunization anxiety | 1 | 1 | 0 | 0 |
| Other misc | 3 | 4 | 3 | 6 |
Figure 5: Total serious AEFI reports received from January 1st to end of 3rd Quarter by type of adverse event: 2014 vs. prior 3 years
Text Equivalent
This is a bar graph showing the total serious reports of specific AEFIs received to the end of the 3rd quarter (September 30th) for each of four different years: 2011, 2012, 2013 and 2014. The y-axis lists the specific AEFI types as described below. The x-axis shows the total number of reports ranging from 0 to 60.
For each specific AEFI type the total reports received, respectively to the end of Q3 for 2011, 2012, 2013 and 2014 were: systemic events: 27, 34, 34 and 44; seizure: 54, 38, 43 and 39; Guillain-Barre syndrome: 3, 9, 3 and 5; encephalitis: 5, 3, 5 and 6; other neurologic events: 27, 12, 10 and 8; reactions at or near the vaccination site: 17, 14, 17 and 13; anaphylaxis: 5, 2, 3 and 2; other allergic events: 3, 3, 2 and 5; hypotonic-hyporesponsive episodes: 4, 10, 2 and 2; intussusception: 0, 3, 4 and 9; rash: 5, 3, 2 and 2; arthritis: 1, 0, 2 and 1; thrombocytopenia: 16, 13, 6 and 7; Para/Anaesthesia: 0, 1, 0 and 0; immunization related anxiety: 1, 1, 0 and 1; other miscellaneous events: 12, 15, 15 and 13.
Page details
- Date modified: