
Down Syndrome Surveillance in Canada 2005-2013
Download the alternative format
(PDF format, 699 Ko, 5 pages)
Organization: Public Health Agency of Canada
Type: Fact Sheet
Date published: 2017-03-01
Cat.: HP35-77/2017E-PDF
ISBN: 978-0-660-07585-3
The birth prevalence of Down syndrome in Canada (excluding Quebec) has been stable in the last decade, averaging 15.8 per 10,000 total births, between 2005 and 2013.
The rate of Down syndrome among stillbirths remained relatively stable around 31.2 per 1,000 stillbirths, except for a slight decrease from 2010 to 2012, while the rate among live births remained stable at approximately 13.5 per 10,000 live births between 2005 and 2013.
Introduction
Down syndrome is the most frequently occurring chromosomal congenital anomaly in Canada. It is a lifelong condition, with a negative impact on infant morbidity and mortality, as well as childhood and adult morbidity. Advanced maternal age is the most significant risk factor associated with Down syndrome.
Down syndrome is usually caused by the presence of an extra chromosome 21. It is one of the most common congenital anomalies worldwide, and approximately 1 in 750 live born babies in Canada has Down syndrome.
Due to well-defined physical characteristics, infants with Down syndrome are identified at birth or shortly thereafter and the diagnosis is confirmed with chromosomal analysis. Children with Down syndrome experience intellectual delays and are at an increased risk for several medical conditionsFootnote 1. Congenital heart defects and respiratory infections are the most frequently reported causes of death in children and young adults with Down syndrome. Childhood leukemia is also associated with Down syndrome.
Prenatal screening for Down syndrome has advanced in both accuracy and early detection. Awareness and monitoring of potential medical health risks and early intervention greatly decrease morbidity and improve the quality of life among individuals with Down syndrome. The rates of Down syndrome vary among Canadian provinces and territories. Variations in maternal age distributions as well as disparities in access to and utilization of prenatal screening and diagnosis (to ascertain Down syndrome, which may lead to subsequent terminations of pregnancy) likely impact the observed regional differences in rates of Down syndrome.
Down syndrome in Canada
The birth prevalence of Down syndrome in Canada from 2005 to 2013 has been stable, averaging 15.8 per 10,000 total births (not shown). Down syndrome rates among stillbirths remained relatively stable, averaging 31.2 per 1,000 stillbirths, except for a slight decrease from 2010 to 2012 (Figure 1, green line). The rate among live births remained stable at approximately 13.5 per 10,000 live births between 2005 and 2013 (Figure 1, blue line).
Figure 1. Down syndrome rates by outcome in Canada (excluding Quebec), 2005-2013
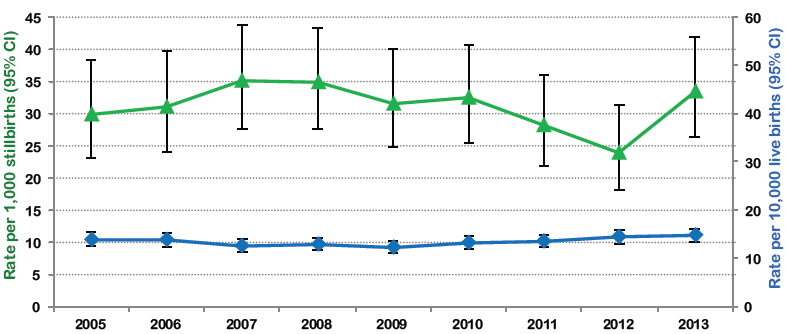
Source: Canadian Institute for Health Information- Discharge Abstract Database
CI: confidence interval
Figure 1 - Text Description
| Rate per 1,000 stillbirths | 95% Confidence interval | Rate per 10,000 live births | 95% Confidence interval | |
|---|---|---|---|---|
| 2005 | 30.0 | 23.0 - 38.4 | 13.9 | 12.5 - 15.4 |
| 2006 | 31.1 | 23.9 - 39.7 | 13.7 | 12.4 - 15.2 |
| 2007 | 35.0 | 27.7 - 43.7 | 12.5 | 11.3 - 13.9 |
| 2008 | 34.8 | 27.6 - 43.4 | 12.9 | 11.6 - 14.3 |
| 2009 | 31.6 | 24.7 - 39.9 | 12.3 | 11.1 - 13.6 |
| 2010 | 32.4 | 25.5 - 40.7 | 13.2 | 11.9 - 14.6 |
| 2011 | 28.2 | 21.8 - 35.9 | 13.6 | 12.3 - 15.0 |
| 2012 | 24.0 | 18.0 - 31.4 | 14.5 | 13.1 - 15.9 |
| 2013 | 33.5 | 26.3 - 42.0 | 14.6 | 13.2 - 16.0 |
| Canada | 15% |
|---|---|
| NL* | 5-10% |
| PE | 0% |
| NS | 34% |
| NB | 11% |
| ON | 10% |
| MB | 13% |
| SK | 10% |
| AB | 11% |
| BC | 18% |
| NT* | 20-25% |
| NU | 0% |
| *range provided due to small cell counts | |
Provincial and territorial prevalence rates
There are variations in the rates of Down syndrome within Canada. Figure 2 shows the observed and expected rates2 of Down syndrome among live births by provinces and territories. The green bars show what the rates of live births with Down syndrome potentially would be in the absence of terminations of affected pregnancies and spontaneous stillbirths. The blue bars show the observed Down syndrome rates which are lower than expected rates in all jurisdictions except Nunavut¥. Variations observed among provinces and territories between the two rates are likely a reflection of differences in the awareness, availability and utilisation of services for pregnant women, the uptake of prenatal diagnosis for Down syndrome and the proportion of affected pregnancies that are terminated. Table 1 shows that there is a wide range in the proportion of Down syndrome cases that are stillborn (at a gestation of 20 weeks or higher). These registered stillbirths account for some of the difference between the expected and observed rates of Down syndrome. Pregnancy terminations performed earlier than 20 weeks of gestation which are not captured by the Canadian Institute for Health Information’s Discharge Abstract Database (CIHI-DAD) could potentially account for the remaining difference between the expected and observed rates of Down syndrome.
Figure 2. Observed and expected Down syndrome rates among live births by provinces and territories in Canada (excluding Quebec), 2005-2013
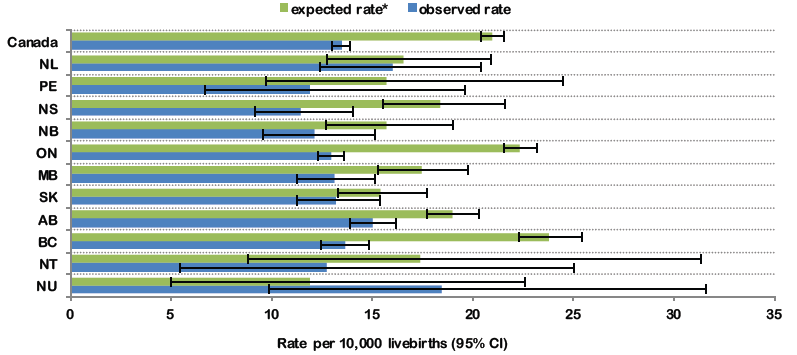
Source: Canadian Institute for Health Information-Discharge Abstract Database.
Yukon rate not shown due to small cell counts (< 5).
* Green bars represent the expected rate of Down syndrome calculated based on the maternal age distribution in the province/territory (per Morris et al. 2002).Footnote 2
Unknown maternal ages were excluded from the expected rate calculations.
¥ Nunavut results should be interpreted with caution due to small number of cases and resulting large confidence intervals.
CI: confidence interval.
Figure 2 - Text Description
| Province and Territories | Expected rate* - Rate per 10,000 livebirths | 95% Confidence interval | Observed rate - Rate per 10, 000 live births | 95% Confidence interval |
|---|---|---|---|---|
| NU | 11.9 | 5.0 - 22.6 | 18.5 | 9.8 - 31.6 |
| NT | 17.3 | 8.8 - 31.4 | 12.7 | 5.5 - 25.1 |
| BC | 23.8 | 22.3 - 25.4 | 13.6 | 12.5 - 14.8 |
| AB | 19.0 | 17.7 - 20.3 | 15.0 | 13.9 - 16.2 |
| SK | 15.4 | 13.3 - 17.7 | 13.2 | 11.2 - 15.4 |
| MB | 17.5 | 15.3 - 19.8 | 13.1 | 11.2 - 15.1 |
| ON | 22.3 | 21.5 - 23.2 | 12.9 | 12.3 - 13.6 |
| NB | 15.7 | 12.7 - 19.0 | 12.1 | 9.5 - 15.1 |
| NS | 18.4 | 15.5 - 21.6 | 11.4 | 9.2 - 14.1 |
| PE | 15.7 | 9.7 - 24.5 | 11.9 | 6.6 - 19.6 |
| NL | 16.5 | 12.8 - 20.9 | 16.0 | 12.4 - 20.4 |
| Canada | 20.9 | 20.4 - 21.5 | 13.5 | 13.0 - 13.9 |
| Maternal age in years | |||
|---|---|---|---|
| Under 35 | 35 and over | Unknown | |
| Canada | 78% | 19% | 3% |
| NL | 80% | 14% | 6% |
| PE | 74% | 14% | 12% |
| NS | 83% | 15% | 2% |
| NB | 86% | 12% | 2% |
| ON | 76% | 20% | 4% |
| MB | 86% | 13% | 1% |
| SK | 88% | 11% | 1% |
| AB | 83% | 16% | 1% |
| BC | 75% | 23% | 2% |
| YK | 78% | 21% | 1% |
| NT | 83% | 14% | 3% |
| NU | 89% | 7% | 4% |
Maternal age and Down syndrome
The risk of having a baby with Down syndrome increases with advancing maternal age. While the risk is highest among older mothers, more than half the babies with Down syndrome are born to mothers under 35 years. This is due to higher fertility rates in younger women. Table 2 shows that in Canada 78% of live births are in women under the age of 35 and that BC, ON and YK have the highest proportion of women giving birth over the age of 35, while Nunavut has the highest proportion of younger mothers. Although only 16% of all live births occur in women between the ages of 35 to 39 (Figure 3), women aged 35-39 years have the highest percentage of babies born with Down syndrome (29%).
Figure 3. Proportion of live births and Down syndrome births within each maternal age category in Canada (excluding Quebec), 2005-2013
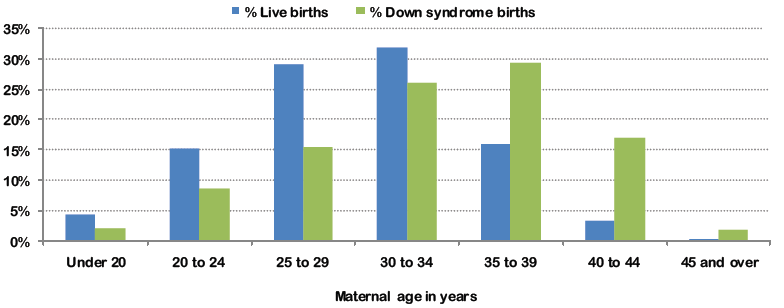
Source: Canadian Institute for Health Information-Discharge Abstract Database
Proportions were calculated after excluding live births and Down syndrome cases with missing maternal ages. Stillbirths were removed due to high proportion of missing maternal age information.
Figure 3 - Text Description
| Under 20 | 20 to 24 | 25 to 29 | 30 to 34 | 35 to 39 | 40 to 44 | 45 and over | |
|---|---|---|---|---|---|---|---|
| % of Live births | 4.4% | 15.3% | 29.1% | 32% | 15.9% | 3.2% | 0.2% |
| % of Down syndrome births | 2.1% | 8.6% | 15.3% | 26.1% | 29.2% | 16.8% | 1.8% |
Despite the trend in delayed childbearingFootnote 3 and advanced maternal age at delivery in the last several decades, rates of Down syndrome in Canada have not increased proportionately. This is due to increased use of prenatal diagnostic procedures followed by terminations of Down syndrome pregnancies. Rates for terminations due to Down syndrome vary widely across Canada, potentially due to differences in access to prenatal screening/pregnancy termination and attitudes of women towards terminating the pregnancy once the diagnosis has been made.
The Society of Obstetricians and Gynecologists of Canada’s (SOGC) clinical care guidelines for prenatal testing advise against using maternal age as the only criterion for invasive prenatal diagnosis. They recommend that prenatal screening for clinically significant fetal aneuploidies be offered to all pregnant women, irrespective of age. However, the methods used for screening and their availability vary between and within provincesFootnote 4.
Definitions, data sources and limitations
Down syndrome as defined by the International Classification of Disease (ICD) corresponds to codes Q900, Q901, Q902 or Q909 (ICD-10). Hospitalization data from CIHI-DAD was used for the analyses. Most women in Canada give birth in hospitals (98.3%), therefore this dataset captures the vast majority of deliveries in Canada. Data from the province of Quebec was not included because this province does not provide data to CIHI-DAD. Down syndrome data were based on an ascertainment period of one year after birth (to detect cases not diagnosed at birth). The dataset used linked maternal delivery records to newborn records to gain additional information such as maternal age, gestational age and maternal conditions at delivery. Surveillance for Down syndrome based on hospitalization data is limited by the exclusion of Down syndrome cases that end in pregnancy termination outside hospital (e.g., out-patient pregnancy termination at <20 weeks gestation) which limits the complete ascertainment of Down syndrome cases.
The Public Health Agency of Canada’s Canadian Perinatal Surveillance System (CPSS) monitors and reports on key indicators of maternal, fetal and infant health in Canada. For more information visit the website.