
Effect of maternal weight on pregnancy outcomes
Low or high prepregnancy body mass index (BMI) and inadequate or excess gestational weight gain (GWG) are associated with adverse pregnancy outcomes, such as caesarean section births, preterm births (PTB) and small-for-gestational-age (SGA) and large-for-gestational-age (LGA) births. Data from the Public Health Agency of Canada's 2005-2006 Maternity Experiences Survey (MES) were used to assess the distribution of prepregnancy BMI and GWG in the population and the contribution of these risk factors to adverse outcomes.
Prior to pregnancy, 5.9%, 20.9% and 13.3% of women were underweight, overweight and obese, respectively (Figure 1). During pregnancy, 18.1% of women gained below the recommended weight, while almost one-half (48.8%) gained above the recommended weight (Figure 2). See Table 1 for BMI-specific GWG recommendations. Underweight BMI and below recommended GWG were associated with younger maternal age, being nulliparous, low socioeconomic status, urban residence and being of East/South Asia/Pacific ethnicity, while overweight and obese BMI and above recommended GWG were associated with being parous, living in Atlantic Canada or the territories and a history of depression.

Download the alternative format
(PDF format, 530 KB, 3 pages)
FIGURE 1: Distribution of prepregnancy BMI
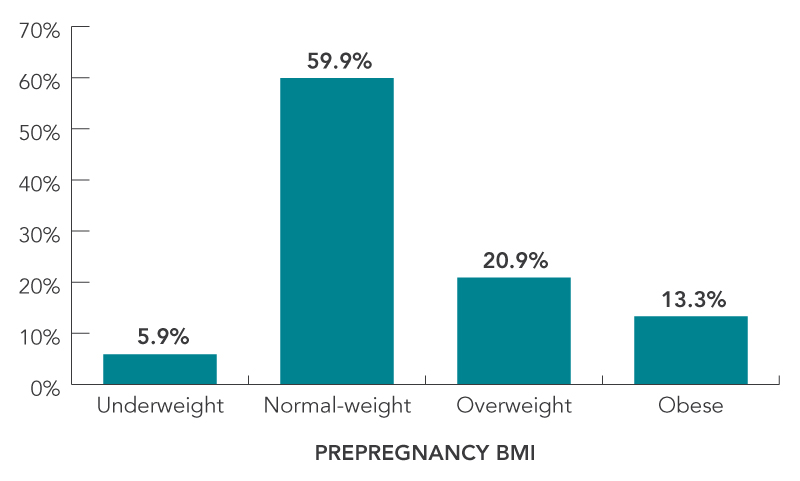
Figure 1 - Text Description
| Prepregnancy BMI | Percentage |
|---|---|
| Underweight | 5.9% |
| Normal-weight | 59.9% |
| Overweight | 20.9% |
| Obese | 13.3% |
FIGURE 2: Distribution of GWG
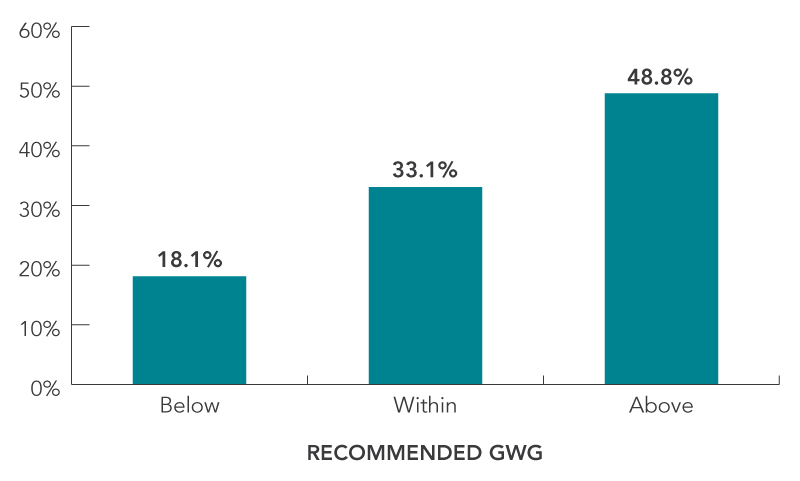
Figure 2 - Text Description
| Gestational weight gain | Percentage |
|---|---|
| Below | 18.1% |
| Within | 33.1% |
| Above | 48.8% |
Effect on Caesarean Delivery
Among all women, overweight or obese BMI and excess GWG contributed to 10.1% and 10.9% of caesarean births, respectively (Figure 3). High BMI or excess GWG contributed to one in five (20.2%) caesarean births. The contribution of maternal weight to caesarean births was highest among parous women with no prior caesarean. Almost one third (31.8%) of caesarean births in these women were attributable to either high BMI or excess GWG. The risk posed by maternal weight was low among women with previous caesarean births due to the increased risk of caesarean birth following a previous caesarean.
FIGURE 3: Contribution of overweight or obese BMI and above recommended GWG to caesarean births
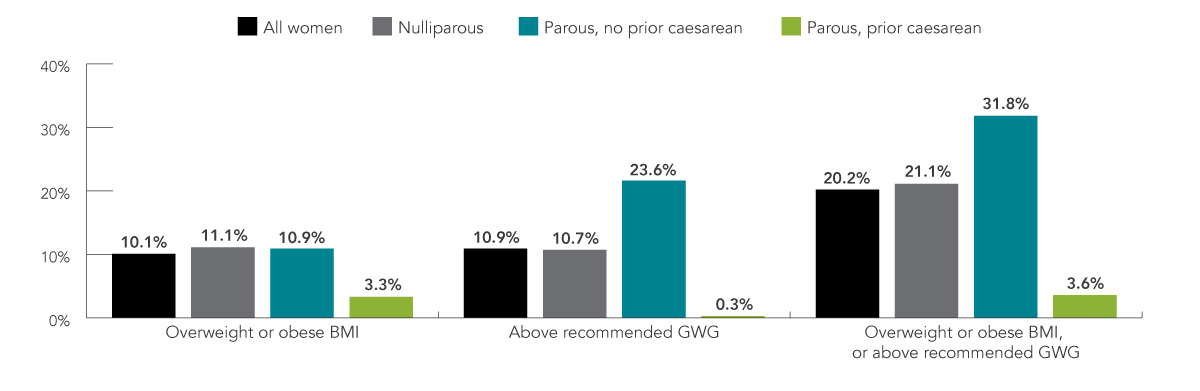
Figure 3 - Text Description
| All women | Nulliparous | Parous, no prior caesarean | Parous, prior caesarean | |
|---|---|---|---|---|
| Overweight or obese BMI | 10.1% | 11.1% | 10.9% | 3.3% |
| Above recommended GWG | 10.9% | 10.7% | 23.6% | 0.3% |
| Overweight or obese BMI, or above recommended GWG | 20.2% | 21.1% | 31.8% | 3.6% |
FIGURE 4: Contribution of BMI, GWG and smoking to PTB
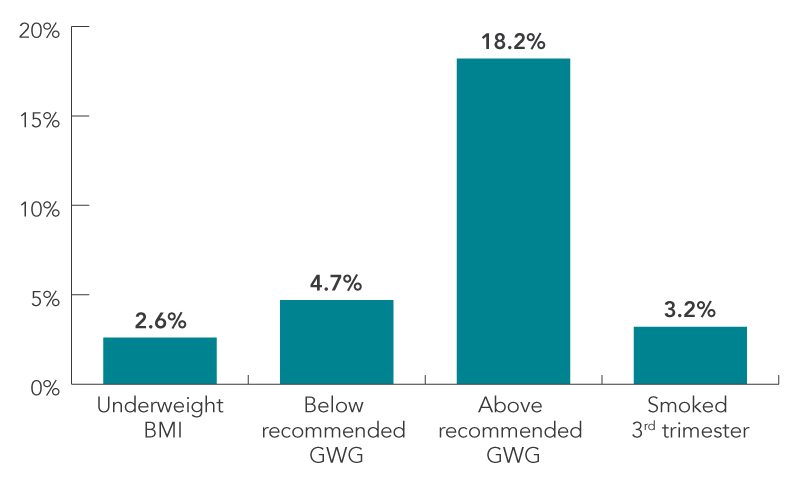
Figure 4 - Text Description
| Contribution | PTB |
|---|---|
| Underweight BMI | 2.6% |
| Below recommended GWG | 4.7% |
| Above recommended GWG | 18.2% |
| Smoked 3rd trimester | 3.2% |
FIGURE 5: Contribution of BMI, GWG and smoking to SGA
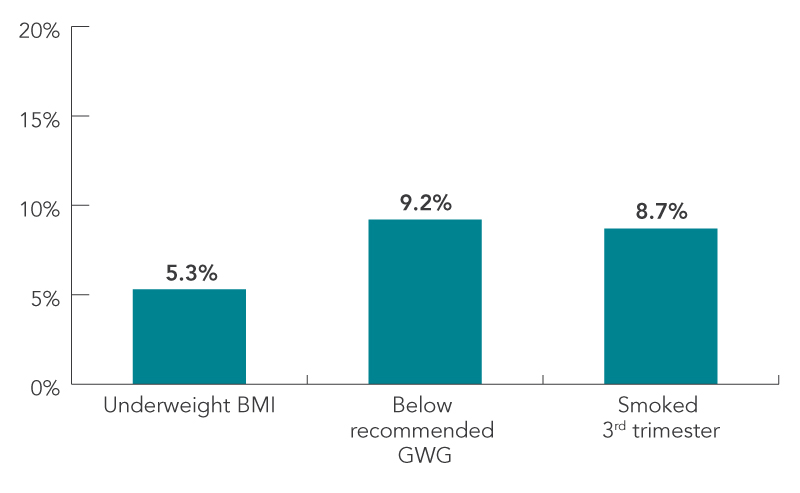
Figure 5 - Text Description
| Contribution | SGA |
|---|---|
| Underweight BMI | 5.3% |
| Below recommended GWG | 9.2% |
| Smoked 3rd trimester | 8.7% |
FIGURE 6: Contribution of BMI and GWG to LGA
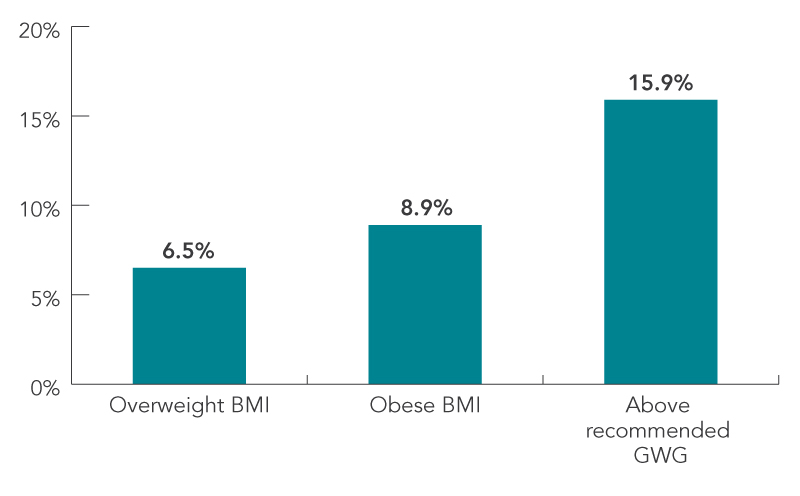
Figure 6 - Text Description
| Contribution | LGA |
|---|---|
| Overweight BMI | 6.5% |
| Obese BMI | 8.9% |
| Above recommended GWG | 15.9% |
| BMI (kg/m2) | RECOMMENDED GWG (kg) |
|---|---|
| Underweight: BMI<18.5 | 12.5–18.0 |
| Normal weight: 18.5≤BMI<25 | 11.5–16.0 |
| Overweight: 25≤BMI<30 | 7.0–11.5 |
| Obese: BMI≥30 | 5.0–9.0 |
Effect on The Newborn
Figures 4 to 6 present the fractions of PTB, SGA and LGA births that were attributable to specific BMI and GWG categories. For PTB and SGA, the contribution of prenatal smoking—a recognized risk factor for these outcomes—is compared.
- Above recommended GWG contributed to 18.2% of PTB, while underweight BMI, below- recommended GWG and smoking in the third trimester each contributed to less than 5% of PTB.
- Below recommended GWG contributed more (9.2%) to SGA births than prenatal smoking (8.7%) or underweight BMI (5.3%).
- Above recommended GWG contributed more (15.9%) to LGA births than being overweight (6.5%) or obese (8.9%).
The risks associated with smoking during pregnancy are well known. It is therefore noteworthy that maternal weight in general, and GWG in particular, contributed more to adverse infant outcomes than prenatal smoking. The contributions of high BMI and excess GWG in particular, are likely to increase as population rates of overweight and obesity rise.
Data Source And Limitations
The MES was a 2005–2006 cross-sectional survey of mothers 15 years of age and older, who had a singleton live birth and whose baby was living with them at the time of the survey interview. Women living on First Nations reserves or in institutions were excluded. MES data are self-reported, which is known to underestimate BMI and GWG values. The degree to which this may have occurred in the MES is unknown.
Conclusion
Strategies to improve pregnancy outcomes in Canada must include measures that promote healthy weight prior to pregnancy and within recommended weight gain during pregnancy.
The Public Health Agency of Canada’s Canadian Perinatal Surveillance System monitors and reports on key indicators of maternal, fetal and infant health. The information presented in this fact sheet is taken from the following two publications:
- Dzakpasu et al., BMC Pregnancy and Childbirth, 2014, 14:106
- Dzakpasu et al., BMC Pregnancy and Childbirth, 2015, 15:21
For more information on Canadian guidelines on GWG, visit Canadian guidelines on GWG
For more information on the CPSS, visit Maternal and Infant Health