
Maternal hypertension in Canada
Summary
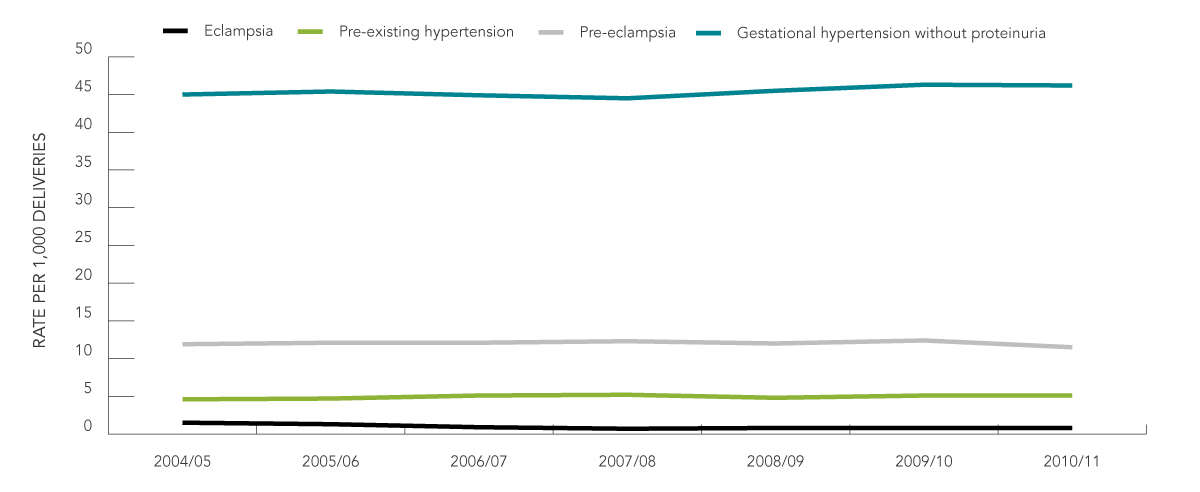
- In 2010/11, the rate of gestational hypertension without proteinuria in Canada was 46.3 (95% CI: 45.4-47.0) per 1,000 deliveries. The overall rates of gestational hypertension without proteinuria increased between 2004/05 and 2010/11 (Table 1 and Figure 1).
- Over the seven-year time period (2004/05–2010/11), the rates of pre-existing hypertension and pre-eclampsia remained relatively stable (Table 1 and Figure 1). Rates of eclampsia have decreased.
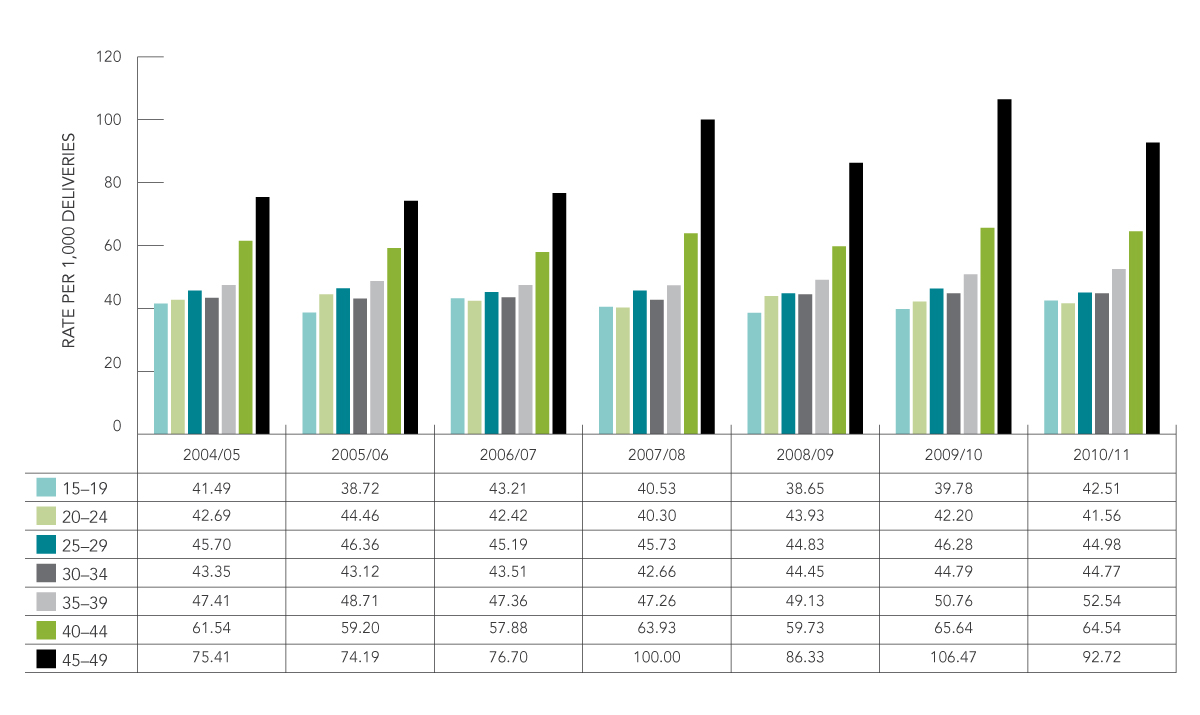
- Differences in the rates of gestational hypertension were observed across age groups. Higher rates were observed among women 40 years and older (Figure 2).
- The overall rates of gestational hypertension varied across provinces and territories. The rates were highest in Newfoundland and lowest in the Northwest Territories (Table 2).

Download the alternative format
(PDF format, 352 KB, 3 pages)
| Type of hypertension | 2004/2005 | 2005/2006 | 2006/2007 | 2007/2008 | 2008/2009 | 2009/2010 | 2010/2011 |
|---|---|---|---|---|---|---|---|
| Pre-existing hypertension | 4.6 | 4.8 | 5.1 | 5.2 | 4.9 | 5.1 | 5.1 |
| Gestational hypertension without proteinuria | 45.0 | 45.4 | 44.9 | 44.5 | 45.5 | 46.3 | 46.2 |
| Pre-eclampsia | 11.9 | 12.1 | 12.1 | 12.3 | 12.0 | 12.4 | 11.5 |
| Eclampsia | 1.5 | 1.3 | 0.9 | 0.7 | 0.8 | 0.8 | 0.8 |
Source: Canadian Institute for Health Information, Discharge Abstract Database (DAD). Quebec data was not included because it does not contribute to DAD
Figure 1: Rates (per 1,000 deliveries) of hypertension among pregnant women in Canada, 2004/05–2010/11
Source: Canadian Institute for Health Information, Discharge Abstract Database (DAD). Quebec data was not included because it does not contribute to DAD
Figure 2: Rate (per 1,000 deliveries) of gestational hypertension (without proteinuria) by age group in Canada, 2004/05–2010/11
Source: Canadian Institute for Health Information, Discharge Abstract Database (DAD). Quebec data was not included because it does not contribute to DAD
Description - Figure 2
| Age group | 2004/05 | 2005/06 | 2006/07 | 2007/08 | 2008/09 | 2009/10 | 2010/11 |
|---|---|---|---|---|---|---|---|
| 15-19 years | 41.49 | 38.72 | 43.21 | 40.53 | 38.65 | 39.78 | 42.51 |
| 20-24 years | 42.69 | 44.46 | 42.42 | 40.30 | 43.93 | 42.20 | 41.56 |
| 25-29 years | 45.70 | 46.36 | 45.19 | 45.73 | 44.83 | 46.28 | 44.98 |
| 30-34 years | 43.35 | 43.12 | 43.51 | 42.66 | 44.45 | 44.79 | 44.77 |
| 35-39 years | 47.41 | 48.71 | 47.36 | 47.26 | 49.13 | 50.76 | 52.54 |
| 40-44 years | 61.54 | 59.20 | 57.88 | 63.93 | 59.73 | 65.64 | 64.54 |
| 45-49 years | 75.41 | 74.19 | 76.70 | 100.00 | 86.33 | 106.47 | 92.72 |
| Province/Territory | Rate per 1,000 deliveries | 95% CI |
|---|---|---|
| Newfoundland and Labrador | 68.8 | 66.0–71.7 |
| Prince Edward Island | 59.3 | 54.5–64.4 |
| Nova Scotia | 60.5 | 58.6–62.5 |
| New Brunswick | 47.4 | 45.5–49.3 |
| Ontario | 42.1 | 41.7–42.5 |
| Manitoba | 54.1 | 52.7–55.5 |
| Saskatchewan | 48.0 | 46.6–49.5 |
| Alberta | 50.7 | 49.9–51.4 |
| British Columbia | 40.3 | 39.6–41.1 |
| Yukon | 40.8 | 33.2–49.7 |
| Northwest Territories | 32.9 | 28.3–38.0 |
| Nunavut | 54.9 | 46.3–64.6 |
| Canada | 45.4 | 45.1–45.7 |
Source: Canadian Institute for Health Information, Discharge Abstract Database (DAD). Quebec data was not included because it does not contribute to DAD
CI: confidence interval
Definition
Hypertension in pregnancy is defined as a diastolic BP of ≥90 mmHg and is classified as pre-existing or gestational. Pre-existing hypertension pre-dates pregnancy or appears before 20 weeks, and gestational hypertension appears at or after 20 weeks. Pre-eclampsia is characterized by high blood pressure and significant amounts of protein in the urine in a pregnant woman (≥0.3g/d in a 24-hour urine collection or ≥30 mg/mmol urinary creatinine in a spot urine sample). Eclampsia is characterized as seizures (convulsions) in a pregnant woman that are not related to a pre-existing brain condition. Rates are expressed per 1,000 deliveries in a given place and time.
Data source
Rates of maternal hypertension were calculated using data from the Discharge Abstract Database (DAD) of the Canadian Institute for Health Information for the period 2004/10–2010/11. This database contains information on all hospital discharges in Canada (except Quebec). Diagnoses and procedures in the database are coded using the International Statistical Classification of Diseases, Tenth Revision (ICD-10CA).
The rates are calculated based on fiscal years (i.e., April 1 to March 31).
Limitations
Our data may underestimate the actual rates of maternal hypertension in Canada, as all maternal hypertension could not be identified due to limitations of the ICD-10CA codes (i.e. miscoding, unspecified hypertension). Maternal hypertension rates in Quebec could not be estimated because this province’s data were not part of the Discharge Abstract Database (DAD). Case ascertainment was limited to the province/territory of occurrence; therefore the data may therefore not accurately reflect the regional differences in Canada.