Chapter 9: The Health of Canada's Young People: a mental health focus – Healthy weights
Healthy weights
by Ian Janssen
What is a healthy weight?
The main focus of this chapter is on healthy weights, excess body weight, and obesity. A healthy weight is a weight that is appropriate for a person's height and promotes good health and well‑being. Simply defined, the terms overweight and obesity represent a state where an individual has excess body weight and fat to the extent that it affects his or her health in a negative way (World Health Organization, 1998).
Obesity is a more severe form of excess weight and fat than being overweight. Being overweight or obese results from a long-term imbalance, in which the number calories (energy) consumed in the diet exceeds the amount of energy that the body expends in physical activity. Over time, limited levels of physical activity, too much time spent in sedentary behaviours such as watching television and surfing the web, and/or overconsumption of foods, particularly those that are high in sugars and fats, can lead to excessive weight and obesity (World Health Organization, 1998). This chapter looks at indicators of body weight, weight loss, and body image.
Body image
Dangerous and unrealistic cultural ideals of slimness (particularly in females) and muscularity (particularly in males) have filtered down to the child and adolescent population. Young people often feel dissatisfied with their body weight and size (Abbott, Lee et al. 2010; Duncan, Duncan et al. 2011). In many situations body image issues are reported by young people with a healthy weight (Abbott, Lee et al. 2010; Duncan, Duncan et al., 2011).
Why do body weight and body image matter?
Excess weight and obesity among young people are leading public health issues in Canada. Weight issues are associated with several health problems in children and youth. These problems include elevated risk factors for heart disease and diabetes (e.g., increased blood cholesterol, blood pressure, and blood sugar levels), problems with the bones and joints, and poor mental health (Reilly, Methven et al. 2003). Furthermore, excess weight and obesity in adolescence tend to carry on into adulthood (Singh, Mulder et al., 2008). Thus, most obese young people will continue to struggle with weight-related issues when they are adults.
Having a poor body image is highly related to low self-esteem and, in some situations, can lead to eating disorders, such as bulimia or anorexia (Westerberg-Jacobson, Edlund et al. 2010). Although properly monitored and regulated weight-control practices may be appropriate for obese young people (Plourde 2006), extreme weight control and weight loss practices may negatively affect a young person's physical and mental health (Lock, Reisel et al., 2001).
What are we reporting in this chapter?
In this chapter, we report on the proportion of students with a healthy weight and the proportion that are overweight or obese. We asked students to report their height and weight. These values were used to calculate their body mass index (BMI). BMI is calculated as an individual's body weight divided by the square of the individual's height. The standard international unit is kg/m2. International age- and gender-specific BMI standards for children and youth were used to classify the students as being a healthy weight, overweight, or obese (Cole, Bellizzi et al. 2000). It is important to recognize that BMI values derived from self-reported height and weights, such as in the HBSC study, are lower than the BMI values that are derived from physical measurements of height and weight obtained using a scale and tape measure (Elgar & Stewart, 2008). Consequently, estimates of excess weight and obesity from self-reported heights and weights yield lower rates of being overweight and obesity than estimates that are based on physical measurements (Elgar & Stewart, 2008).
We also describe the body image perceptions and weight-loss practices of Canadian youth. We asked students if they felt their body was much too thin, a bit too thin, about the right size, a bit too fat, or much too fat. And we asked if they were currently dieting or doing something else (e.g., exercising) in an attempt to lose weight.
Possible effects of being overweight or obese on mental health
The physical health effects of being overweight or obese for people of all ages have been well studied and are well appreciated. A linkage has also been made between body weight and mental health. Overweight and obese people face numerous social prejudices and biases, and this can take a toll on their mental health (Puhl & Latner 2007). Dissatisfaction with one's body (e.g., thinking you are too thin or too fat) can also have a negative impact on mental health.
Healthy weights, overweight, and obesity
Proportions of young Canadians who are a healthy weight, overweight or obese
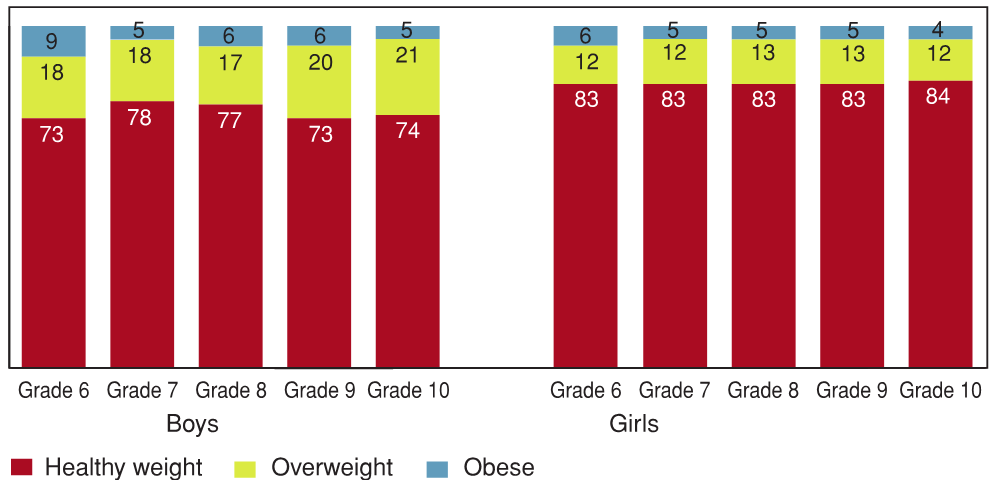
9.1 Students who are a healthy weight, overweight, or obese, by grade and gender (%)
[Text Equivalent, Figure 9.1]
9.1 Students who are a healthy weight, overweight, or obese, by grade and gender (%)
Figure 9.1 shows the percentage of students who are a healthy weight, overweight, or obese, by grade and gender. The graph shows that 73% of Grade 6 boys are a healthy weight, compared to 78% of Grade 7 boys, 77% of Grade 8 boys, 73% of Grade 9 boys, and 74% of Grade 10 boys. 18% of Grade 6 boys are overweight, compared to 18% of Grade 7 boys, 17% of Grade 8 boys, 20% of Grade 9 boys, and 21% of Grade 10 boys. 9% of Grade 6 boys are obese, compared to 5% of Grade 7 boys, 6% of Grade 8 boys, 6% of Grade 9 boys, and 5% of Grade 10 boys. On the same question, 83% of Grade 6 girls are a healthy weight, compared to 83% of Grade 7 girls, 83% of Grade 8 girls, 83% of Grade 9 girls, and 84% of Grade 10 girls. 12% of Grade 6 girls are overweight, compared to 12% of Grade 7 girls, 13% of Grade 8 girls, 13% of Grade 9 girls, and 12% of Grade 10 girls. 6% of Grade 6 girls are obese, compared to 5% of Grade 7 girls, 5% of Grade 8 girls, 5% of Grade 9 girls, and 4% of Grade 10 girls.
Figure 9.1 illustrates the proportion of young people that are a healthy weight and the proportion that are overweight or obese. Twelve to 21% of students are overweight and 4 to 9% are obese, with the proportions reporting excess weight being higher in boys than in girls. In total, approximately one in four boys is either overweight or obese and approximately one in six girls is either overweight or obese.
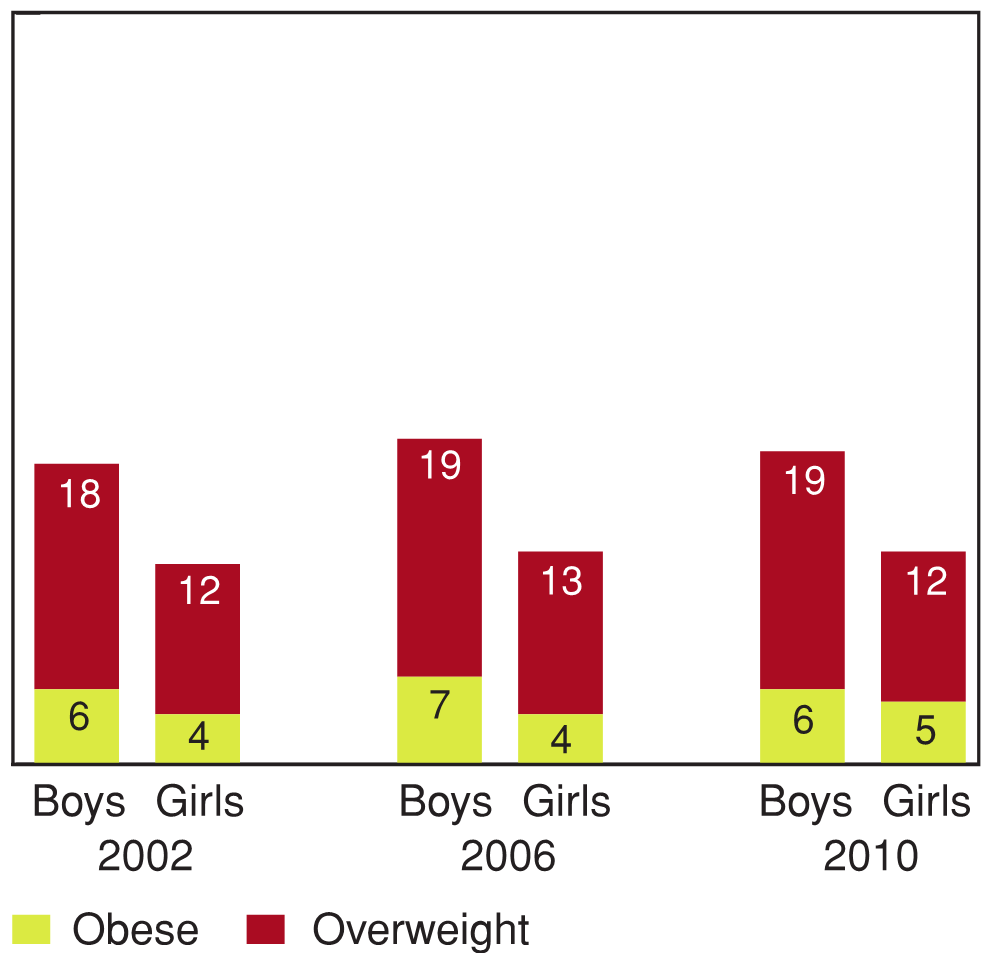
9.2 Students classified as overweight and obese, by gender and year of survey (%)
[Text Equivalent, Figure 9.2]
9.2 Students classified as overweight and obese, by gender and year of survey (%)
Figure 9.2 shows the percentage of students classified as overweight and obese, by gender and year of survey. The graph shows that 6% of boys in 2002 were obese, compared to 7% in 2006 and 6% in 2010. 18% of boys were overweight in 2002, compared to 19% in 2006, and 19% in 2010. On the same question, 4% of girls were obese in 2002, compared to 4% of girls in 2006, and 5% of girls in 2010. 12% of girls were overweight in 2002, compared to 13% of girls in 2006, and 12% of girls in 2010.
The prevalence of overweight and obese young people, based on self-reported measures of height and weight, was relatively stable between 2002 and 2010 (Figure 9.2). This was the case for both boys and girls. In 2002, 24% of boys and 16% of boys were overweight or obese. In 2010, 25% of boys and 17% of girls were overweight or obese.
Body image and weight-loss practices of Canadian students
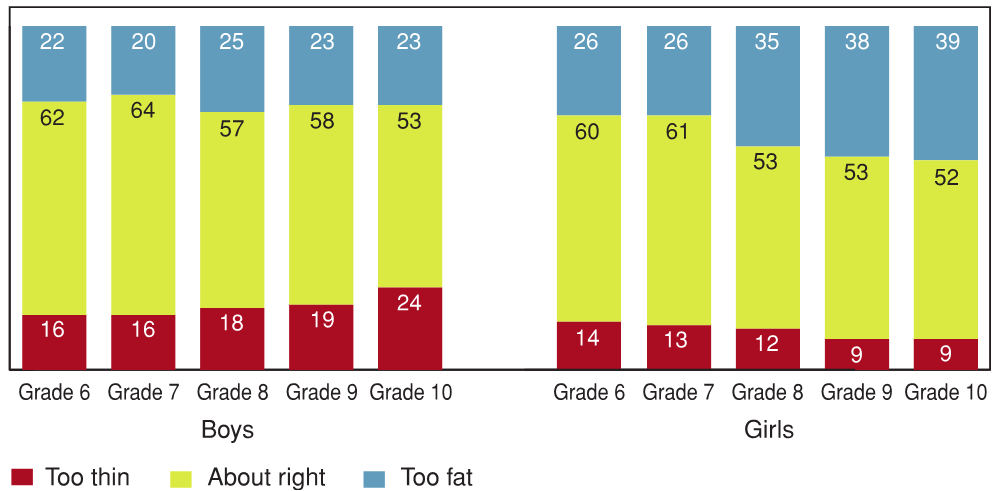
9.3 Students who think their body is too thin, about the right size, or too fat, by grade and gender (%)
[Text Equivalent, Figure 9.3]
9.3 Students who think their body is too thin, about the right size, or too fat, by grade and gender (%)
Figure 9.3 shows the percentage of students who think their body is too thin, about right, or too fat, by grade and gender. The graph shows that 16% of Grade 6 boys think their body is too thin, compared to 16% of Grade 7 boys, 18% of Grade 8 boys, 19% of Grade 9 boys, and 24% of Grade 10 boys. 62% of boys think their body is about right, compared to 64% of Grade 7 boys, 57% of Grade 8 boys, 58% of Grade 9 boys, and 53% of Grade 10 boys. 22% of Grade 6 boys think their body is too fat, compared to 20% of Grade 7 boys, 25% of Grade 8 boys, 23% of Grade 9 boys, and 23% of Grade 10 boys. On the same question, 14% of Grade 6 girls think their body is too thin, compared to 13% of Grade 7 girls, 12% of Grade 8 girls, 9% of Grade 9 girls, and 9% of Grade 10 girls. 60% of Grade 6 girls think their body is about right, compared to 61% of Grade 7 girls, 53% of Grade 8 girls, 53% of Grade 9 girls, and 52% of Grade 10 girls. 26% of Grade 6 girls think their body is too fat, compared to 26% of Grade 7 girls, 35% of Grade 8 girls, 38% of Grade 9 girls, and 39% of Grade 10 girls.
According to the 2010 HBSC findings, 16 to 24% of boys and 9 to 14% of girls believed that their body was too thin (Figure 9.3). Within boys these rates increased by 8 percentage points from Grade 6 to 10, but for girls the rates decreased by 5 percentage points from Grade 6 to Grade 10. More girls than boys believed that their body was too fat. Rates with advancing grades remained relatively stable in boys (within 5 percentage points) but increased sharply in girls (rising 13 percentage points from 26% in Grade 6 to 39% in Grade 10). The percentage of girls who believed their body was too fat (Figure 9.3) was far greater than the percentage of girls who are actually overweight or obese (Figure 9.1).
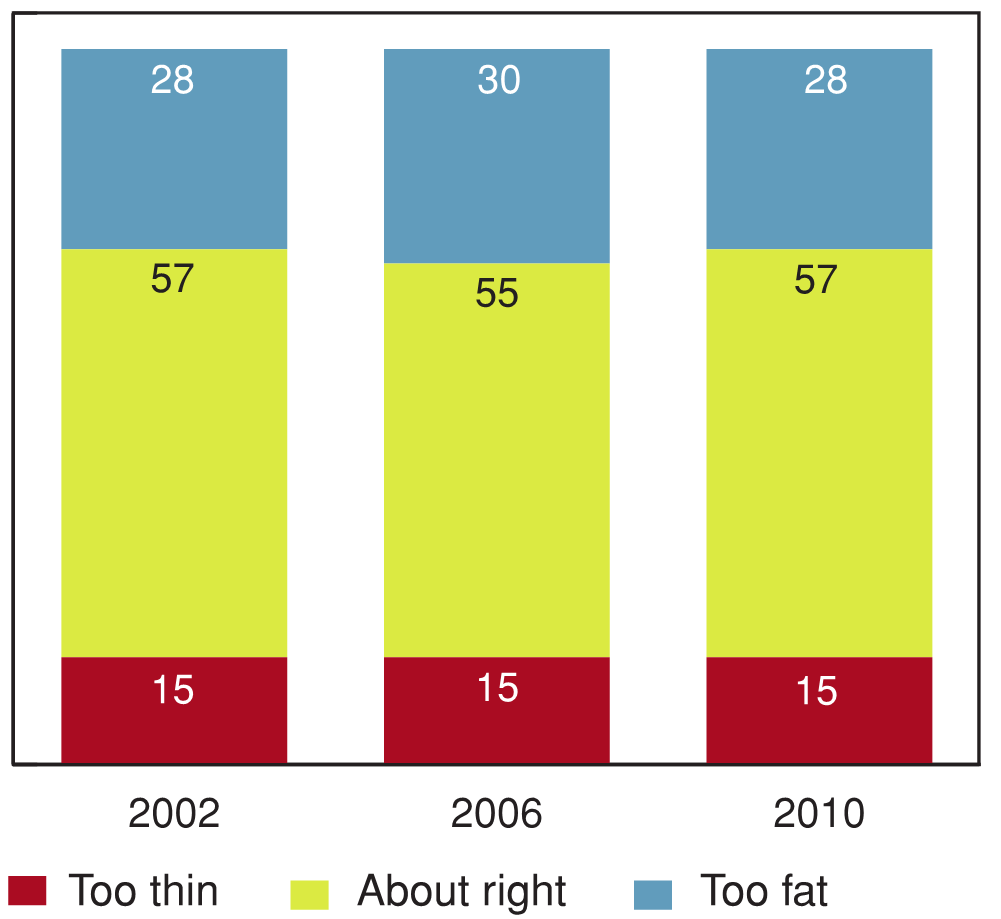
9.4 Students who think their body is too thin, about the right size, or too fat, 2002, 2006 and 2010 (%)
[Text Equivalent, Figure 9.4]
9.4 Students who think their body is too thin, about the right size, or too fat, 2002, 2006 and 2010 (%)
Figure 9.4 shows the percentage of students who think their body is too thin, about right, or too fat, by year of survey. The graph shows that 15% of students thought their body was too thin in 2002, compared to 15% in 2006, and 15% in 2010. 57% of students thought their body was about right in 2002, compared to 55% of students in 2006, and 57% of students in 2010. 28% of students thought their body was too fat in 2002, compared to 30% of students in 2006, and 28% of students in 2010.
Young people's body image perceptions have not changed very much from 2002 to 2010 (Figure 9.4). In fact, the percentage of students who thought that their body was too thin, about right, and too fat was almost identical in the 2002, 2006, and 2010 HBSC cycles. This observation is consistent with the observation that the percentage of students who were overweight or obese has remained stable since 2002 (Figure 9.2).
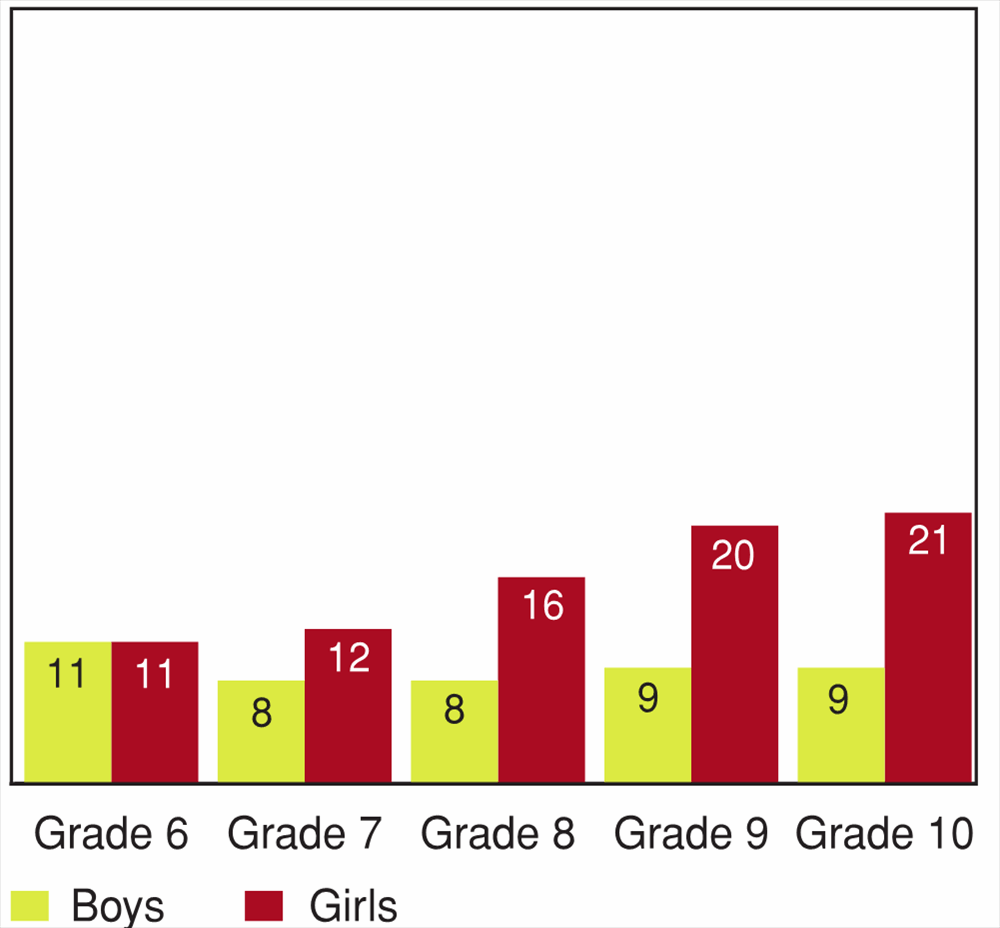
9.5 Students who report doing something to lose weight, by grade and gender (%)
[Text Equivalent, Figure 9.5]
9.5 Students who report doing something to lose weight, by grade and gender (%)
Figure 9.5 shows the percentage of students who report doing something to lose weight, by grade and gender. The graph shows that 11% of Grade 6 boys report doing something to lose weight, compared to 8% of Grade 7 boys, 8% of Grade 8 boys, 9% of Grade 9 boys, and 9% of Grade 10 boys. On the same question, 11% of Grade 6 girls report doing something to lose weight, compared to 12% of Grade 7 girls, 16% of Grade 8 girls, 20% of Grade 9 girls, and 21% of Grade 10 girls.
At every grade level except for Grade 6, more girls than boys were doing something to lose weight (Figure 9.5). The percentage of students trying to lose weight remained stable (within 3 percentage points) between Grade 6 and Grade 10 in boys, but increased by 10 percentage points in girls.
9.6 Students who report doing something to lose weight, in 2002, 2006 and 2010 (%)

[Text Equivalent, Figure 9.6]
9.6 Students who report doing something to lose weight, in 2002, 2006 and 2010 (%)
Figure 9.6 shows the percentage of students who report doing something to lose weight, by gender and year of survey. The graph shows that 9% of boys reported doing something to lose weight in 2002, compared to 10% of boys in 2006, and 9% of boys in 2010. On the same question, 20% of girls reported doing something to lose weight in 2002, compared to 20% of girls in 2006, and 16% of girls in 2010.
As illustrated in Figure 9.6, the proportion of Grade 6 to 10 boys trying to lose weight remained relatively stable (within 1%) from 2002 to 2010. There was a slight decrease in the proportion of Grade 6 to 10 girls who were trying to lose weight. This decreased from a high of 20% in 2002 to a low of 16% in 2010. In all 3 HBSC cycle years, the proportion of students trying to lose weight (9% to 20%, Figure 9.6) was noticeably lower than the proportion of students who thought their body was too fat (28% to 30%, Figure 9.4).
Relations between healthy weight, body image, and weight loss practices
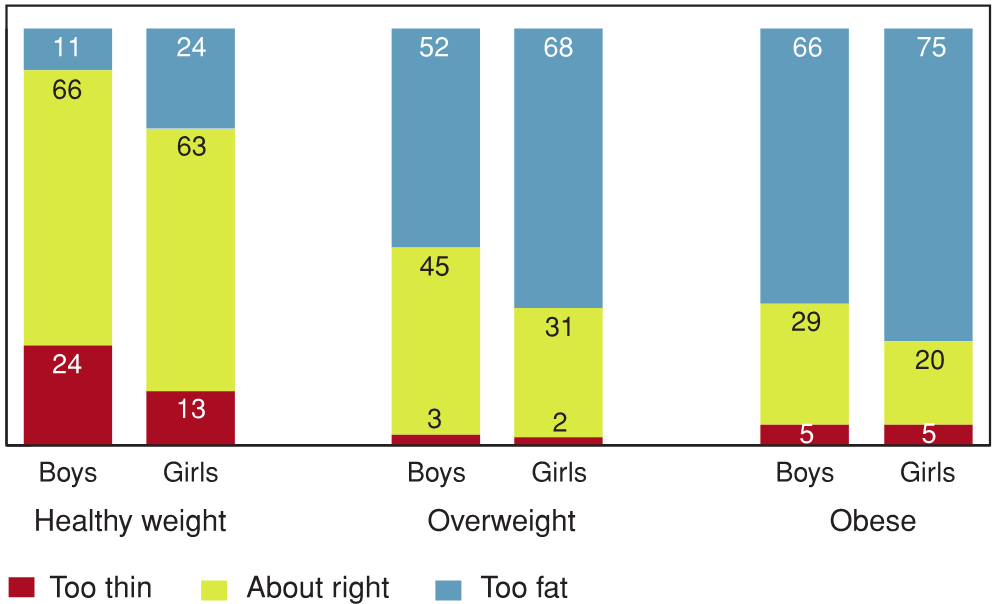
9.7 Students who think their body is too thin, about the right size, or too fat, by BMI category, by gender (%)
[Text Equivalent, Figure 9.7]
9.7 Students who think their body is too thin, about the right size, or too fat, by BMI category, by gender (%)
Figure 9.7 shows the percentage of students who report doing something to lose weight by BMI category and whether they believe they are too thin, about right, or too fat, by gender. The graph shows that among boys who believe they are too thin, 24% of boys with a healthy weight report doing something to lose weight, compared to 3% of boys who are overweight, and 5% of boys who are obese. Among boys who believe their body is about right, 66% of boys who are a healthy weight report doing something to lose weight, compared to 45% of boys who are overweight, and 29% of boys who are obese. Among boys who believe their body is too fat, 11% of boys who are a healthy weight report doing something to lose weight, compared to 52% of boys who are overweight, and 66% of boys who are obese. On the same question, among girls who believe they are too thin, 13% of girls who are a healthy weight report doing something to lose weight, compared to 2% of girls who are overweight, and 5% of girls who are obese. Among girls who believe that their body is about right, 63% of girls who are a healthy weight report doing something to lose weight, compared to 31% of girls who are overweight, and 20% of girls who are obese. Among girls who believe that their body is too fat, 24% of girls who are a healthy weight report doing something to lose weight, compared to 68% of girls who are overweight, and 75% of girls who are obese.
Within both boys and girls, there was a strong relation between body weight (BMI) and body image (Figure 9.7) such that more overweight (52% of boys, 68% of girls) and obese (66% of boys, 75% of girls) students felt that their body was too fat by comparison to students with a healthy weight (11% of boys, 24% of girls). It is a cause for concern, however, that only two-thirds (66% of boys, 63% of girls) of young people with a healthy weight felt that their body was about the right size. In all BMI categories, more girls than boys thought their body was too fat. In the healthy weight BMI category, fewer girls than boys thought their body was too thin.
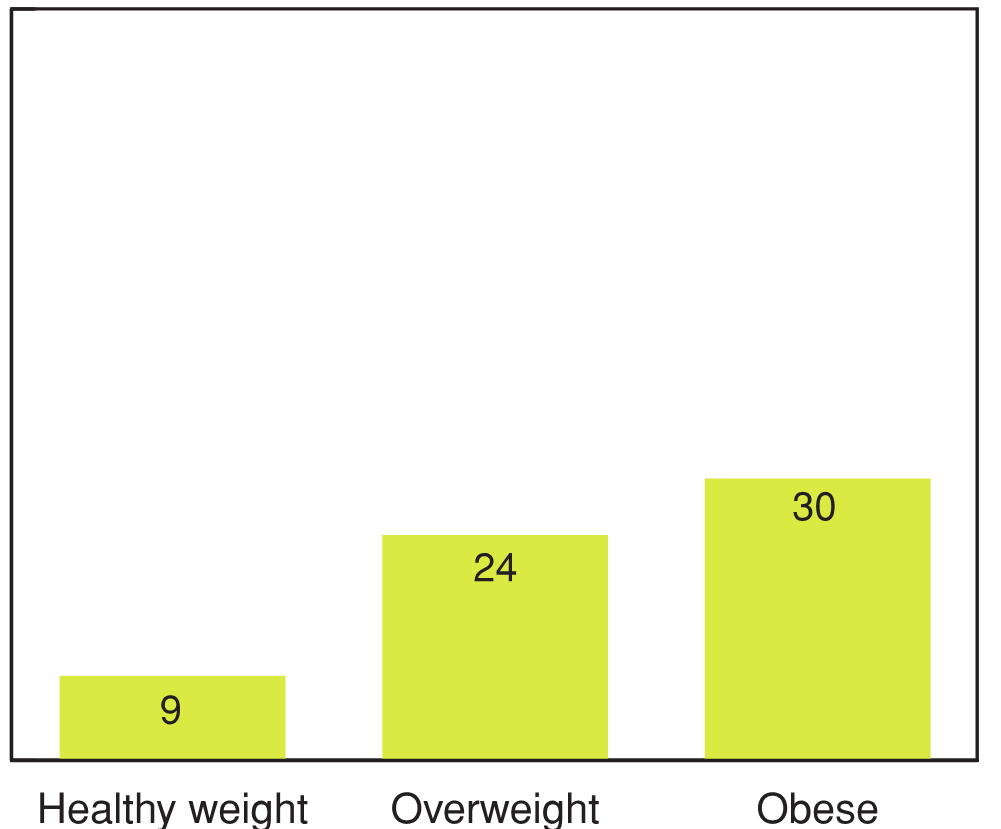
9.8 Students who report doing something to lose weight, by BMI category (%)
[Text Equivalent, Figure 9.8]
9.8 Students who report doing something to lose weight, by BMI category (%)
Figure 9.8 shows the percentage of students who report doing something to lose weight, by BMI category. The graph shows that 9% of students who are a healthy weight report doing something to lose weight, compared to 24% of students who are overweight, and 30% of students who are obese.
There was a strong relation between weight-loss practices and body weight (BMI), such that 30% and 24% of obese and overweight students, respectively, were trying to lose weight, compared to 9% of those with a healthy weight (Figure 9.8).
Relations between healthy weight and mental health
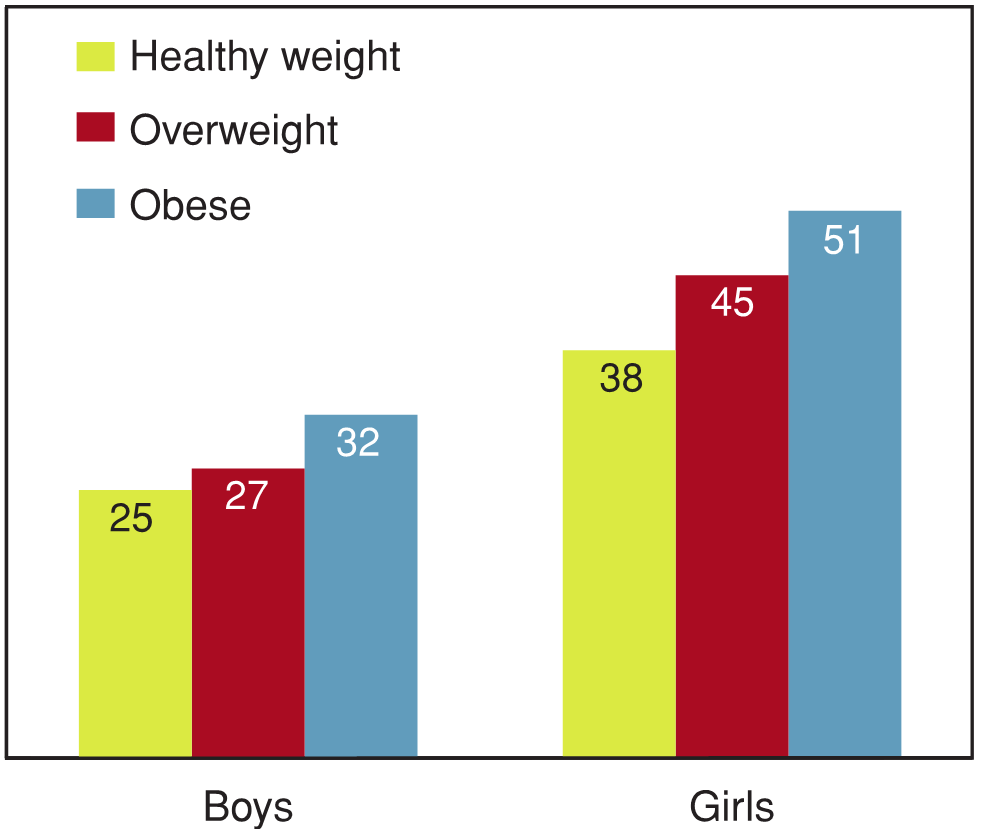
9.9 Students reporting high levels of emotional problems by BMI category, by gender (%) Footnote 1
[Text Equivalent, Figure 9.9]
9.9 Students reporting high levels of emotional problems by BMI category, by gender (%) *
Figure 9.9 shows the percentage of students reporting high levels of emotional problems by BMI category, by gender. The graph shows that 25% of boys who are a healthy weight report high levels of emotional problems, compared to 27% of boys who are overweight, and 32% of boys who are obese. On the same question, 38% of girls who are overweight report high levels of emotional problems, compared to 45% of girls who are overweight and 51% of girls who are obese.
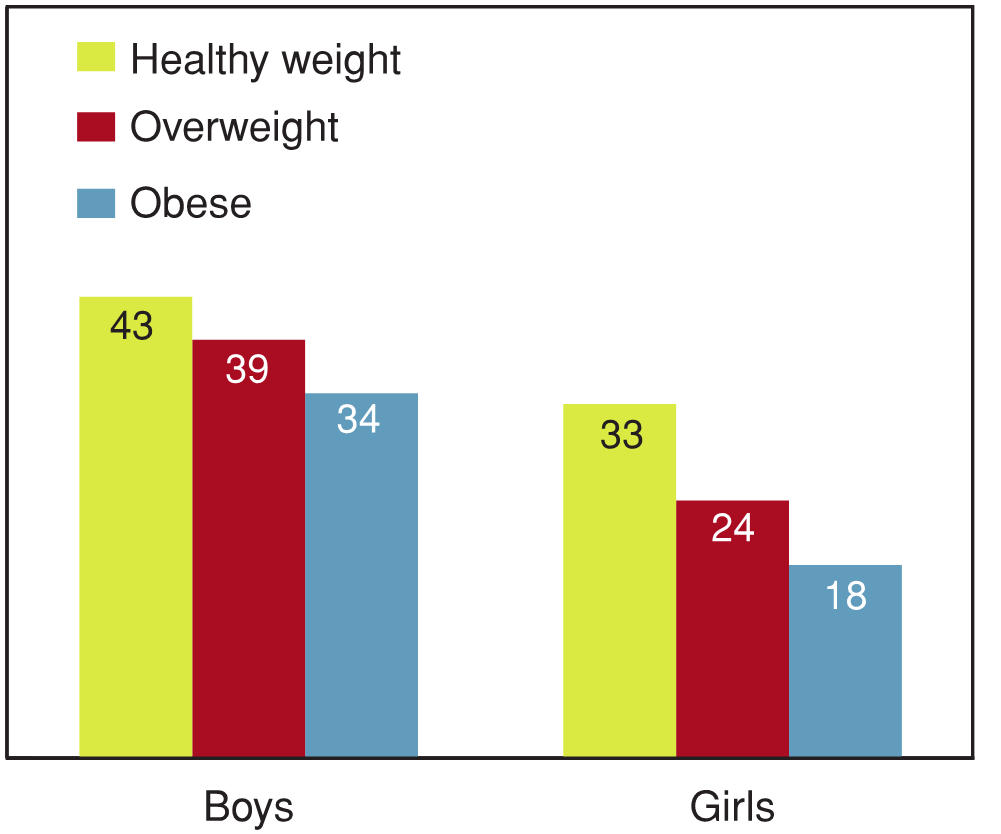
[Text Equivalent, Figure 9.10]
9.10 Students reporting high levels of emotional well‑being by BMI category, by gender (%)
Figure 9.10 shows the percentage of students reporting high levels of emotional well‑being by BMI category, by gender. The graph shows that 43% of boys who are a healthy weight report high levels of emotional well‑being, compared to 39% of boys who are overweight, and 34% of boys who are obese. On the same question, 33% of girls who are a healthy weight report high levels of emotional well‑being, compared to 24% of girls who are overweight, and 18% of girls who are obese.
BMI is related to emotional problems and emotional well‑being. Overweight and obese students were more likely to have high emotional problem scores than students with a healthy weight (Figure 9.9). Conversely, overweight and obese students were less likely to have high emotional well‑being scores than students with a healthy weight (Figure 9.10). The relationships between BMI, emotional problems, and emotional well‑being were stronger in girls than in boys.
Friends don't accept girls when they are overweight and guys aren't interested in them. Both hurt.
—Youth, Healthy Advice Workshop
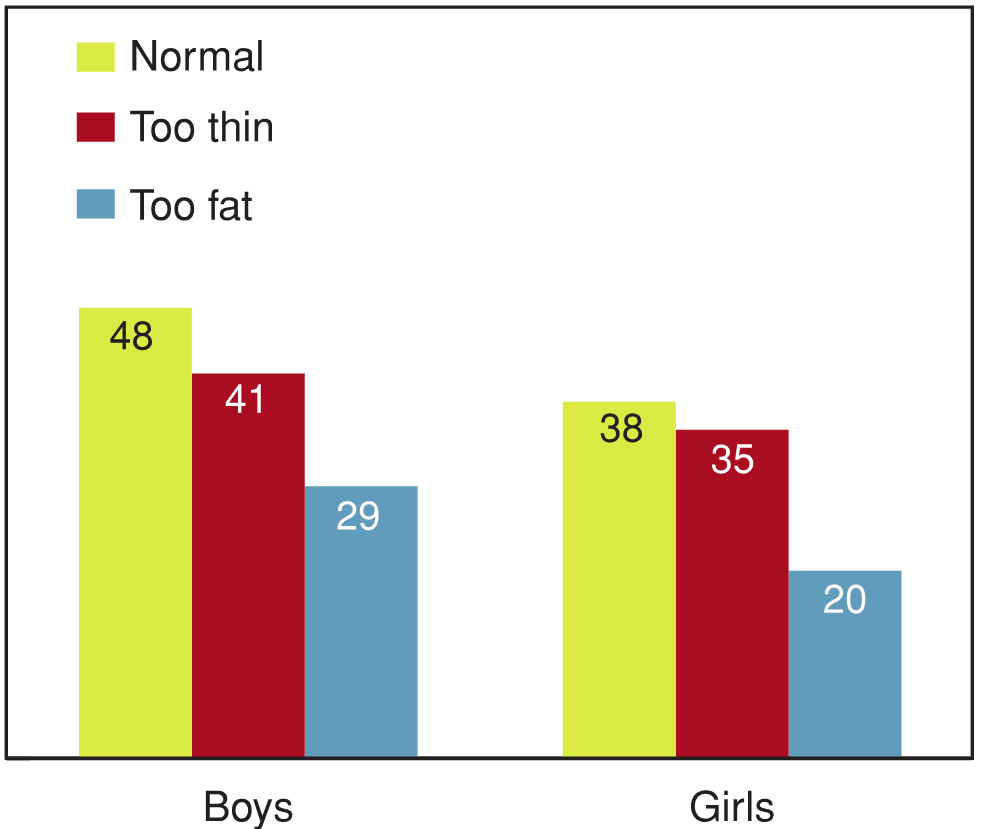
[Text Equivalent, Figure 9.11]
9.11 Students reporting high levels of emotional well‑being by body image perception, by gender (%)
Figure 9.11 shows the percentage of students reporting high levels of emotional well‑being by body image perception, by gender. The graph shows that 48% of boys who believe their body is normal report high levels of emotional well‑being, compared to 41% of boys who believe their body is too thin, and 29% of boys who believe their body is too fat. On the same question, 38% of girls who believe their body is normal report high levels of emotional well‑being, compared to 35% of girls who believe their body is too thin, and 20% of girls who believe their body is too fat.
As with BMI, body image perception and weight loss practices were also related to emotional well‑being (Figure 9.11). A smaller proportion of boys who thought their body was too fat (29%) or too thin (41%) had high emotional well‑being scores in comparison to boys who thought their body weight was normal (48%). Similarly a smaller proportion of girls who thought their body was too fat (20%) had high emotional well‑being scores in comparison to girls who thought their body was too thin (35%) or normal (38%).
9.12 Students reporting high levels of emotional well‑being by doing something to lose weight, by gender (%)
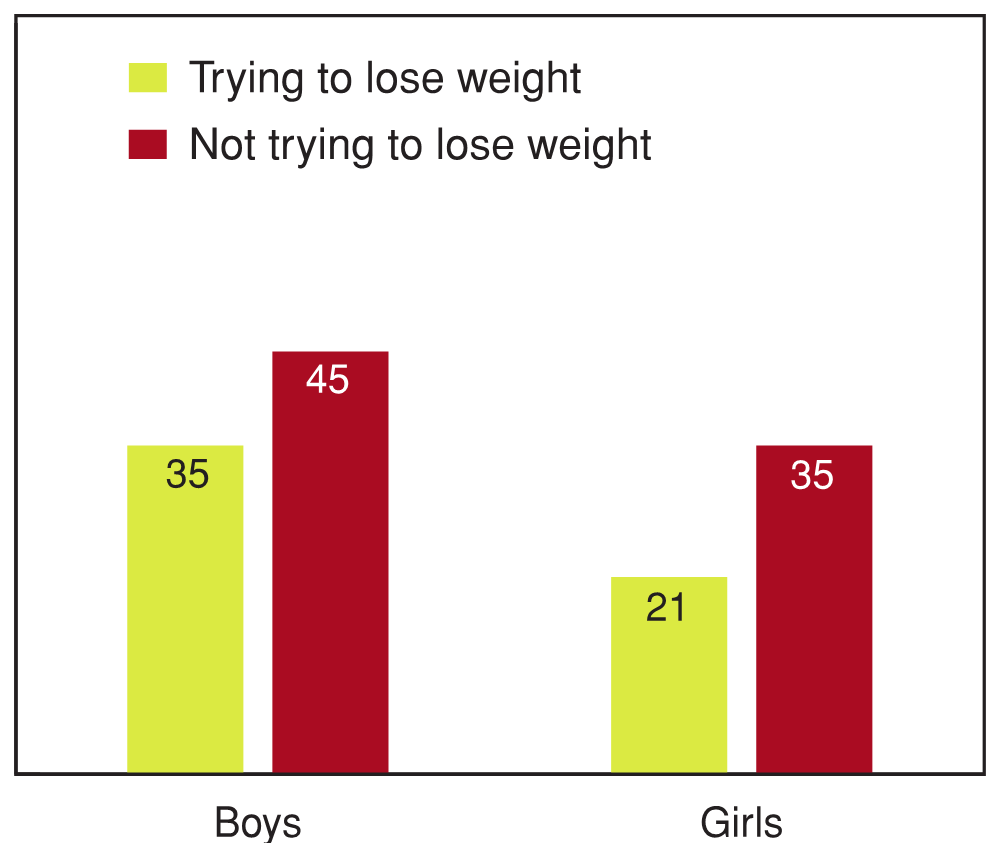
[Text Equivalent, Figure 9.12]
9.12 Students reporting high levels of emotional well‑being by doing something to lose weight, by gender (%)
Figure 9.12 shows the percentage of students reporting high levels of emotional well‑being by whether they are doing something to lose weight, by gender. The graph shows that 35% of boys who are trying to lose weight report high levels of emotional well‑being, compared to 45% of boys who are not trying to lose weight. On the same question, 21% of girls who are trying to lose weight report high levels of emotional well‑being, compared to 35% of girls who are not trying to lose weight.
Weight loss practices were also related to emotional well‑being scores, irrespective of gender (Figure 9.12), such that students who were trying to lose weight had poorer scores than students who were not trying to lose weight. Within boys, there was a 10% point difference between those who were trying to lose weight versus those who were not. Within girls, there was a 14% point difference between those who were trying to lose weight versus those who were not.
Guys see each other as being muscular when they're overweight, while girls see each other as being big when they're overweight.
—Youth, Healthy Advice Workshop
What young people thought about these findings
A diverse group of Canadian youth participated in a workshop where the key findings of the 2010 HBSC Study were presented and discussed. One of the goals of this workshop was to gain young peoples' perspectives on the relations that were observed between BMI and the mental health variables.
The youth participating in the workshop appreciated that being overweight or obese relates to mental health in young people. They felt that these relations were particularly salient for young girls. The participants also recognized that the relationship between excess weight and mental health can be caused by many factors. One of the factors that they felt was very important was the image the media portrays of how people should look. Another of the factors that became apparent in the group discussions was the perception among some of the young people that it was the person's own fault if they were overweight or obese. For example, the belief that all obese people are too lazy to exercise and cannot control what they eat was expressed. Not all of the young people at the workshop appreciated that a person's body weight is impacted by several factors that are beyond his or her own control, such as their genetics, family wealth (e.g., healthy foods are often more expensive), and the structure and characteristics of different neighbourhoods. (e.g., availability of safe parks to use for physical activity).
Summary and implications
Key issues of concern
- Approximately one in four boys is either overweight or obese and approximately one in six girls is either overweight or obese as determined from self-reported heights and weights.
- Only two-thirds of young people with a healthy weight feel that their body is about the right size.
- Overweight and obese young people, particularly young girls, are more likely to have mental health problems than young people with a healthy weight.
Key issues to celebrate
- The prevalence of obesity did not increase between the 2006 and 2010 HBSC Studies, suggesting that the increase in obesity observed over the past three decades may be peaking.
- A significant proportion of overweight (24%) and obese (30%) youth report that they are doing something to lose weight.
Commentary
Excess weight and obesity are leading public health issues in Canadian youth. Despite the awareness of the obesity epidemic and the significant investments that have been made in recent years into healthy weights initiatives and programs, the proportion of Canadian youth who are overweight or obese remains high. In fact, there has been no change in the proportion of Canadian youth who are obese since the 2006 HBSC cycle, suggesting that rates of obesity may have peaked.
The fact that there are still so many overweight and obese Canadian young people is of concern because these conditions have many immediate and long term health, social, and economic implications. Among these implications is the impact that being overweight or obese has on mental health, particularly for girls. For instance, findings in this chapter indicate that obese girls are only half as likely to have high levels of emotional well‑being by comparison to girls with a healthy weight.
In summary, the proportion of Canadian youth who are overweight or obese remains high. Increased efforts and investments are needed at all levels (e.g., local, provincial, national) and by all sectors (e.g., government, industry, research) to address this important public health issue.
References
- Abbott, R.A., Lee, A.J., Stubbs, C.O. & Davies, P.S. (2010). Accuracy of weight status perception in contemporary Australian children and adolescents. Journal of Paediatrics and Child Health, 46:343-348.
- Cole, T.J., Bellizzi, M.C., Flegal, K.M. & Dietz, W.H. (2000). Establishing a standard definition for child overweight and obesity worldwide: international survey. BMJ, 320:1240–1243.
- Duncan, J.S., Duncan, E.K. & Schofield, G. (2011). Associations between weight perceptions, weight control and body fatness in a multiethnic sample of adolescent girls. Public Health Nutrition, 14:93-100.
- Elgar, F.J., & Stewart, J.M. (2008). Validity of screening for overweight and obesity using self-report data: evidence from the Canadian Community Health Survey. Canadian Public Health Journal, 361:423-427.
- Lock, J., Reisel, B. & Steiner, H. (2001). Associated health risks of adolescents with disordered eating: how different are they from their peers? Results from a high school survey. Child Psychiatry & Human Development, 31:249-265.
- Plourde, G. (2006). Preventing and managing pediatric obesity. Recommendations for family physicians.
Canadian Family Physician, 52:322-328. - Puhl, R.M. & Latner, J.D. (2007). Stigma, obesity, and the health of the nation's children. Psychological Bulletin, 133:557-580.
- Reilly, J.J., Methven, E., McDowell, Z.C., Hacking, B., Alexander, D., Stewart, L., & Kelnar, C. J.H. (2003). Health consequences of obesity. Archives of Disease in Childhood, 88:748-752.
- Singh, A.S., Mulder, C., Twisk, J.W., van Mechelen, W. & Chinapaw, M.J. (2008). Tracking of childhood overweight into adulthood: a systematic review of the literature. Obesity Reviews, 9:474-488.
- Westerberg-Jacobson, J., Edlund, B. & Ghaderi, A. (2010). A 5-year longitudinal study of the relationship between the wish to be thinner, lifestyle behaviours and disturbed eating in 9-20-year old girls. European Eating Disorders Review, 18:207-219.
- World Health Organization (1998). Obesity: Preventing and Managing the Global Epidemic. Geneva, Report of a WHO Consultation on Obesity.