
Healthy settings for young people in Canada – Emotional well-being of Canada’s young people
Emotional Well-Being of Canada’s Young People
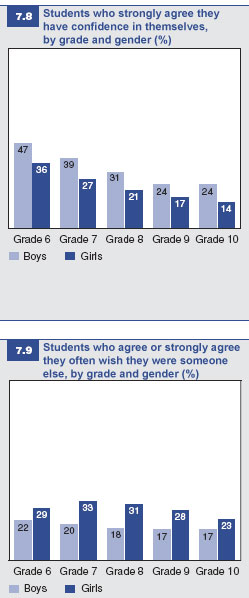
As shown in Figure 7.8, students’ selfconfidence is influenced by both grade and gender. Forty-seven percent of boys in Grade 6 strongly agree that they have confidence in themselves, but this level drops in each advancing grade to arrive at just 24% in Grades 9 and 10. The proportion of girls with self-confidence starts off lower than that of boys in Grade 6 at 36% and declines in a similar fashion to justs 14% in Grade 10. The biggest drop in selfconfidence for boys occurs between Grades 6 and 7 and again between Grades 7 and 8; for girls, the largest drop is between Grades 6 and 7. The gender gap is largest in Grade 7 (12%) and smallest in Grade 9 (7%).
As illustrated in Figure 7.9, across grades, more girls than boys consistently agree or strongly agree that they often wish they were someone else. In general, there is a slight decline in students wishing they were someone else across the grade levels with the highest rates for boys being in Grade 6 (22%) and for girls in Grade 7 (33%). The gender gap is smallest in Grade 10 at 6% and largest in Grades 7 and 8 at 13%.
Figure 7.10 shows responses to the question about feeling helpless. The pattern of students’ responses for agreeing or strongly agreeing that they feel helpless is similar to that found for psychosomatic symptoms. Boys and girls respond to this question similarly in Grade 6. An increase in girls’ reports of helplessness occurs between Grades 6 and 7, whereas the proportion of boys reporting helplessness decreases slightly through Grades 6 to 10, reducing from 15% to 12%. Thus, the gender gap increases from Grade 6 to Grade 10 by 8%.


As seen in Figure 7.11, 90% of both boys and girls in Grade 6 say their general health is good or excellent. This figure drops 4% (to 86%) for boys in Grade 7, but remains relatively constant thereafter. Girls experience a decline of 7% in self-assessed general health between Grades 6 and 7, and a decline of 14% overall from Grade 6 to Grade 10. As a result, while there is no gender gap in Grade 6, there is a significant gender gap in Grade 10.
In Grade 6, 62% of boys and 65% of girls give themselves a high score (between 8 and 10) on the life satisfaction ladder (Figure 7.12). This proportion changes only marginally for boys across the grade levels, peaking at 64% in Grade 8 and dropping as low as 56% in Grade 10. In contrast, the percentage of girls reporting high life satisfaction decreases sharply from Grade 6 to Grade 7 (53%) and sinks to fewer than half (48%) by Grade 10. As with many other measures of emotional health, there are limited gender differences in Grade 6, but marked gender differences in Grade 10, largely as a result of girls’ worsening emotional health between Grades 6 and 7.


Relationship of life satisfaction to emotional health
There is a strong relationship between students’ life satisfaction and both specific measures of emotional health (psychosomatic symptoms and emotional well-being). The number of reported psychosomatic symptoms during the past six months decreases significantly for both boys and girls as life satisfaction increases (Figure 7.13). Boys who score themselves 0 on life satisfaction report 5.3 psychosomatic symptoms on average, as contrasted with boys scoring 10 on life satisfaction who report only 1.2 psychosomatic complaints. Likewise, girls with 0 on life satisfaction indicate 6.3 psychosomatic symptoms; girls with 10 on life satisfaction report only 1.4 symptoms. At each level of life satisfaction, girls report more psychosomatic symptoms than boys.

Similarly, as shown in Figure 7.14, level of life satisfaction is connected to having a low score on the emotional well-being scale. Eighty-eight percent of boys who have the worst possible life satisfaction (a score of 0) have low emotional well-being, while only 13% of boys with the best possible life satisfaction (a score of 10) fall into this category. Sixty-eight percent of girls scoring 0 on life satisfaction and 100% of those scoring 1 have low emotional well-being, whereas only 15% of those scoring 9 and 14% of those scoring 10 are in this group. With the exception of the life satisfaction score of 0, boys with the same life satisfaction score as girls are less likely to have low emotional well-being.
