ARCHIVED: Chapter 5: Young people in Canada: their health and well-being – The School Experience

Adolescents spend a substantial portion of their lives in school settings. Their experiences in such settings strongly influence their social and emotional health and their development, both positively and negatively (Wells, 2000). Specifically, students' health behaviours and their views of themselves are related to their lives in school (Anderman, 1999). In addition to the direct teaching of academic skills, schools provide opportunities for adolescents to develop social connections that often have lasting impacts on their lives. For the majority of adolescents, schools provide positive experiences with teachers and peers, helping them to develop strong emotional bonds and self-confidence. However, for some young people, school is a threatening and uninviting place. Adolescents who feel isolated or rejected in school or believe that their school's expectations are too high tend to disengage from school life. These young people are prone to becoming involved with peers sharing similar negative attitudes, which can ultimately result in increased health-risk behaviours (Connop and King, 1999).
In Canada, education falls under provincial and territorial jurisdiction, with each province and territory establishing its own curriculum, general structure, and organization (Figure 5.1). Although a single national education system does not exist, there have been some attempts to create common curricula across jurisdictions – for example, the Western Protocol for Collaboration in Basic Education (WCP). With few exceptions, the formal education in most provinces occurs from kindergarten to Grade 12 and is separated into elementary and secondary programs. In Alberta and Ontario, kindergarten is optional; further, Ontario has a two-year kindergarten program. In Quebec, the final year of formal public education ends in Grade 11. Ontario phased out its Grade 13 year in June 2003. Provinces and territories also vary in their funding of alternative educational programs. Public education is generally considered non-denominational. However, Roman Catholic education boards are fully funded in some jurisdictions (e.g., Alberta and Ontario), partially funded in others (e.g., British Columbia), or not funded at all (e.g., the Atlantic Provinces). Newfoundland recently required all schools to be non-denominational, although religion courses are offered at all grade levels in the public system.
Figure 5.1 Organizational structure of Canadian schools, by province and territory

In elementary education, students have primarily one teacher for all of their school subjects for the entire year. Although the elementary panel includes Grade 6 in each province or territory, the final year of elementary education varies from Grades 6 to 8. In the secondary panel, students complete separate classes under the guidance of subject specialist teachers; thus, students have several teachers over the year. The secondary panel is formally or informally divided into junior and senior secondary programs. Individual school districts use different variations in order to maximize the use of buildings or to address a specific educational philosophy. It is not uncommon, therefore, to see different panels, or portions of a panel, occurring in the same building. For example, the junior secondary panel can be housed with either the elementary or the senior secondary panel. In terms of student support services, elementary schools often share counselling services with other nearby elementary schools. Some limited learning support is generally available in the school, although many of these services are provided by itinerant staff. Secondary schools are more likely to have counselling services and expanded learning support services within the school, although specialized itinerant staff may also be used. The level of such support is often related to school or district size.
Secondary panels throughout Canada offer a variety of curriculum programs, providing students with opportunities to enrol in courses in the humanities, arts, sciences, and technical strands. Most jurisdictions also provide academic and less academic programs in foundational courses (most commonly in language arts, mathematics, and science). In an attempt to introduce students to the world of work, emphasis on career exploration and workplace experiences is growing. Within and across districts and provinces, there is also some variation in the manner in which specific education programs are offered; for example, full-year or semestered programs.
One growing trend in education in Canada is the use of large-scale assessments to monitor school effectiveness. The Council of Ministers of Education, Canada (CMEC), sponsors the national Student Achievement Indicators Program (SAIP). Canada also participates in international assessment programs, most notably in math and science, such as the Trends in Mathematics and Science Study (TIMSS) and the Programme for International Student Assessment (PISA). Many provinces test sufficient numbers of students with these assessments so that provincial results can be compared directly with those from other countries.
According to the TIMSS 1999 International Math Report, Canada placed tenth on the TIMSS test of mathematical achievement for 14-year-old students in a field of 40 countries. Canada's average scale score was 531. This score was significantly higher than the international average of 487 (Mullis and colleagues, 1999). According to the TIMSS 1999 International Science Report, Canada placed fourteenth in the TIMSS test of science achievement. Again, the Canadian average score of 533 was well above the international average of 488 (Martin and colleagues, 1999). The results from the most recent administration of PISA ranked Canada highly in comparison with 31 other countries where 15-year-old students wrote the test (Human Resources Development Canada, 2002). Canadian students averaged second in reading, sixth in mathematics, and fifth in science.
Within the context of individual students, previous research has linked academic achievement to measures of school climate and parental support (Ho and Willms, 1996; Ma and Klinger, 2000). This chapter examines six aspects of the school experience that relate to the academic and social development of school-aged youth and that have implications for the emotional and physical health of adolescents. Specifically, students were asked to give their perceptions of academic achievement, school satisfaction, school climate, teacher and parental support, and pressure to achieve at school. Where possible, results are reported by grade and gender. Trends with previous HBSC cycles are included, as are associations with health-risk measures.
Academic Achievement
According to international assessments, Canadian youth score very well relative to their peers in other countries. Further, national and international studies have consistently found that in upper elementary and secondary schools, girls outperform boys in measures of reading and writing, while boys tend to outperform girls in science. Gender differences in mathematics are less pronounced (Robitaille, Taylor, and Orpwood, 1996).
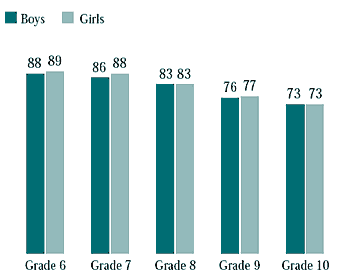
In the 2002 administration of the HBSC, students were asked to self-report their achievement and perceived academic abilities. Figure 5.2 illustrates the proportion of students who believed their teachers thought their school work was good or very good, compared with others. Age differences existed, with more students in earlier than later grades placing themselves in one of these categories. In comparison, previous editions of the HBSC have documented higher scores on this measure, most notably for girls at all grade levels and for boys in Grade 10 (King et al., 1996; 1999). Nevertheless, the results indicate that Canadian students had positive views about the quality of their school work. Although not provided here, the results from other survey questions related to achievement support this general supposition. For example, the majority of Canadian students believed they did very well at their classwork (72 percent of boys and 81 percent of girls in Grade 10). Proportions at the younger grade levels were even higher, with less gender variation. Students considered themselves to be pretty intelligent – 82 percent of boys and 78 percent of girls in Grade 10 stated that this described them well or very well – although girls tended to be slightly less confident in their own intelligence at all grade levels (data not shown). This contrasted with girls' having equally positive attitudes about their classwork (Figure 5.2).
Figure 5.2 Students who said their teachers thought their school work was good or very good, compared with others (%)
When asked about the time they spent doing homework, girls reported more time spent doing homework than did boys, especially at the older grade levels (Figures 5.3 and 5.4). Also, girls spent more time doing homework in Grades 9 and 10 than in the earlier grades, whereas boys showed no increase in the higher grades.
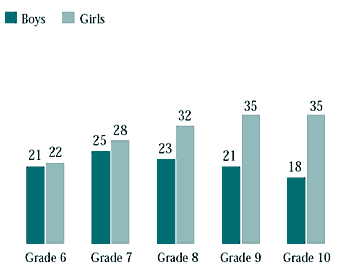
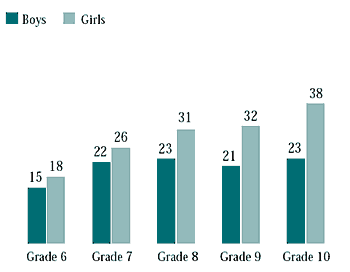
Table 5.1 shows correlations between a scale that measures students' perception of their school achievement with other items from the HBSC survey. Perceived achievement was significantly associated with other measures of the school experience, emotional health, and health-risk behaviours. The largest associations were with school satisfaction and lack of pressure to achieve. Students who had higher achievement also had a better relationship with teachers. Students who reported higher perceived achievement were more likely to have higher levels of self-esteem, as well as positive relationships with parents. However, these relationships declined in higher grade levels. Achievement was also associated with positive feelings regarding health and overall life measures. Lastly, students who reported higher achievement were somewhat less likely to engage in risk behaviours or to have friends who engage in these behaviours.
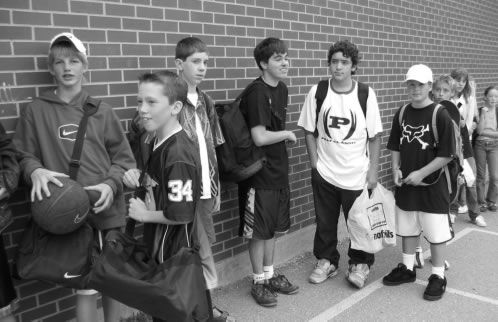
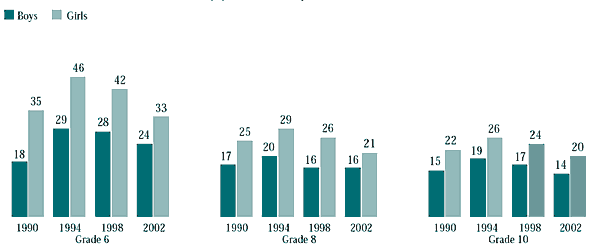
This difference in liking school between elementary (Grade 6) and secondary students occurred at the same time as the shift from having a single teacher to multiple teachers. However, in Grade 8, depending on the jurisdiction, students may have had one or more teachers. Thus, it is not possible to determine whether the decrease in liking school was associated with the changing school structure or with factors associated with the student. In spite of the relatively low percentage of students who liked school a lot, the majority of students enjoyed school activities, with little difference found between genders and only small declines in the higher grades (Figure 5.6).
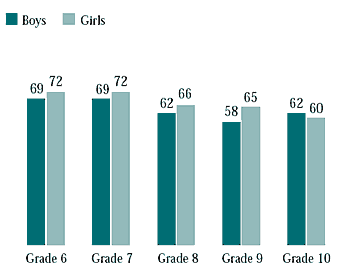
Table 5.2 shows the correlation between the created school satisfaction scale and other items from the survey. Students who were satisfied with school had relatively strong positive relationships with their teachers, peers, and parents. These associations were similar across grade levels. As with achievement, students who did not feel pressured to achieve were more likely to be satisfied with their school experience. Similarly, self-esteem, overall health, and life satisfaction were higher in students who were satisfied with school. Again, these relationships were consistent across grade levels. Grade 10 students who were satisfied with their school experience were less likely to be sexually active or involved with smoking, alcohol, or drugs.
Relationship With Teachers and Classroom Atmosphere
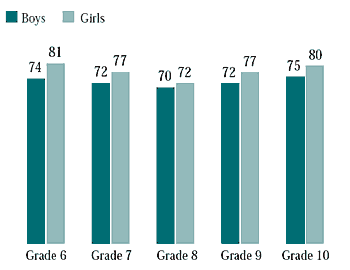
A large part of the school experience is affected by students' impressions of their classrooms and teachers. The 2002 HBSC results support previous research which found that teachers who created a supportive classroom environment were more likely to have students who were satisfied with school (Samdal, Nutbeam, Wold, and Kannas, 1998). The HBSC survey asked students about their perceptions of their teachers and the atmosphere in the classroom. Over three-quarters of students at all grade levels believed they could get extra help when needed. However, as students progressed through their schooling, they were less likely to believe that teachers were interested in them as persons (Figure 5.7). The results were similar for both boys and girls, although in comparison with the 1998 HBSC results, the relative proportion of girls agreeing with this statement had declined. Thus, while students in 2002 perceived teachers as being less interested in them, teachers were still viewed as being friendly, especially in Grades 6 and 10. Grade 8 teachers were viewed as being the least friendly (Figure 5.8). Girls were more likely than boys to believe that their teachers were friendly.
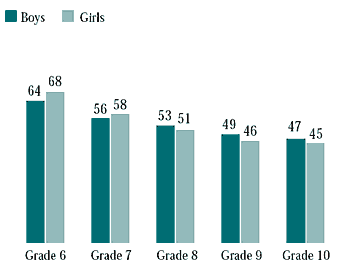
From Grade 6 to Grade 10, many students increasingly found the classroom to be a teacher-centred place, with fewer opportunities for students to have input into how class time was used (Figure 5.9). Boys were more likely to believe that they had a say in how class time was used, which is interesting, given that they tended to have less positive views of school and the classroom overall (Figures 5.5 and 5.6).
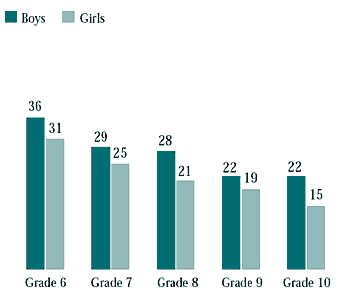
Table 5.3 provides the correlations between the scale created for student-teacher relationships and other items from the survey. Positive teacher relationships were most strongly correlated with peer and parental support, although the association decreased over time for friends and grew over time for parents. In contrast, the connection between achievement and relationship with parents decreased in the higher grade levels (Table 5.1). Not surprisingly, students who had good teacher relationships were less likely to feel pressured to achieve at school and reported higher student autonomy. The associations between teacher relationships and risk behaviours (drugs and alcohol) were slightly stronger than were the school experience measures examined in Table 5.2. Reduced bullying behaviour was also linked to positive teacher relationships
Relationships With Other Students
Adolescence is a time during which youth experience many changes. Along with a change in schools, they also undergo physical and emotional developments. Aside from the relationships that parents and teachers have with students, peer relationships play a significant role in adolescents' lives. Being socially accepted or rejected by peers can deeply affect an adolescent's self-confidence and sense of self (Baumeister and Leary, 1995). In the 2002 HBSC survey, positive peer relationships were weakly associated with perceived achievement and more strongly associated with higher school satisfaction and positive teacher relationships (Tables 5.1, 5.2, and 5.3).
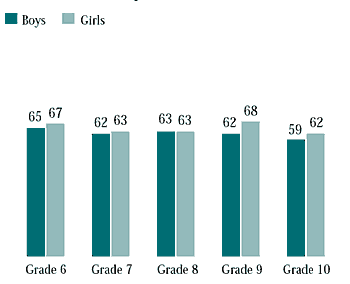
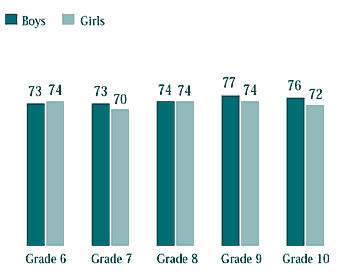
Young people need to feel accepted and supported by their parents, teachers, and peers. Figure 5.10 shows the proportion of students who felt other students in their classes were kind and helpful. Changes in the response options in the 2002 survey make it impossible to compare these results with those of the previous HBSC surveys. Figure 5.11 shows the percentage of students who agreed or strongly agreed that other students accepted them as they were. Approximately three-quarters of respondents felt accepted by their peers across grade levels. The proportions were similar across grades for both boys and girls. The proportion of students who strongly agreed with the statement that “other students accept me as I am” decreased in higher grades, suggesting that older students' feelings of acceptance were more tenuous (data not shown). Further, at each grade level, approximately 10 percent of children did not feel accepted by their peers. These percentages were similar for both boys and girls.
Parents and School
Students' academic performance and successes are linked to the support their parents provide to them (Ho and Willms, 1996; Steinberg, Lamborn, Sanford, and Darling, 1992). Students whose parents are involved in their school lives and who constantly encourage them to do well in school are more likely to succeed in their scholastic endeavours than are students whose parents are not encouraging or are indifferent (Wang, Wildman, and Calhoun, 1996). The role of parents is growing within educational systems as provinces create mechanisms that involve parents in educational discussions and decisions. Parent advisory councils are increasingly common, and it is not unusual to have parent representation on district and school committees.
It is important that parents are able to communicate effectively with teachers and administrators at the school; schools throughout Canada have procedures to foster such discussions. This communication allows parents to discuss issues or concerns regarding their children's progress. Parents can then work with their children to support their learning and educational goals. Approximately 80 percent of the students surveyed in the 2002 HBSC agreed or strongly agreed that their parents would be willing to come to the school and talk to teachers. This proportion was consistent across grade and gender. Unfortunately, because of changes in the response options, it is not possible to compare these values directly with previous administrations of the HBSC.
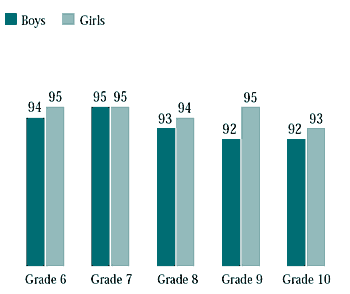
Overall, students believed parents supported their education, with more than 90 percent of students agreeing or strongly agreeing that their parents encouraged them to do well in school (Figure 5.12). These results were similar for both boys and girls and also across grade levels, but as shown in Chapter 3 (The Home), parent willingess to help with school problems may be influenced by family wealth. This consistent level of support from parents is encouraging, because previous administrations of the HBSC have found lower parental support for students in the secondary panels. The results suggest that it is possible to keep parents closely involved with their children's education even after the student has entered high school. Further research is needed to determine whether this involvement can be attributed to the increasing opportunities for parents to be involved in the school community.
Pressure to Achieve at School
The pressure to achieve at school is a “double-edged sword” for many students. Typically, the students who say they are experiencing too much pressure from parents or teachers are the ones who are not achieving to the expectations of such authority figures. Thus, it is likely important that parents are in direct communication with the school and that parents, teachers, and students have realistic expectations. Such communication is important because, as reported previously in this chapter, higher perceived achievement and school satisfaction was found in those students who did not feel pressured by school and by high parental expectations for school.
In terms of school work, students in the 2002 HBSC sample found the work increasingly difficult in succeeding grade levels. Further, the proportion of students who agreed or strongly agreed that they had too much school work increased from Grade 6 to Grade 10. Boys at all grade levels were more likely to believe that school work was difficult or that they had too much school work (data not shown). This is an interesting finding, given that boys reported doing less homework than girls did and that the amount of homework they completed on weekdays decreased slightly in the older grades. It would appear that boys were finding more time constraints due to other activities (see Chapter 7, Healthy Living).
Along with measures of amount of school work, the survey asked students to indicate the pressure they felt regarding school work. Figure 5.13 gives the proportion of students who felt a lot of pressure because of school work. Increased pressure was associated with higher grade levels, although there was a shift in the relative pressure felt by boys and girls. In Grade 6, boys were more likely than girls to feel pressured, whereas in Grade 10, the reverse was true. The proportion of students who felt pressured in 2002 dropped in comparison with 1998 and was similar to the results found in 1994. Academic expectations and pressure can come from both teachers and parents. The expectations from teachers tended to remain constant at the different grade levels, although boys were more likely than girls to believe teachers expected too much of them (Figure 5.14). While the views of Grade 10 students remained stable over time, students in Grades 6 and 8 in 2002 were more likely to believe teachers expected too much from them, compared with the 1998 and 1994 surveys (data not shown).
Figure 5.13 Students who felt a lot of pressure because of school work, by year of survey (%)
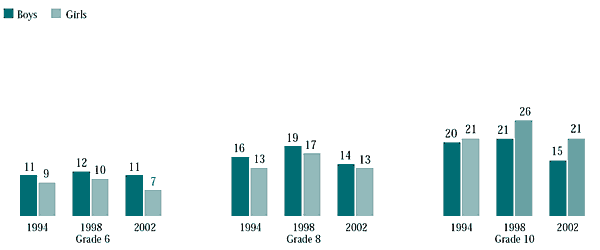
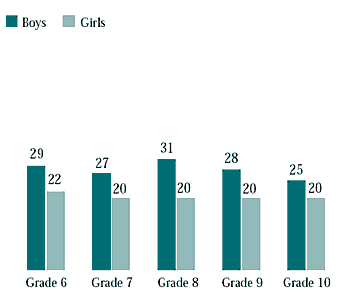
Table 5.4 shows the correlations between the scale measuring students' perception of academic pressure to achieve and other items from the survey. The strongest relationships with academic pressure were self-esteem and positive parent relationships, which were higher in those students who did not feel pressured by achievement expectations. For both measures, the correlation was highest in Grade 6 and dropped in Grades 8 and 10. Not surprisingly, students who felt less pressured by school/teacher/parent expectations were less likely to exhibit psychosomatic symptoms or to feel lonely. Associations with health-risk behaviours were similar to those reported with other school experience measures.
Major Findings
- Perceived achievement in students was related to lower pressure to achieve at school, satisfaction with school, good relationships with parents, and high self-esteem.
- Perceived achievement was also linked to perceived health satisfaction, lower risk-taking behaviour, and fewer risk-taking friends.
- Overall, most students liked school, but after peaking in 1994, the proportion of students who liked school dropped steadily.
- School satisfaction was related to good teacher, peer, and parent relationships, lower pressure to achieve at school, higher self-esteem, and increased student autonomy at school.
- School satisfaction was also associated with perceived health, lower risk-taking behaviour, and fewer risk-taking friends.
- Students in higher grades felt they had less say in how class time was used. Good relationships with teachers were associated with good parent relationships (especially in higher grades), lower pressure to achieve at school, good peer relationships, school autonomy, and high self-esteem.
- Good relationships with teachers were related to lower risk-taking behaviour and fewer risk-taking friends.
- A small, but worrying, minority of students did not feel accepted by their peers.
- Parent encouragement of students to do well academically increased slightly from 1998.
- More boys than girls reported school work to be difficult, yet they did less homework.
- Boys stated that they spent less time doing homework while also reporting higher levels of teacher expectations.
- Students who reported lower pressure to achieve indicated higher self-esteem and good parent relationships.
- Students reporting lower pressure to achieve also stated that they had fewer health symptoms, less loneliness, lower risk-taking behaviour, and fewer risk-taking friends.