
Vaccination coverage in Canadian children: Results from the 2019 childhood National Immunization Coverage Survey (cNICS)
Download in PDF format
(741 KB, 30 pages)
Organization: Health Canada or Public Health Agency of Canada
Published: 2020-12-22
Table of contents
- List of tables
- List of figures
- Highlights
- Background
- Methods
- Results
- Strengths and limitations
- Conclusion
- References
List of tables
- Table 1. Sample Size of the childhood National Immunization Coverage Survey for the childhood vaccinations component
- Table 2. Source of immunization data by age group for the childhood vaccinations component of the childhood National Immunization Coverage Survey, Canada, 2019
- Table 3. Sampling, response rates (%), and participation by age group for the childhood vaccinations component of the childhood National Immunization Coverage Survey, Canada, 2019
- Table 4. Estimated national vaccination coverage of routine childhood vaccines by 2 years of age, by gender—childhood National Immunization Coverage Survey, Canada, 2019
- Table 5. Estimated national diphtheria, tetanus and acellular pertussis (DTaP) coverage at varying age milestones, by gender—childhood National Immunization Coverage Survey, Canada, 2019
- Table 6. Estimated national vaccination coverage of routine childhood vaccines by 7 years of age, by gender—childhood National Immunization Coverage Survey, Canada, 2019
- Table 7. Estimated national vaccination coverage of vaccines offered in school-based programs for 14- and 17-year-old adolescents, by gender—childhood National Immunization Coverage Survey, Canada, 2019.
- Table 8. Proportion of children with no history of vaccination by age group – childhood National Immunization Coverage Survey, Canada, 2019
List of figures
- Figure 1. Comparison of coverage estimates for 2-year-old children from childhood National Immunization Coverage Survey 2013, 2015, 2017 and 2019
- Figure 2. Comparison of coverage estimates for 7-year-old children from childhood National Immunization Coverage Survey 2013, 2015, 2017 and 2019
- Figure 3. Comparison of coverage estimates for 14- and 17-year-old children from childhood National Immunization Coverage Survey 2017 and 2019
Highlights
- Most of the 2019 national vaccination coverage estimates failed to meet the corresponding coverage goals, except for the rubella vaccine among 7-year-olds and the tetanus, diphtheria and acellular pertussis (Tdap) booster among 17-year-olds.
- Among children aged 2 and 7 years, coverage for most routine vaccines has
not changed by a large amount from past cycles of this survey.
- However, among 2-year-olds, an increase in hepatitis B vaccination from 74.1% in 2017 to 83.6% in 2019 and in rotavirus vaccination from 78.8% to 84.5% was observed from one cycle of cNICS to the next.
- Coverage for meningococcal type C among 2-year-olds also increased from 87.6% in 2017 to 91.1% in 2019.
- Among 14-year-olds, cNICS 2019 provided the first estimates of human papillomavirus (HPV) coverage among young males with 73.0% having been vaccinated. For 14-year-old females, coverage reached 87.1% in 2019.
- Among 17-year-olds, coverage for the Tdap booster increased from 89.3% in 2017 to 95.3% in 2019, meeting the national coverage goal of 90%.
- As compared to females, a statistically significant higher vaccination coverage was observed for male children for rotavirus among 2-year-olds and diphtheria, tetanus and acellular pertussis (DTaP) at 7 months of age. Conversely, 14-year-old females had a statistically significant higher coverage for HPV.
Background
The Public Health Agency of Canada (PHAC) routinely monitors childhood vaccination coverage in Canada through the childhood National Immunization Coverage Survey (cNICS). Since 1994, cNICS has been conducted approximately every 2 years to estimate national uptake for all publicly funded routine childhood vaccinations that are recommended by the National Advisory Committee on Immunization (NACI)Footnote 1. Statistics Canada has conducted cNICS on behalf of PHAC since 2011. The survey is administered to parents and guardians and measures the proportion of children who have received all routine vaccinations by ages 2, 7, 14, or 17 years. The survey also assesses knowledge, attitudes, and beliefs (KAB) among parents and guardians to better understand factors influencing decisions on vaccination for their children; however, these KAB results will be published in a separate report. In 2019, a new Survey of Vaccination during Pregnancy was conducted jointly with cNICS but will be reported separately. Overall, results from cNICS help measure how well Canadian children are protected against vaccine preventable diseases (e.g. measles, diphtheria, pertussis, tetanus, polio), as well as what parents and guardians know and think about vaccines.
As part of the National Immunization Strategy (NIS) objectives, national vaccination coverage goals based on international standards and best practices were set in 2017 (to be achieved by 2025) for vaccines that are publicly funded in all provinces and territories (PT)Footnote 2. While reflecting the Canadian context, the goals and targets are also consistent with Canada’s commitment to the World Health Organization (WHO) disease elimination targets and the Global Vaccine Action PlanFootnote 3. This includes a vaccination coverage goal of 95% coverage for childhood vaccines (assessed at ages 2 and 7 years) and 90% coverage for adolescent vaccines (assessed at age 17 years)Footnote 2.
Data from cNICS is used to report Canada’s progress towards achieving the national vaccination coverage goals and to meet its international reporting obligations to the WHO and the Pan American Health Organization (PAHO). Importantly, cNICS data is used to understand how well vaccination programs are working, and how they could be improved.
Overall, the main objectives of the 2019 cNICS are to:
- Produce national estimates of vaccination coverage for children and youth aged 2, 7, 14 and 17 years oldFootnote 4
- Provide the World Health Organization and the Pan-American Health Organization with estimates of national vaccine coverage for childhood vaccines such as measles, diphtheria, pertussis, tetanus and polioFootnote 5
- Provide information on parental and guardian knowledge and beliefs about vaccinesFootnote 5
Methods
The 2019 cNICS questionnaire was developed by Statistics Canada and PHAC. The questionnaire is available on Statistics Canada’s websiteFootnote 4. For the 2019 cycle, the survey was conducted for the first time via electronic questionnaire (EQ). As part of the process to move to EQ, experts from the Questionnaire Design Research Centre (QDRC) of Statistics Canada reviewed and tested the survey content, including reviewing the entire questionnaire and conducting one-on-one interviews in Montreal and Ottawa prior to collection. The childhood vaccines included in cNICS 2019 were those that are publicly funded under provincial and territorial programs. Vaccines recommended only for travel and some high-risk groups were excluded.
Sampling
The target population for the 2019 survey is all children aged 2, 7, 14 and 17 years old on March 1, 2019, living in Canada’s 10 provinces and 3 territories, not residing on First Nations reserves, not in foster care, and not institutionalized. The sampling frame was built using the list of children for whom the Canada Child Benefit (CCB) was claimed as of June 2019. The difference between the target and survey populations consists of children whose parents or guardians did not apply for CCB benefits either because they were not aware of the benefit, chose not to request it, or were subsidized by the provincial government for children living with a foster family for the entire year. However, the CCB’s list was estimated to include 96% of Canadian children in 2018 when compared to the demographic projections for Canada, the provinces and territories and analysis revealed no important under-coverage bias.
Children were randomly selected from the sampling frame by Statistics Canada. Only one eligible child from each household was selected. Depending on the age group, children were selected by strata defined by province or territory of residence, age, and gender for youth aged 14 years. Stratifying the target population ensured that the sample is representative while remaining efficientFootnote 4. The initial sample size was determined by setting quality targets for the estimated vaccination coverage rates and then the sample size was increased in order to account for non-response. The final sample size by age group is shown in Table 1. The 14-year-old age group was stratified by gender to allow estimates of good quality for human papillomavirus (HPV) vaccination coverage by gender. Differences in HPV vaccination coverage by gender are of interest since school-based vaccination programs previously only targeted teenage girls, but later became gender-neutral in all provinces and territories.
| Age Group | Total Sample Size |
|---|---|
| 2 years old | 897 |
| 7 years old | 804 |
| 14 years old Male | 1,151 |
| 14 years old Female | 934 |
| 17 years old | 1,124 |
| All age groups | 4,910 |
A more detailed description of data collection and processing methods is available on Statistics Canada’s website Footnote 4.
Data collection
Data collection for the childhood vaccinations portion of cNICS 2019 occurred from December 2, 2019 to April 30, 2020 and included 3 sources of data: a self-completed questionnaire or an interview with parents or guardians, immunization history compiled from healthcare providers and data extracted from PT immunization registries.
Parents or guardians
The first component of data collection was a self-completed EQ or a computer-assisted telephone interview (CATI) through which the parent or guardian (the person most knowledgeable or PMK, hereafter referred to as the respondent) answered survey questions about the child’s immunization history as well as questions about their knowledge and beliefs regarding immunizationFootnote 5. This was followed by an assessment of the child’s healthcare record from the child’s immunization provider, when it was available. The process is described below.
Mail-out notification
An invitation package with an introductory letter, a brochure, a consent form and a return envelope to mail back the consent form was mailed to the parents or guardians of selected children. The introductory letter informed them of the purpose of the voluntary survey, invited them to participate, and asked that they have the child’s immunization records (i.e. vaccination card or booklet) on hand when completing the survey. The letter also provided a secure access code for respondents to use to access the self-response EQ.
Electronic questionnaire or computer-assisted telephone interview
In the introductory letter that was mailed out, respondents were encouraged to complete the EQ or, if they preferred, to call the help line to complete the questionnaire with a trained Statistics Canada interviewer. In the case that a CATI was conducted, a trained Statistics Canada interviewer contacted the respondent using a telephone number (including landline or cell phone) provided in the CCB file. The respondent was asked to retrieve the selected child’s vaccination booklet for the interview. In addition, for 2- and 7-year-olds, if the respondent answered “no” to the question “Do you have access to a copy of your child’s official immunization record or booklet?” on the EQ, they received a statement saying, “It is important that we have the most accurate information possible about your child’s immunization. Please look for the immunization record and an interviewer will contact you soon to collect your child’s vaccination information. In the meantime, we have some questions regarding your knowledge and beliefs about immunization. Press the Next button to continue”. An interviewer would later contact the respondent to see if they found their booklet and to complete the questions that were skipped on the EQ. If the respondent was able to locate the child’s vaccination booklet for the CATI, respondents were asked:
- To read the booklet and provide the names of the vaccines and dates administered;
- To report any other vaccinations not listed in the booklet;
- To recall by memory whether the child was ever vaccinated for hepatitis B, HPV, or had received the tetanus, diphtheria and acellular pertussis (Tdap) and meningococcal booster vaccines in 17-year-olds only, if not already reported;
- To answer questions on the family/child demographics, such as education and country of birth; and
- To give their permission for Statistics Canada to contact the child’s healthcare provider(s) to supplement the vaccination information provided during the interview. All age groups in the study were included in this step.
For children aged 2 and 7, it was a requirement that the respondent have the immunization booklet or record available since the respondent was asked detailed questions about the vaccinations the child had received. If the respondent was not able to locate the child’s vaccination booklet at the time of the call, the EQ or interviewer would then skip the detailed vaccination questions. For 2-year-old children, respondents were then asked about their knowledge and beliefs regarding immunization. However, for children aged 14 and 17, if the respondent did not have the immunization book on hand, they were asked, based on their memory, if the child had received specific vaccines. Parents and guardians of 14-year-old children were then asked about their knowledge and beliefs regarding immunization.
To maximize response rates, non-response follow-up was conducted at regional offices using a tracking system. If the completed questionnaire was not received by a certain date after being mailed out, then a Statistics Canada interviewer would contact the respondent to follow up. In cases where the Parent Consent Form or the Immunization Record Request Form was not returned about 6 weeks after being mailed out, follow-up by phone began at about the same time as CATI started. Interviewers made up to 3 follow-up calls at 2-week intervals if the forms were still not returned to remind respondents to return the forms at the earliest possible convenience. Interviewers asked respondents if they had already mailed back their completed consent form; if they said no, they asked if the respondent still had the consent form. If the respondent did not have the consent form, the interviewer would send a new consent form and advise the respondent that they may follow up by telephone to confirm that they have received and mailed back the completed form. Furthermore, up to 3 reminder letters were sent out to respondents to remind them to complete the EQ or the consent form.
Healthcare providers
In the second component of data collection, parents and guardians were asked to fill out the Parental Consent Form that was mailed out with the invitation package. The form asked for consent to contact the child’s healthcare provider(s) as well as for the names and contact information of all healthcare providers (e.g. physician, nurse, public health unit, health clinic) that vaccinated the child selected for the survey. Once the Parental Consent Form was returned, the third phase of data collection commenced in which Statistics Canada sent an Immunization Record Request Form and a mail out/mail back questionnaire to the child’s healthcare provider(s) to complete with the child’s detailed immunization history.
Healthcare provider(s) were only contacted if parental consent was given for children aged 2, 7, and 14 in all provinces and territories while healthcare provider(s) were only contacted for children aged 17 if consent was given by the child. The data provided by the healthcare provider(s) were combined with and used to enhance the PMK reported data. Statistics Canada followed up with all the healthcare providers identified in the consent forms and offered them a $25 stipend for completing the Immunization Record Request Form. Healthcare providers were asked to record all the vaccinations given to the child and the corresponding dates of when each vaccine was administered.
Immunization registry data
Statistics Canada is working on establishing data sharing and data acquisition agreements with individual jurisdictions in order to use vaccination record data held by regional, provincial, and territorial immunization registries in place of PMK or healthcare provider data. In other words, if the respondent provides consent for record linkage, the data concerning the child’s immunization record would be obtained from the provincial immunization registry and the respondent would skip all the questions regarding vaccination status. Where available, and where permission has been given from cNICS respondents to access the child’s vaccination record, the immunization registry data will be used to evaluate the potential to further integrate immunization registry data in future cycles of the surveyFootnote 4. For cNICS 2019, Statistics Canada had concluded data sharing and data acquisition agreements as well as an assessment of the registry coverage for Prince Edward Island and Manitoba. Consequently, parents and guardians living in these 2 provinces were able to skip the detailed questions about vaccination, providing they agreed to share the child’s identifiers (name, gender, address, birth date, and health number) with the respective provincial immunization registryFootnote 5. When consent was provided, registry immunization data was used in place of PMK or immunization provider data.
Source of immunization data
Overall, the sources of the immunization data for cNICS 2019 were the PMK (with or without the child’s vaccination booklet), healthcare providers, both PMK and healthcare providers, and provincial immunization registry data. The percentage breakdown of immunization data source by age group is provided in Table 2. Among 2- and 7-year-olds, the PMK with the vaccination booklet as well as the PMK with the booklet and healthcare providers provided the largest proportion of the data on immunization status than the other source categories. However, among 14- and 17-year-olds, the most information on immunization came from the PMK without the immunization booklet. This reflects the data collection procedures which required respondents for 2- and 7-year-olds to have the vaccination booklet while completing the EQ or CATI, but did not impose this criterion on respondents for 14- and 17-year-olds. Healthcare providers were also a more important source of immunization data for 14- and 17-year-olds than for the 2- and 7-year-old age groups. Finally, registry data was used to collect immunization data for a range of only 3.6% to 5.5% of participants in different age categories. Across all age groups, a large proportion of immunization data came from the PMK without the vaccination booklet (38.3%); however, this simply reflects the major source of immunization data among 14- and 17-year-olds as there were a larger number of participants among those age groups than the 2 younger age groups. The next largest proportion of immunization data came from the healthcare provider (20.7%) as this source was the next most common among 14- and 17-year-olds. Finally, the combination of PMK with the vaccination booklet and healthcare providers (17.7%) as well as just the PMK with the booklet (17.1%) were the next largest sources of immunization data, reflecting the major source of vaccination data among 2- and 7-year-olds.
| Age group | 2 years old | 7 years old | 14 years old | 17 years old | Total | |||||
|---|---|---|---|---|---|---|---|---|---|---|
| n | % | n | % | n | % | n | % | n | % | |
| PMK with booklet | 159 | 33.4 | 115 | 33.4 | 171 | 14.4 | 0 | 0.0 | 445 | 17.1 |
| Healthcare Provider (HCP) | 31 | 6.5 | 25 | 7.3 | 272 | 22.9 | 209 | 35.4 | 537 | 20.7 |
| PMK with booklet and HCP | 156 | 32.8 | 165 | 48.0 | 139 | 11.7 | 0 | 0.0 | 460 | 17.7 |
| PMK with booklet and HCP – exact match | -Footnote a | -Footnote a | -Footnote a | -Footnote a | 6 | 0.5 | 0 | 0.0 | 53 | 2.0 |
| PMK no booklet | -Footnote a | -Footnote a | -Footnote a | -Footnote a | 557 | 46.9 | 352 | 59.7 | 994 | 38.3 |
| Registry data only | 18 | 3.8 | 19 | 5.5 | 43 | 3.6 | 29 | 4.9 | 109 | 4.2 |
n = non-weighted count
|
||||||||||
Data processing
The survey data from cNICS 2019 was processed in order to convert the collected data into a form that is appropriate for analysis and tabulation.
Built-in edits
Since collection was performed using a self-response EQ or CATI, it was possible for certain edits to be built into the application. For example, validity edits ensured that responses fell within the allowed range and that only character values were entered into character fields or numeric values were entered into numeric fieldsFootnote 4. Following data collection, the raw data file of survey responses was run through a series of standard processing steps designed to clean the data and help ensure its consistency, thereby increasing its usefulness for analysis. Flow edits replicated the flow patterns used in the application and set the non-applicable questions to a value of ‘Valid Skip’. On the other hand, questions that were applicable to the respondent but were not answered (i.e. non-responses) were set to a value of ‘Not Stated’. In past cycle of cNICS, when a CATI application was used, these values were recorded as a response of ‘Refusal’ or ‘Don’t Know’. Additionally, various types of editing were performed to check the logical relationship between responses so as to detect missing or inconsistent information. New variables were also derived using the collected data. These derived variables could be created based on a single variable (by re-grouping or collapsing categories) or based on several variables (by combining them together to define a new concept).
Source combination
For vaccination information that had responses from both the respondent and from the healthcare provider, the 2 sources were combined to provide a more complete vaccination record. Additionally, income information was not collected for the 2019 cycle of cNICS. In order to avoid response burden, total household income was retrieved using linkage to tax data files for the previous year (2018 for this cycle). In other words, Statistics Canada combined responses to cNICS 2019 with tax data from all members of the selected households. When data linkage was not possible, income was imputed using the trend imputation method or nearest-neighbour imputation method.
Imputation
For 2- and 7-year-old Canadian-born children, imputation was done for diphtheria, pertussis and tetanus (DTaP) to account for the fact that in Canada, these antigens are given as part of the combination vaccine diphtheria, tetanus, acellular pertussis, inactivated polio virus, Haemophilus influenzae type B (DTaP-IPV-Hib) and are not available to children as single-antigen vaccines. If a dose date was reported for any one of diphtheria, pertussis or tetanus, it was assumed that the child received all of diphtheria, tetanus, pertussis and polio on that given date. Polio was included as this antigen is given in combination with DTaP at those age milestones; however, a dose date for polio was not used as a donor for imputation as there is a polio vaccine licensed for use in Canada (i.e. children can receive a single-antigen polio vaccine without also receiving DTaP). These imputations were not made for any other combination vaccines, as some of the other antigens may have been administered as single-antigen vaccines in Canada and/or other countries.
Variation adjustment and standardization
Children were considered to be vaccinated for specific antigens if they had received the recommended number of doses by 2, 7, 14, and 17 years of age. Variation in provincial or territorial vaccination programs were considered in calculating the required number of doses; however, certain vaccination requirements were standardized across all jurisdictions (i.e. one dose of measles, mumps, rubella, varicella by 2 years of age). Minimum ages and appropriate dose intervals were not always considered when estimating coverage. However, 2 doses of the same antigen had to be at least 28 days apart to be considered as distinct.
Weighting
As cNICS is a probabilistic survey, survey weights were assigned to respondents in order for estimates to be representative of the target population. Thus, each unit in the sample represents a certain number of units in the populationFootnote 4. These weights were calculated to take into account the sampling strategy as well as nonresponse in order for respondents to also represent the non-respondents. Furthermore, post-stratification adjustments were done using population counts from Statistics Canada’s Labour Force Survey. The purpose of these adjustments is to ensure that the sum of the weights matches the known population totals. In other words, the adjustments ensure consistency between the estimates produced by cNICS and Statistics Canada’s population estimates by age group, region, and gender. The regions used were the Maritimes (Newfoundland and Labrador, Prince Edward Island, Nova Scotia, and New Brunswick), Quebec, Ontario, the western provinces (Alberta and British Columbia), and the Prairies and territories (Manitoba, Saskatchewan, Yukon, Northwest Territories, and Nunavut). Post-stratification was not done by gender for 2-year-olds in the Prairies and territories, 2-year-olds in the Maritimes, and 7-year-olds in the Maritimes; the gender variable was not considered in these regions due to too few participants. The weights were used to estimate vaccine coverage rates in addition to knowledge and beliefs about vaccines for the population groups. Finally, a set of 1000 bootstrap weights was created to estimate variances directlyFootnote 6.
Data analysis
Analysis was completed using the SAS 9.4 software. Based on parental and healthcare provider records, vaccination coverage rates were calculated as the proportion of eligible children who were vaccinated according to their jurisdiction’s recommended scheduleFootnote 7. Quality levels of the coverage proportion estimates were based on domain sample size. For proportions, the domain sample size is the unweighted count of the number of respondents included in the denominator of the proportion. For a domain sample size of less than 85, estimates and confidence intervals were deemed to be of marginal quality (Category E) due to high sampling variability and thus are to be interpreted with caution. If the domain sample size was less than 45, then the estimates and confidence intervals were deemed to be of poor quality (Category F), containing a very high level of instability and thus being unreliable, invalid, and potentially misleading. Estimates that fall under Category F are not recommended for release and consequently, the data are usually suppressed from tables. In this report, there is a Category E estimate only for the proportion of 2-year-old males who were vaccinated with the hepatitis B vaccine. There are no Category F estimates in the cNICS 2019 report.
Results
Participation and response rates
The overall unweighted response rate for the childhood vaccinations component of the 2019 cNICS was 54.5% at the national level. The response rate by age group ranged between 43.9% and 60.0% (Table 3 ). The response rates reported in the table below are the number of children whose parents or guardians responded to questions in either the immunization or the knowledge, attitudes, and beliefs section of the survey as a percentage of the number of children included in the initial sample. These response rates were adjusted to account for out-of-scope units (e.g. children living on a First Nation reserve). Respondents could also include children for whom immunization information was received via the registry or from a healthcare providerFootnote 4. In short, the response rates are calculated as:
Response rate = (number of respondents / effective sample size) * 100%
| Age group | 2 years old | 7 years old | 14 years old male | 14 years old female | 17 years old | Total | ||||||
|---|---|---|---|---|---|---|---|---|---|---|---|---|
| n | % | n | % | n | % | n | % | n | % | n | % | |
| Children sampled from frame | 897 | n/a | 804 | n/a | 1,151 | n/a | 934 | n/a | 1,124 | n/a | 4,910 | n/a |
| Children whose parents agreed to participateFootnote * | 476 | 54.4 | 344 | 43.9 | 674 | 60.0 | 514 | 57.6 | 590 | 54.0 | 2,598 | 54.5 |
n = non-weighted count
|
||||||||||||
Children aged 2 years
The national vaccination coverage goal of 95% was not met for any vaccine among 2-year-old children (Table 4).
The vaccination coverage estimate for at least 4 doses of DTaP by 2 years of age was 77.5%. Coverage was higher for polio (91.9%) than for DTaP, even though this antigen is always administered in a combination vaccine with DTaP, since children require only 3 doses of polio to be considered vaccinated. The lower coverage for Haemophilus influenzae type B (Hib) at 74.4%, despite the fact that all vaccine programs in Canada use DTaP-IPV-Hib, suggests that there may be under-reporting for some antigens included in combination vaccines.
Measles vaccination coverage by 2 years of age was 90.2%; however, when doses administered to those under 12 months of age (the recommended age for measles vaccination) were excluded, coverage dropped slightly to 89.3%. Vaccination coverage for mumps was 89.2% and for rubella was 89.4%. All vaccine programs in Canada administer a combination vaccine (MMR with the measles, mumps and rubella antigens or MMR-V which also includes the varicella antigen). The minor discrepancies between measles vaccination coverage compared to mumps and rubella among 2-year-old children can be due to the availability of monovalent measles vaccines in many developing countries that may be administered before a child has migrated to Canada, as well as transcription errors in and from the child’s vaccination booklet. Varicella vaccination coverage estimates were lower than measles, mumps, and rubella estimates at 82.7%.
Vaccination coverage estimates were 83.6% for hepatitis B, 91.1% for meningococcal type C, 84.4% for pneumococcal, and 84.5% for rotavirus among 2-year-old children. Depending on the province or territory, hepatitis B is either administered as part of the routine infant vaccination schedule or as part of a school-based program. In addition, the meningococcal-C and pneumococcal vaccines are available through different programs across provinces and territories. The meningococcal-C vaccine is administered in a 2-dose program in British Columbia, Alberta, Yukon and Northwest Territories, while all other provinces and territories administer it in a one-dose program. Similarly, the pneumococcal vaccine is available as a 4-dose program in Northwest Territories and Nunavut while it is administered as a 3-dose program in all other provinces and territories. Lastly, rotavirus vaccination coverage was estimated for a 2-dose schedule given at 2 and 4 months in all jurisdictions except New Brunswick, Nova Scotia, and Nunavut. Despite there being no specified national coverage goal for rotavirus, vaccination coverage increased since 2017 when it was lower partly due to the vaccine being relatively new in provincial and territorial schedules. In addition, unlike other routine vaccinations during infancy, there is a maximum recommended age for rotavirus vaccination (i.e. the infant must be less than 15 weeks of age)Footnote 8.
A significant difference between male and female vaccination coverage in 2-year-old children was seen for rotavirus (p = 0.006). Although non-significant based on the criterion of p < 0.05, there were also notable differences observed between male and female vaccination coverage in 2-year-old children for the pneumococcal (p = 0.075) and varicella (p = 0.094) vaccines.
| 2-year-old vaccination coverage, % (95% CI)Note de bas de page * | |||||
|---|---|---|---|---|---|
| Antigen | Number of dosesFootnote ‡ | All children | Male | Female | p |
| Diphtheria | ≥ 4 | 77.5 (73.2 – 81.4) | 79.0 (72.7 – 84.2) | 75.5 (69.0 – 81.0) | 0.421 |
| Pertussis | ≥ 4 | 77.5 (73.2 – 81.4) | 79.0 (72.7 – 84.2) | 75.5 (69.0 – 81.0) | 0.421 |
| Tetanus | ≥ 4 | 77.5 (73.2 – 81.4) | 79.0 (72.7 – 84.2) | 75.5 (69.0 – 81.0) | 0.421 |
| Polio | ≥ 3 | 91.9 (88.7 – 94.2) | 93.6 (89.0 – 96.3) | 89.8 (84.7 – 93.4) | 0.204 |
| Haemophilus influenzae type B (Hib) | ≥ 4 | 74.4 (69.8 – 78.5) | 76.6 (70.2 – 82.0) | 71.5 (64.6 – 77.5) | 0.250 |
| Measles | ≥ 1 | 90.2 (86.8 – 92.8) | 92.2 (87.6 – 95.2) | 87.9 (82.2 – 91.9) | 0.158 |
| Mumps | ≥ 1 | 89.2 (85.6 – 91.9) | 90.6 (85.7 – 94.0) | 87.4 (81.6 – 91.5) | 0.315 |
| Rubella | ≥ 1 | 89.4 (85.9 – 92.1) | 90.6 (85.7 – 94.0) | 87.9 (82.2 – 91.9) | 0.387 |
| Hepatitis B Footnote a | ≥ 3 | 83.6 (77.2 – 88.5) | 79.8 (69.4 – 87.3)E | 86.5 (77.7 – 92.2) | 0.269 |
| Varicella | ≥ 1 | 82.7 (78.6 – 86.0) | 85.7 (80.2 – 90.0) | 79.0 (72.5 – 84.3) | 0.094 |
| Meningococcal type CFootnote b | ≥ 1-2 | 91.1 (87.9 – 93.5) | 92.2 (87.5 – 95.2) | 89.8 (84.7 – 93.3) | 0.397 |
| PneumococcalFootnote c | ≥ 3-4 | 84.4 (80.4 – 87.6) | 87.6 (82.0 – 91.7) | 80.6 (74.4 – 85.6) | 0.075 |
| RotavirusFootnote d | ≥ 2 | 84.5 (80.5 – 87.7) | 89.3 (84.1 – 92.9) | 78.7 (72.3 – 83.9) | 0.006 |
Note: Children whose gender was not disclosed by their parent or guardian (n<5) were included in the combined coverage estimates. 95% CI – 95% Confidence Interval (weighted).
|
|||||
Coverage estimates for multi-dose vaccines, such as DTaP, can be displayed by dose at varying age milestones (Table 5). The majority of hospitalizations due to pertussis occur in infants under one year of age, highlighting the importance of on-time vaccination with the first 3 doses which are scheduled at 2, 4, and 6 months of ageFootnote 9. The DTaP series initiation by 3 months of age is higher at 91.1% and lower at 7 months (76.8% for 3 doses) and 2 years of age (77.5% for 4 doses). This suggests that on-time vaccination may be an issue for parents with young infants since the coverage rate for 3 doses is higher at 88.8% by 12 months of age, which is much later than the target of 3 doses by 7 months of age. These coverage rates do not meet the national coverage goal of 95% for the first dose of the pertussis vaccine by 3 months of age and for 3 doses of the pertussis vaccine by 7 and 12 months of age.
A significant difference (p = 0.022) between male and female coverage with DTaP was observed at 7 months of age. This shows a change from cNICS 2017 in which there was no significant difference in DTaP coverage at this age (p = 0.289). Although not significant based on the criterion of p < 0.05, the difference in DTaP coverage between males and females at 12 months of age is very close to significance (p = 0.055).
| DTaP coverage at varying age milestones, % (95% CI)Footnote * | |||||
|---|---|---|---|---|---|
| Age (months) | Number of doses | All children | Male | Female | p |
| 3 | ≥ 1 | 91.1 (87.9 – 93.5) | 93.5 (88.9 – 96.3) | 88.3 (83.1 – 92.1) | 0.089 |
| 7 | ≥ 3 | 76.8 (72.3 – 80.8) | 81.5 (75.3 – 86.4) | 71.3 (64.3 – 77.4) | 0.022 |
| 12 | ≥ 3 | 88.8 (85.2 – 91.5) | 91.8 (86.8 – 95.1) | 85.2 (79.5 – 89.5) | 0.055 |
| 24 | ≥ 4 | 77.5 (73.2 – 81.4) | 79.0 (72.7 – 84.2) | 75.5 (69.0 – 81.0) | 0.421 |
Note: Children whose gender was not disclosed by their parent or guardian (n<5) were included in the combined coverage estimates. 95% CI – 95% Confidence Interval (weighted).
|
|||||
Children aged 7 years
The national coverage goal of 95% for all routine vaccinations by 7 years of age has not yet been reached, except for rubella (Table 6). The highest vaccination coverage by 7 years of age was 95.9% for one or more doses of rubella, which requires only one dose for immunity compared to the 2 doses necessary for measles and mumps protectionFootnote 10. Diphtheria, pertussis, and tetanus vaccination coverage for 5 doses or more by age 7 was the lowest at 78.1%. No significant differences were observed between male and female vaccination coverage among 7-year-old children.
| 7-year-old vaccination coverage, % (95% CI)Footnote * | |||||
|---|---|---|---|---|---|
| Antigen | Number of dosesFootnote ‡ | All children | Male | Female | p |
| Diphtheria | ≥ 5 | 78.1 (73.2 – 82.4) | 77.7 (70.8 – 83.3) | 78.4 (71.2 – 84.3) | 0.868 |
| Pertussis | ≥ 5 | 78.1 (73.2 – 82.4) | 77.7 (70.8 – 83.3) | 78.4 (71.2 – 84.3) | 0.868 |
| Tetanus | ≥ 5 | 78.1 (73.2 – 82.4) | 77.7 (70.8 – 83.3) | 78.4 (71.2 – 84.3) | 0.868 |
| Polio | ≥ 4 | 89.3 (85.4 – 92.3) | 88.7 (82.8 – 92.7) | 90.0 (84.4 – 93.7) | 0.701 |
| Haemophilus influenzae type B (Hib) | ≥ 4 | 80.0 (75.2 – 84.1) | 79.7 (72.8 – 85.2) | 80.2 (73.5 – 85.6) | 0.908 |
| Measles | ≥ 2 | 83.3 (78.8 – 87.0) | 83.8 (77.3 – 88.7) | 82.7 (76.1 – 87.7) | 0.784 |
| Mumps | ≥ 2 | 83.1 (78.5 – 86.8) | 83.3 (76.8 – 88.3) | 82.7 (76.1 – 87.7) | 0.874 |
| Rubella | ≥ 1 | 95.9 (93.1 – 97.5) | 96.5 (92.5 – 98.4) | 95.1 (90.7 – 97.5) | 0.540 |
Note: Children whose gender was not disclosed by their parent or guardian (n<5) were included in the combined coverage estimates. 95% CI – 95% Confidence Interval (weighted).
|
|||||
Adolescents aged 14 and 17 years
Currently, 3 routine vaccinations are offered in school-based vaccination programs in Canada. Depending on the jurisdiction, hepatitis B is offered either in infancy or between grades 4 and 7. HPV vaccine is offered between grades 4 and 7, with catch-up programs available in later years in some provinces. Public HPV vaccination programs initially targeted only schoolgirls; however, a gender-neutral policy was gradually adopted until all jurisdictions offered gender-neutral, school-based HPV vaccination programs in 2018/19. A 2-dose schedule of 9vHPV (the nonavalent vaccine) is offered in Grades 4 to 7, except for Quebec which has a 2-dose mixed schedule of 9vHPV and 2vHPV (the bivalent vaccine). The 2019 cNICS cycle measured HPV coverage in both boys and girlsFootnote 11. This is in contrast to cNICS 2017, which only measured HPV coverage in girls since 14-year-old boys surveyed in 2017 would not have had the opportunity to get the vaccine in many jurisdictions. Finally, the Tdap is offered between grades 6 and 9 in most jurisdictions. The national coverage goal for at least one dose of meningococcal, hepatitis B, and a Tdap booster as well as at least 2 doses of HPV vaccine is 90% by 17 years of ageFootnote 2. For the purposes of cNICS 2019, if a 14-year-old had one dose of the HPV vaccine, they were considered as vaccinated. Only the information on whether or not the child had received the HPV vaccine was collected as the number of doses was deemed less reliable because parental knowledge was used. As some provinces and territories request parental consent only once for the entire vaccine series, parents may be unable to specify the number of doses received.
Of the 4 routine vaccines assessed in adolescence, only the Tdap booster met the national coverage goal, with coverage estimated at 95.3% (Table 7). This represented an improvement from cNICS 2017 when coverage for the Tdap booster was lower, at 89.3%, and did not meet the national coverage goal. At 14 years of age, vaccination coverage for at least one dose of the hepatitis B vaccine was slightly higher than coverage for at least one dose of the HPV vaccine at 84.5% and 80.2%, respectively. Coverage rates for HPV vaccination among 14-year-old males (73.0%) were significantly lower (p < 0.0001) than among females (87.1%). This discrepancy is likely because school-based programs for HPV vaccination among males were much more recently introduced than for females. There were no significant differences between males and females for hepatitis B vaccination coverage among 14-year-olds or for Tdap booster vaccination coverage among 17-year-olds.
| Age group (years) | Antigen or vaccine | Number of doses | Vaccination coverage, % (95% CI)Footnote * | |||
|---|---|---|---|---|---|---|
| All children | Male | Female | p | |||
| 14 | Hepatitis BFootnote a | ≥ 1 | 84.5 (82.1 – 86.7) | 83.0 (79.6 – 85.9) | 86.0 (82.3 – 89.0) | 0.202 |
| Human Papillomavirus (HPV) | ≥ 1 | 80.2 (77.7 – 82.6) | 73.0 (69.2 – 76.5) | 87.1 (83.5 – 90.0) | <0.0001 | |
| 17 | Tetanus, diphtheria and acellular pertussis (Tdap) boosterFootnote b | 1 | 95.3 (93.1 – 96.8) | 94.3 (90.8 – 96.6) | 97.0 (94.0 – 98.5) | 0.157 |
| Meningococcal type CFootnote b | 1 | 89.3 (86.3 – 91.7) | 88.0 (83.3 – 91.5) | 90.9 (86.6 – 93.9) | 0.277 | |
Note: Children whose gender was not disclosed by their parent or guardian (n ≤ 5 for 14-year-olds, n = 25 for 17-year-olds) were included in the combined coverage estimates. 95% CI – 95% Confidence Interval (weighted).
|
||||||
The age for a student to consent to receiving a vaccine varies across Canada. In all provinces except Quebec, it is based on whether or not the student is assessed to be a mature minor, i.e., able to understand the risks and benefits of the medical treatment (vaccination) he or she is consenting to, based on the healthcare professional’s judgement. In Quebec, the age of legal consent is fixed by law at 14 years. Parents or guardians of students who are deemed mature minors (or 14-year-olds in Quebec) may not be aware the child was vaccinated, as the information cannot be shared unless the minor provides their permission. Since parents or guardians of school-age children are asked if the child is vaccinated for cNICS, mature minor consent could affect the cNICS study results, resulting in cNICS potentially producing an underestimate of the true vaccination coverage.
HPV vaccination is administered in Grades 6 and 7 in most provinces and territories and Tdap vaccination is generally administered between Grades 7 and 9. In at least half of the jurisdictions in Canada, consent can be given at any age as long as a student is assessed to be a mature minor. Consequently, it is possible for students to consent to the HPV or Tdap vaccine without a parent’s knowledge. The hepatitis B vaccine is provided through either an infant or school-age program depending on the jurisdiction. The hepatitis B coverage estimate reported in Table 7 does not differentiate between those students who were given the hepatitis B vaccine during their infant primary series (less than 2 years of age) and those who were given it as students at school and therefore it may be affected by student consent.
Comparison with previous years
The 2013, 2015, 2017 and 2019 iterations of cNICS used common design and variable definitions making results comparable, except for vaccines for which provincial/ territorial programs changed over the years (hepatitis B, rotavirus, HPV in adolescent girls as the age group in which it was measured changed over years (12–14 years in 2013, 13–14 years in 2015, 14 years in 2017 and 2019) and HPV in adolescent boys as 14-year-old boys surveyed in 2017 would not have had the opportunity to get the vaccine in many jurisdictions). The 2019 cycle of cNICS is the first to use the self-response EQ for data collection. This is hypothesized to increase the accuracy of the data by reducing transcription errors that may have occurred during the telephone interviews in previous cycles. However, impact of this change on coverage point estimates is deemed negligible.
Among children aged 2 and 7 years, vaccination coverage for most routine vaccines has not changed by a large amount from past cycles of this survey. However, among 2-year-olds (Figure 1), an increase in hepatitis B vaccination from 74.1% in 2017 to 83.6% in 2019 and in rotavirus vaccination from 78.8% to 84.5% (not shown) was seen when comparing coverage to cNICS 2017. Rotavirus vaccination coverage was estimated for a 2-dose schedule given at 2 and 4 months in all jurisdictions except New Brunswick, Nova Scotia, and Nunavut. Despite there being no specified national coverage goal for rotavirus, vaccination coverage increased since 2015 when it was lower partly due to the vaccine being relatively new in provincial and territorial schedules. Coverage for meningococcal type C among 2-year-olds also increased from 87.6% in 2017 to 91.1% in 2019.
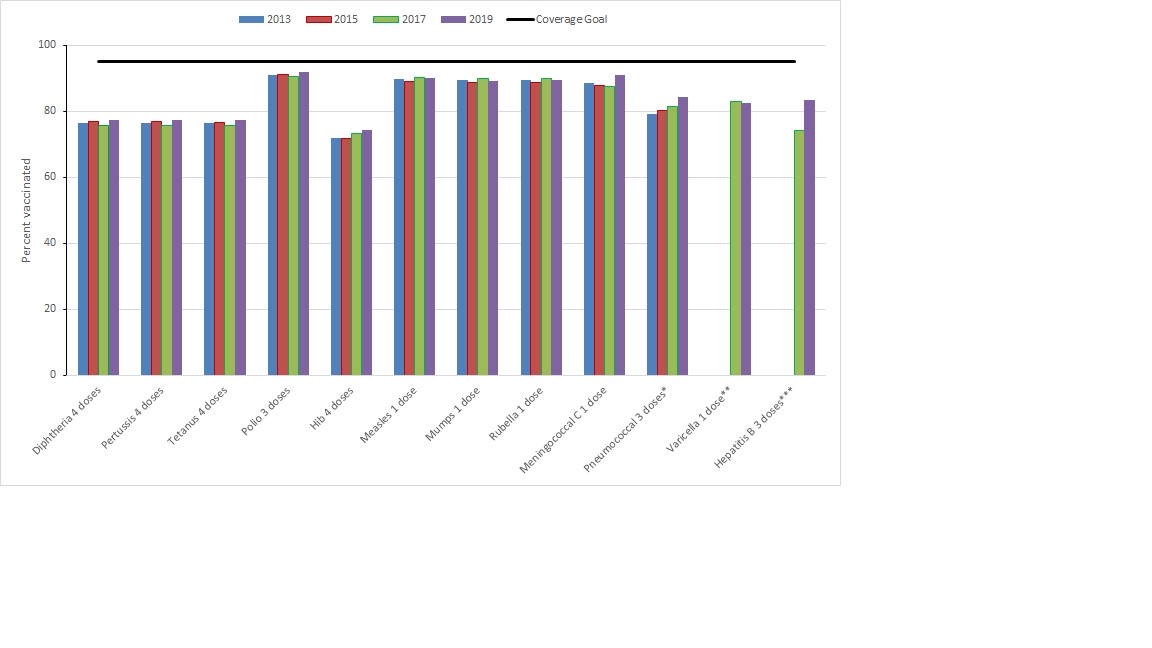
Figure 1 - Text description
* 3 doses by 2nd birthday for all provinces and territories, except Nunavut and Northwest Territories where it is 4 doses by 2nd birthday
** Data for the varicella vaccine is not shown for 2013 and 2015 due to data quality concerns
*** Limited to jurisdictions where a 3-dose program for infants was in place (British Columbia, Québec, New Brunswick, Prince Edward Island, Yukon, Northwest Territories, and Nunavut)
| Routine vaccines | 2013 | 2015 | 2017 | 2019 | Coverage Goal |
|---|---|---|---|---|---|
| Diphtheria 4 doses | 77 | 77 | 76 | 78 | 95 |
| Pertussis 4 doses | 76 | 77 | 76 | 78 | 95 |
| Tetanus 4 doses | 76 | 77 | 76 | 78 | 95 |
| Polio 3 doses | 91 | 91 | 91 | 92 | 95 |
| Hib 4 doses | 72 | 72 | 73 | 74 | 95 |
| Measles 1 dose | 90 | 89 | 90 | 90 | 95 |
| Mumps 1 dose | 89 | 89 | 90 | 89 | 95 |
| Rubella 1 dose | 89 | 89 | 90 | 89 | 95 |
| Meningococcal C 1 dose | 89 | 88 | 88 | 91 | 95 |
| Pneumococcal 3 doses* | 79 | 80 | 81 | 84 | 95 |
| Varicella 1 dose** | 83 | 83 | 95 | ||
| Hepatitis B 3 doses*** | 74 | 84 | 95 |
Furthermore, among 7-year-olds (Figure 2), despite changes by a few percentage points, no significant difference were observed in vaccination coverage from 2017 to 2019 for all antigens.
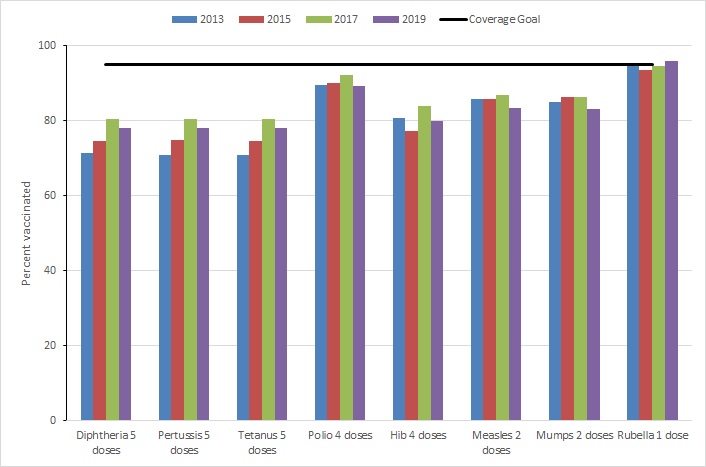
Figure 2 - Text description
| Routine vaccines | 2013 | 2015 | 2017 | 2019 | Coverage Goal |
|---|---|---|---|---|---|
| Diphtheria 5 doses | 71 | 75 | 80 | 78 | 95 |
| Pertussis 5 doses | 71 | 75 | 80 | 78 | 95 |
| Tetanus 5 doses | 71 | 75 | 80 | 78 | 95 |
| Polio 4 doses | 90 | 90 | 92 | 89 | 95 |
| Hib 4 doses | 81 | 77 | 84 | 80 | 95 |
| Measles 2 doses | 86 | 86 | 87 | 83 | 95 |
| Mumps 2 doses | 85 | 86 | 86 | 83 | 95 |
| Rubella 1 dose | 95 | 94 | 95 | 96 | 95 |
In 14-year-olds (Figure 3), cNICS 2019 provided the first estimates of HPV coverage among males at 73.0%. Coverage in females was higher at 87.1%. Finally, among 17-year-olds, coverage for the Tdap booster increased from 89.3% in 2017 to 95.3% in 2019, meeting the national coverage goal of 90%.
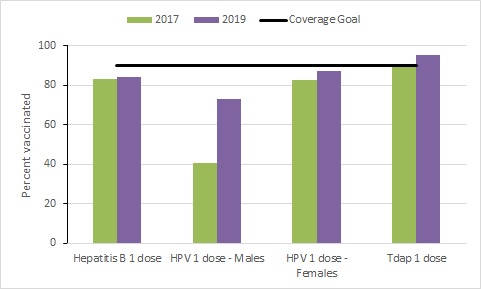
Figure 3 - Text description
| Routine vaccines | 2017 | 2019 | Coverage Goal |
|---|---|---|---|
| Hepatitis B 1 dose | 83 | 85 | 90 |
| HPV 1 dose - Males | 41 | 73 | 90 |
| HPV 1 dose - Females | 83 | 87 | 90 |
| Tdap 1 dose | 89 | 95 | 90 |
Proportion of unvaccinated children by age group
Parents or guardians of all children surveyed, regardless of vaccination booklet availability, were asked whether the child had ever been vaccinated with any vaccine (Table 8). The 2019 cNICS survey showed that nationally, 1.66% of 2-year-old children had not received any vaccine. This is not significantly different from the proportion of unvaccinated 2-year-old Canadians reported in cNICS 2017, which was 2.35% (95% CI: 1.76% - 2.93%)Footnote 12. In 2019, cNICS results showed that 1.47% of 17-year-olds had not received any vaccine. Data on the proportion of unvaccinated 7-year-olds was suppressed for confidentiality reasons. The proportion of unvaccinated 14-year-olds was estimated at <1%; this proportion could not be reported with more precision due to confidentiality reasons.
| Age (years) | Unvaccinated, % (95% CI)Footnote * |
|---|---|
2 |
1.66 (0.81 – 3.37) |
7 |
|
14 |
<1%Footnote b |
17 |
1.47 (0.74 – 2.93) |
95% CI – 95% Confidence Interval (weighted).
|
|
Strengths and limitations
The cNICS has several strengths and limitations that must be considered when interpreting the results of the survey.
Strengths
- cNICS used random sampling from a comprehensive sampling frame, the Canada Child Benefit, which is believed to include 96% of Canadian children, allowing for a representative sample to be collected on a national level.
- cNICS estimated vaccination coverage at the national level in a consistent manner despite differences in provincial/territorial vaccination schedules and program delivery.
- The overall response rate for the childhood vaccination coverage component of cNICS 2019 was 54.5%. Although not optimal, the response rate was much higher than comparable surveys conducted by the United States Centers for Disease Control and Prevention, which were 21.1% for the 2019 National Immunization Survey (NIS)-Child, conducted among children aged 19-35 months, and 19.7% for the 2019 NIS-Teen, conducted among adolescents aged 13-17 yearsFootnote 13Footnote 14.
- The 2019 cycle of cNICS is the first to use the self-response EQ for data collection. This is hypothesized to increase the accuracy of the data by reducing transcription errors that may have occurred during the telephone interviews in previous cycles.
- The 2019 cycle of cNICS is also the first to ask for gender of the PMK and child rather than sex, promoting inclusivity and accuracy in data collection.
- For the 2019 cycle, in contrast to past cycles of the survey, only one set of weights was calculated for each of the samples (children and mothers) included in cNICS. In previous survey cycles, 2 survey weights were made available: one weight to estimate vaccination coverage and another weight to analyze parents’ and guardians’ knowledge, attitudes and beliefs with respect to immunization. A study was conducted using cNICS 2017 data to determine if survey estimates would be statistically different by using a single weight instead of 2 weights and the results showed that the estimates would not be significantly different. Thus, beginning with the cNICS 2019 cycle, only one series of weights will be produced, resulting in a more user-friendly product and simplifying the work for analystsFootnote 4.
Limitations
- Although the overall response rate for the childhood vaccination coverage component of cNICS 2019 was comparatively very good at 54.5%, it is less optimal than obtaining more complete coverage information from provincial and territorial immunization registries.
- Interviews were conducted in English or French, excluding children with parents that are not fluent in either official language. This subpopulation of children may have differences in vaccination coverage and access or utilization of healthcare services from that of other Canadian children.
- A large proportion (36.8%) of cNICS data was collected from parent-held vaccination records, in which some information may be incomplete, erroneous, or missing altogether. This may lead to an underestimation in vaccination coverage, especially among vaccines delivered in schools such as Tdap, HPV, and hepatitis B. In most cases, a child who does not bring their vaccination record to school on vaccination day will still be vaccinated, but the dose received will not be directly recorded in their card or booklet. This may not be recorded in their healthcare record either. Moreover, there may have been some errors in collecting data from vaccination cards or booklets. Vaccinations recorded with missing or illegible information, especially the date, cannot be counted.
- Some changes were made to the methodology in cNICS 2017 to mitigate the systematic under-reporting of vaccine doses observed in cNICS 2011, 2013 and 2015. These changes were kept for cNICS 2019. Therefore, most coverage estimates from cNICS 2019 are comparable to those from cNICS 2017. Caution is advised when comparing with coverage estimates from previous iterations of cNICS, as apparent differences in estimates are likely to reflect changes in methodology rather than true changes in vaccination coverage.
- The 2019 cycle of cNICS is the first iteration to use web-based data collection via the self-response EQ. This could also hinder comparability with previous cycles of cNICS which utilized the CATI wherein interviewers recorded respondents’ answers to the survey questions.
- In the 2019 cNICS, respondents were asked about their gender and the gender of the child. This is in contrast to previous cycles of cNICS in which data was collected on sex rather than gender. This change in data collection may further reduce comparability between cNICS 2019 and prior cycles of the survey, however, this is not expected to make a difference in the 2-year-old group.
- Similar to many other Statistics Canada surveys, cNICS excluded First Nations on-reserve communities, children in foster care, and institutionalized children.
Conclusion
Most of the national vaccination coverage estimates reported in cNICS 2019 failed to meet the corresponding national vaccination coverage goals, except for one or more doses of the rubella vaccine among 7-year-olds and the Tdap booster among 17-year-olds. Among children aged 2 and 7 years old, vaccination coverage for most routine vaccines has not changed by a large amount from past cycles of this survey. However, among 2-year-olds, an increase in hepatitis B vaccination from 74.1% in 2017 to 83.6% in 2019 and in rotavirus vaccination from 78.8% to 84.5% was seen when comparing coverage to cNICS 2017. Coverage for meningococcal type C among 2-year-olds also increased from 87.6% in 2017 to 91.1% in 2019. Furthermore, among 7-year-olds, no significant difference were observed in vaccination coverage from 2017. In 14-year-olds, cNICS 2019 provided the first estimates of HPV coverage among males at 73.0%. Coverage in females was higher at 87.1%. Finally, among 17-year-olds, coverage for the Tdap booster increased from 89.3% in 2017 to 95.3% in 2019, meeting the national coverage goal of 90%.
Vaccination coverage estimates were analysed by gender throughout all age groups. Statistically significant vaccination coverage differences between male and female children have not been observed in past cycles of cNICS, except for the DTaP vaccine in 7-year-old children in cNICS 2017Footnote 15. In cNICS 2019, statistically significant vaccination coverage differences between male and female children were observed for rotavirus among 2-year-olds, DTaP at 7 months of age, and HPV among 14-year-olds. It is not expected that parents or guardians would make different vaccination decisions based on the gender of the child; however, this may be the case for the HPV vaccine, which was previously only offered to girls through school-based programs. The mistaken over-identification of HPV as a female-specific disease and the delay in adoption of school-based HPV vaccination programs for males may have contributed to the “feminization of HPV”, thus affecting vaccination uptake for malesFootnote 16. Continued monitoring of this matter may be warranted, as it “feminization of HPV”, thus affecting vaccination uptake for malesFootnote 16. Continued monitoring of this matter may be warranted, as it could provide additional targets for vaccination campaigns and policy.
Known methodological limitations of cNICS is likely to have caused an underestimation of coverage. Therefore, it is likely that vaccination coverage in Canada is higher than the estimates presented in this report for all age groups. Statistics Canada continues to work alongside the Public Health Agency of Canada to improve the collection methods of cNICS.
Data from the cNICS surveys are essential for monitoring vaccination coverage at the national level in Canada. Results from cNICS 2019 suggest that there continues to be a need for improvement in vaccination coverage in order to attain sufficient community protection within the population to prevent disease and outbreaks. In addition to providing more recent coverage estimates, the 2022 cNICS data will allow for the assessment of the COVID-19 pandemic impact on routine childhood vaccination at the national level.
References
- Footnote 1
-
Duclos P. Vaccination coverage of 2-year-old children and immunization practices-Canada, 1994. Vaccine. 1997;15(1):20-24. doi: 10.1016/s0264-410x(96)00122-3.
- Footnote 2
-
Public Health Agency of Canada. Vaccination coverage goals and vaccine preventable disease reduction targets by 2025. www.canada.ca/en/public-health/services/immunization-vaccine-priorities/national-immunization-strategy/vaccination-coverage-goals-vaccine-preventable-diseases-reduction-targets-2025.html Updated 2021. Accessed 06/10, 2021.
- Footnote 3
-
World Health Organization. Global vaccine action plan 2011–2020. www.who.int/publications/i/item/global-vaccine-action-plan-2011-2020. Published 2013. Accessed 06/16, 2021.
- Footnote 4
-
Statistics Canada. Childhood national immunization coverage survey (CNICS). www23.statcan.gc.ca/imdb/p2SV.pl?Function=getSurvey&Id=1257279. Updated 2019. Accessed 06/16, 2021.
- Footnote 5
-
Statistics Canada. Childhood national immunization coverage survey (CNICS). www.statcan.gc.ca/eng/survey/household/5185. Updated 2019. Accessed 06/16, 2021.
- Footnote 6
-
Rust KF, Rao JN. Variance estimation for complex surveys using replication techniques. Stat Methods Med Res. 1996;5(3):283-310. doi: 10.1177/096228029600500305.
- Footnote 7
-
Public Health Agency of Canada. Provincial and territorial routine and catch-up vaccination schedule for infants and children in Canada. www.canada.ca/en/public-health/services/provincial-territorial-immunization-information/provincial-territorial-routine-vaccination-programs-infants-children.html Updated 2021. Accessed 06/16, 2021.
- Footnote 8
-
National Advisory Committee on Immunization (NACI). An advisory committee statement (ACS) update National Advisory Committee on Immunization (NACI): Statement on rotavirus vaccines and intussusception. www.healthycanadians.gc.ca/publications/healthy-living-vie-saine/statement-rotavirus-vaccines-intussusception-2016-declaration-vaccins-antirotavirus-intussusception/alt/Stmt_NACI_Rotavirus%20Vaccines_EN_WebPosting_Apr%202016.pdf. Published April 2016.
- Footnote 9
-
Public Health Agency of Canada. Pertussis (whooping cough): for health professionals. www.canada.ca/en/public-health/services/immunization/vaccine-preventable-diseases/pertussis-whooping-cough/health-professionals.html Updated 2020. Accessed 06/16, 2021.
- Footnote 10
-
Public Health Agency of Canada. Rubella vaccine: Canadian immunization guide. www.canada.ca/en/public-health/services/publications/healthy-living/canadian-immunization-guide-part-4-active-vaccines/page-20-rubella-vaccine.html Updated 2019. Accessed 06/16, 2021.
- Footnote 11
-
Goyette A, Yen GP, Racovitan V, Bhangu P, Kothari S, & Franco EL. Evolution of Public Health Human Papillomavirus Immunization Programs in Canada. Current Oncology 2021; 28(1), 991-1007. doi: 10.3390/curroncol28010097.
- Footnote 12
-
Public Health Agency of Canada. Vaccine Coverage in Canadian Children: Results from the 2017 Childhood National Immunization Coverage Survey (cNICS). www.canada.ca/en/public-health/services/publications/healthy-living/2017-vaccine-uptake-canadian-children-survey.html. Updated 2020. Accessed 08/10, 2021.
- Footnote 13
-
Hill HA, Yankey D, Elam-Evans LD, Singleton JA, Pingali SC, Santibanez TA. Vaccination Coverage by Age 24 Months Among Children Born in 2016 and 2017 — National Immunization Survey-Child, United Sates, 2017-2019. MMWR Morb Mortal Wkly Rep 2020;69:1505-1511. doi: 10.15585/mmwr.mm6942a1.
- Footnote 14
-
Elam-Evans LD, Yankey D, Singleton JA, et al. National, Regional, State, and Selected Local Area Vaccination Coverage Among Adolescents Aged 13-17 Years — United States, 2019. MMWR Morb Mortal Wkly Rep 2020;69:1109-1116. doi: 10.15585/mmwr.mm6933a1.
- Footnote 15
-
Gilbert NL, Gilmour H, Wilson SE, Cantin L. Determinants of non-vaccination and incomplete vaccination in canadian toddlers. Hum Vaccin Immunother. 2017;13(6): 1447-1453. doi: 10.1080/21645515.2016.1277847.
- Footnote 16
-
Daley EM, Vamos CA, Thompson EL, Zimet GD, Rosberger Z, Merrell L, Kline N. The feminization of HPV: How science, politics, economics and gender norms shaped U.S. HPV vaccine implementation. Papillomavirus Research. 2017; 3:142-148. 10.1016/j.pvr.2017.04.004.