
Report 3 figures and tables: Economic Burden of Illness in Canada, 2005–2008
Report 3: EBIC Physician Care Expenditures, 2005-2008
Figures and Tables
| Diagnostic Category | 2008 Cost | % of 2008 Cost | 2007 Cost | % of 2007 Cost | 2006 Cost | % of 2006 Cost | 2005 Cost | % of 2005 Cost |
|---|---|---|---|---|---|---|---|---|
| Certain Infectious and Parasitic Diseases | 509.3 | 2.1 | 470.1 | 2.2 | 436.5 | 2.2 | 408.4 | 2.2 |
| Respiratory Infections | 1,125.2 | 4.7 | 1,042.1 | 4.8 | 1,018.7 | 5.1 | 1,003.9 | 5.4 |
| Maternal Conditions | 792.1 | 3.3 | 723.2 | 3.4 | 656.3 | 3.3 | 611.3 | 3.3 |
| Perinatal Conditions | 42.0 | 0.2 | 36.3 | 0.2 | 35.7 | 0.2 | 29.9 | 0.2 |
| Nutritional Deficiencies | 158.0 | 0.7 | 137.4 | 0.6 | 124.2 | 0.6 | 106.1 | 0.6 |
| Malignant Neoplasms | 1,031.7 | 4.3 | 924.6 | 4.3 | 789.5 | 3.9 | 732.2 | 3.9 |
| Other Neoplasms | 484.0 | 2.0 | 435.8 | 2.0 | 373.8 | 1.9 | 347.8 | 1.9 |
| Diabetes Mellitus | 487.3 | 2.0 | 444.0 | 2.1 | 404.2 | 2.0 | 377.1 | 2.0 |
| Endocrine Disorders | 587.5 | 2.5 | 529.5 | 2.5 | 483.1 | 2.4 | 443.2 | 2.4 |
| Neuropsychiatric Conditions | 2,347.0 | 9.9 | 2,167.3 | 10.1 | 2,047.4 | 10.2 | 1,842.1 | 9.9 |
| Sense Organ Diseases | 1,329.3 | 5.6 | 1,248.3 | 5.8 | 1,169.8 | 5.8 | 1,073.7 | 5.8 |
| Cardiovascular Diseases | 2,352.0 | 9.9 | 2,128.7 | 9.9 | 1,974.7 | 9.9 | 1,861.4 | 10.0 |
| Respiratory Diseases | 632.6 | 2.7 | 581.3 | 2.7 | 569.8 | 2.8 | 565.9 | 3.0 |
| Digestive Diseases | 1,232.6 | 5.2 | 1,125.0 | 5.2 | 1,071.2 | 5.3 | 977.8 | 5.3 |
| Genitourinary Diseases | 1,626.4 | 6.8 | 1,484.5 | 6.9 | 1,403.0 | 7.0 | 1,263.9 | 6.8 |
| Skin Diseases | 833.1 | 3.5 | 744.5 | 3.5 | 687.8 | 3.4 | 618.4 | 3.3 |
| Musculoskeletal Diseases | 2,002.5 | 8.4 | 1,804.8 | 8.4 | 1,682.4 | 8.4 | 1,539.5 | 8.3 |
| Congenital Anomalies | 139.0 | 0.6 | 125.8 | 0.6 | 112.5 | 0.6 | 104.2 | 0.6 |
| Oral Conditions | 214.1 | 0.9 | 196.8 | 0.9 | 189.7 | 0.9 | 178.5 | 1.0 |
| Injuries | 1,435.0 | 6.0 | 1,304.7 | 6.1 | 1,204.1 | 6.0 | 1,151.9 | 6.2 |
| Symptoms, Signs and Ill-Defined Conditions | 1,846.1 | 7.8 | 1,623.4 | 7.5 | 1,543.2 | 7.7 | 1,426.6 | 7.7 |
| Factors Influencing Health and Contact with Health Services | 2,573.7 | 10.8 | 2,276.1 | 10.6 | 2,069.1 | 10.3 | 1,892.4 | 10.2 |
| Total EBIC Physician Care Expenditures | 23,780.3 | 100.0 | 21,554.3 | 100.0 | 20,046.9 | 100.0 | 18,556.2 | 100.0 |
| Unattributable Physician Care ExpendituresTable 8 - Footnote 1 | 0.0 | 0.0 | 0.0 | 0.0 | 0.0 | 0.0 | 0.0 | 0.0 |
| Total Physician Care ExpendituresTable 8 - Footnote 2 | 23,780.3 | 100.0 | 21,554.3 | 100.0 | 20,046.9 | 100.0 | 18,556.2 | 100.0 |
Footnotes:
|
||||||||
| Diagnostic Category | 2008 Male Cost | % of Total Cost | 2008 Female Cost | % of Total Cost | Total Cost |
|---|---|---|---|---|---|
| Certain Infectious and Parasitic Diseases | 184.5 | 36.2 | 324.8 | 63.8 | 509.3 |
| Respiratory Infections | 501.8 | 44.6 | 623.4 | 55.4 | 1,125.2 |
| Maternal Conditions | 792.1 | 100.0 | 792.1 | ||
| Perinatal Conditions | 22.1 | 52.6 | 19.9 | 47.4 | 42.0 |
| Nutritional Deficiencies | 53.8 | 34.0 | 104.2 | 66.0 | 158.0 |
| Malignant Neoplasms | 525.5 | 50.9 | 506.3 | 49.1 | 1,031.7 |
| Other Neoplasms | 177.4 | 36.7 | 306.6 | 63.3 | 484.0 |
| Diabetes Mellitus | 250.2 | 51.4 | 237.1 | 48.6 | 487.3 |
| Endocrine Disorders | 223.8 | 38.1 | 363.7 | 61.9 | 587.5 |
| Neuropsychiatric Conditions | 937.2 | 39.9 | 1,409.8 | 60.1 | 2,347.0 |
| Sense Organ Diseases | 562.0 | 42.3 | 767.3 | 57.7 | 1,329.3 |
| Cardiovascular Diseases | 1,248.1 | 53.1 | 1,103.9 | 46.9 | 2,352.0 |
| Respiratory Diseases | 304.9 | 48.2 | 327.7 | 51.8 | 632.6 |
| Digestive Diseases | 572.6 | 46.5 | 660.0 | 53.5 | 1,232.6 |
| Genitourinary Diseases | 512.7 | 31.5 | 1,113.7 | 68.5 | 1,626.4 |
| Skin Diseases | 387.3 | 46.5 | 445.8 | 53.5 | 833.1 |
| Musculoskeletal Diseases | 822.1 | 41.1 | 1,180.4 | 58.9 | 2,002.5 |
| Congenital Anomalies | 74.8 | 53.8 | 64.2 | 46.2 | 139.0 |
| Oral Conditions | 95.7 | 44.7 | 118.4 | 55.3 | 214.1 |
| Injuries | 729.7 | 50.9 | 705.3 | 49.1 | 1,435.0 |
| Symptoms, Signs and Ill-Defined Conditions | 789.4 | 42.8 | 1,056.7 | 57.2 | 1,846.1 |
| Factors Influencing Health and Contact with Health Services | 855.3 | 33.2 | 1,718.4 | 66.8 | 2,573.7 |
| Total EBIC Physician Care Expenditures | 9,830.8 | 41.3 | 13,949.5 | 58.7 | 23,780.3 |
| Notes: Physician care expenditures by sex can be determined only for attributable EBIC physician care expenditures. Any discrepancies may be due to rounding. |
|||||
| Diagnostic Category | EBIC 2000 Manitoba (%) A |
EBIC 2000 Ontario (%) B |
Difference (%) (A-B) |
|---|---|---|---|
| Certain Infectious and Parasitic Diseases | 2.8 | 2.9 | -0.1 |
| Respiratory Infections | 7.7 | 6.8 | 0.9 |
| Maternal Conditions | 3.3 | 2.5 | 0.8 |
| Perinatal Conditions | 0.2 | 0.3 | -0.1 |
| Nutritional Deficiencies | 0.3 | 0.4 | -0.1 |
| Malignant Neoplasms | 3.2 | 3.6 | -0.3 |
| Other Neoplasms | 1.6 | 1.5 | 0.1 |
| Diabetes Mellitus | 2.0 | 1.8 | 0.1 |
| Endocrine Disorders | 2.4 | 2.0 | 0.4 |
| Neuropsychiatric Conditions | 9.5 | 16.0 | -6.5 |
| Sense Organ Diseases | 6.5 | 8.0 | -1.5 |
| Cardiovascular Diseases | 10.1 | 10.6 | -0.5 |
| Respiratory Diseases | 5.1 | 3.1 | 1.9 |
| Digestive Diseases | 6.1 | 4.1 | 2.0 |
| Genitourinary Diseases | 7.4 | 6.3 | 1.1 |
| Skin Diseases | 4.1 | 3.7 | 0.4 |
| Musculoskeletal Diseases | 8.6 | 7.0 | 1.5 |
| Congenital Anomalies | 0.5 | 0.3 | 0.3 |
| Oral Conditions | 0.6 | 0.4 | 0.2 |
| Injuries | 9.4 | 6.7 | 2.6 |
| Symptoms, Signs and Ill-Defined Conditions | 8.6 | 11.5 | -3.0 |
| Factors Influencing Health and Contact with Health Services | - | 0.3 | - |
| Notes: The EBIC 2000 physician care expenditures were available by ICD code. The cost totals used to estimate the cost distributions included in this table were obtained using the EBIC 2005-2008 diagnostic category ICD code groupings. Any discrepancies may be due to rounding. |
|||
| Diagnostic Category | Estimated Manitoba 2008 using EBIC 2000 Manitoba Data (%) A |
Manitoba 2008 Data from Manitoba Annual Statistics (%) B |
Difference (%) (A-B) |
|---|---|---|---|
| Certain Infectious and Parasitic Diseases | 2.6 | 2.1 | 0.5 |
| Respiratory Infections | 7.3 | 4.7 | 2.6 |
| Maternal Conditions | 3.1 | 3.3 | -0.2 |
| Perinatal Conditions | 0.2 | 0.2 | 0.0 |
| Nutritional Deficiencies | 0.3 | 0.7 | -0.4 |
| Malignant Neoplasms | 3.3 | 4.4 | -1.1 |
| Other Neoplasms | 1.7 | 2.0 | -0.3 |
| Diabetes Mellitus | 2.0 | 2.0 | 0.0 |
| Endocrine Disorders | 2.5 | 2.5 | 0.0 |
| Neuropsychiatric Conditions | 9.6 | 9.9 | -0.3 |
| Sense Organ Diseases | 6.5 | 5.5 | 1.0 |
| Cardiovascular Diseases | 10.4 | 9.9 | 0.5 |
| Respiratory Diseases | 5.0 | 2.7 | 2.3 |
| Digestive Diseases | 6.2 | 5.1 | 1.1 |
| Genitourinary Diseases | 7.5 | 6.8 | 0.7 |
| Skin Diseases | 4.1 | 3.5 | 0.6 |
| Musculoskeletal Diseases | 8.8 | 8.4 | 0.4 |
| Congenital Anomalies | 0.5 | 0.6 | -0.1 |
| Oral Conditions | 0.6 | 1.0 | -0.4 |
| Injuries | 9.3 | 6.0 | 3.3 |
| Symptoms, Signs and Ill-Defined Conditions | 8.5 | 7.8 | 0.7 |
| Factors Influencing Health and Contact with Health Services | - | 11.0 | - |
| Notes: The EBIC 2000 physician care expenditures were available by ICD code. The cost totals used to estimate the cost distributions included in this table were found using the EBIC 2005-2008 diagnostic category ICD code groupings. Any discrepancies may be due to rounding. |
|||
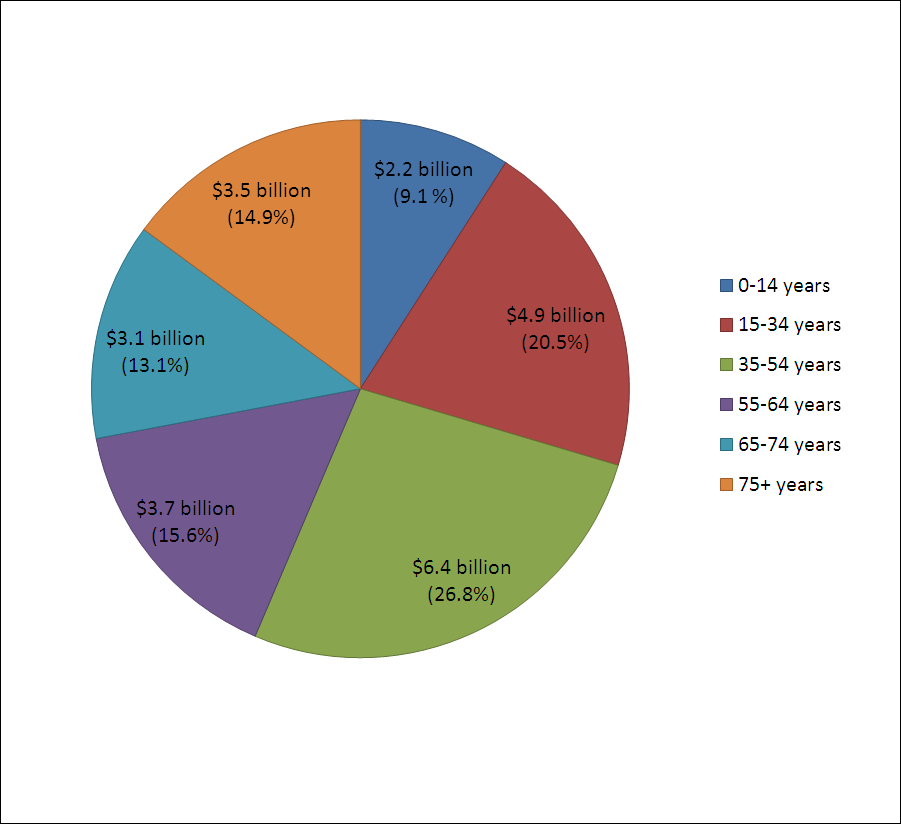
Figure 18: Physician Care Expenditures by Age Group, Canada, 2008

Note: Any discrepancies may be due to rounding.
Text Equivalent - Figure 18
| Age Group | Physician Care Expenditures (in billions) | Percentage of Total Physician Care Expenditures |
|---|---|---|
| 0-14 years | 2.2 | 9.1 |
| 15-34 years | 4.9 | 20.5 |
| 35-54 years | 6.4 | 26.8 |
| 55-64 years | 3.7 | 15.6 |
| 65-74 years | 3.1 | 13.1 |
| 75+ years | 3.5 | 14.9 |
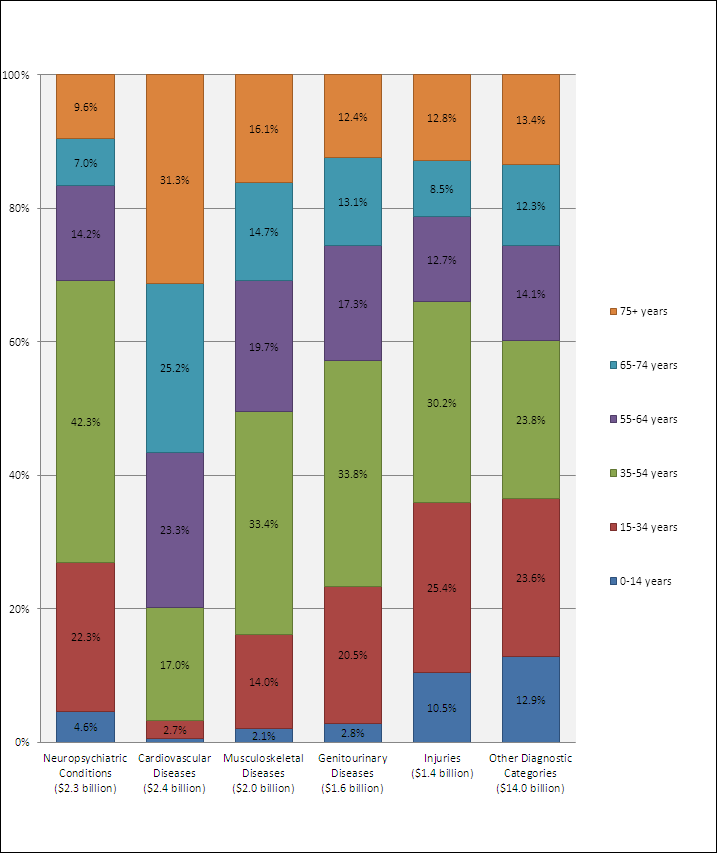
Figure 19: Physician Care Expenditure Distribution by Diagnostic Category and Age Group, Canada, 2008

Notes: Individuals aged 0-14 years have an attributable cost of 0.5% for cardiovascular diseases; this numeric value is represented but not displayed in the figure. 'Other Diagnostic Categories' include the costs from all other EBIC diagnostic categories not individually displayed in the figure. Any discrepancies may be due to rounding.
Text Equivalent - Figure 19
| Diagnostic Category | Percentage of Costs Attributed to Age Group 0-14 years | Percentage of Costs Attributed to Age Group 15-34 years | Percentage of Costs Attributed to Age Group 35-54 years | Percentage of Costs Attributed to Age Group 55-64 years | Percentage of Costs Attributed to Age Group 65-74 years | Percentage of Costs Attributed to Age Group 75+ years |
|---|---|---|---|---|---|---|
| Neuropsychiatric Conditions ($2.3 billion) |
4.6 | 22.3 | 42.3 | 14.2 | 7.0 | 9.6 |
| Cardiovascular Diseases ($2.4 billion) |
0.5 | 2.7 | 17.0 | 23.3 | 25.2 | 31.3 |
| Musculoskeletal Diseases ($2.0 billion) |
2.1 | 14.0 | 33.4 | 19.7 | 14.7 | 16.1 |
| Genitourinary Diseases ($1.6 billion) |
2.8 | 20.5 | 33.8 | 17.3 | 13.1 | 12.4 |
| Injuries ($1.4 billion) |
10.5 | 25.4 | 30.2 | 12.7 | 8.5 | 12.8 |
| Other Diagnostic Categories ($14.0 billion) |
12.9 | 23.6 | 23.8 | 14.1 | 12.3 | 13.4 |
Page details
- Date modified: