
Human emerging respiratory pathogens bulletin: Issue 35, November 2019
Download the alternative format
(PDF format, 1.3 MB, 2 pages)
Monthly situational analysis of emerging respiratory diseases affecting humans (data to November 30, 2019)
In this bulletin
| Novel influenzaFootnote 1 | Cumulative Case CountFootnote 2 | Deaths | Case Fatality Rate %Footnote 3 |
|---|---|---|---|
| A(H7N9) | 1,568 | 615 | 39% |
| A(H5N1) | 879 | 461 | 52% |
| A(H9N2) | 53 | 1 | <1% |
| A(H5N6) | 24 | 7 | 29% |
| A(H7N4) | 1 | 0 | 0% |
| A(H1N2)Footnote 4 | 2 | 0 | 0% |
| A(H3N2)v | 435 | 1 | <1% |
| A(H1N2)v | 26 | 0 | 0% |
| A(H1N1)v | 23 | 0 | 0% |
| MERS-CoVFootnote 1 | Cumulative Case CountFootnote 2 | Deaths | Case Fatality Rate %Footnote 3 |
| Global Case Count | 2,494 | 855 | 34% |
| Saudi Arabia | 2,120 | 777 | 37% |
Avian influenza updates
Avian influenza A(H7N9)
No new H7N9 cases were reported to the WHO in November 2019.The last case was reported in April 2019. A total of 1568 human cases of avian influenza A(H7N9), including at least 615 deaths, have been reported globally since 2013, with one case reported in wave 7 (November1, 2018 to September 30, 2019) (Figure 1). Two travel-related cases were reported in Canada in January 2015.
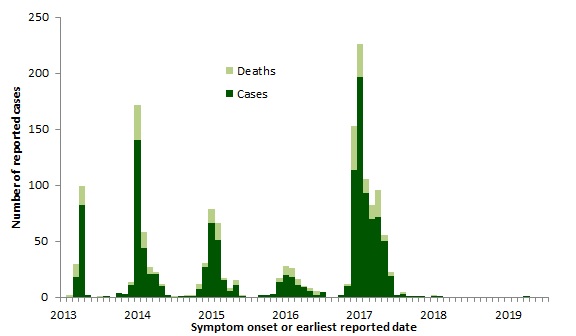
Note: Graph was prepared by the Centre for Immunization and Respiratory Infectious Diseases (CIRID) using data from the latest WHO Monthly Influenza at the Human-Animal Interface Risk Assessment. This graph reflects data available through these risk assessments as of November 30, 2019.
Figure 1 - Text Description
| Year | Month | Cases | Deaths |
|---|---|---|---|
| 2016 | Jun | 2 | 0 |
| Jul | 4 | 0 | |
| Aug | 0 | 0 | |
| Sep | 0 | 0 | |
| Oct | 2 | 0 | |
| Nov | 10 | 2 | |
| Dec | 114 | 39 | |
| 2017 | Jan | 197 | 29 |
| Feb | 93 | 13 | |
| Mar | 70 | 12 | |
| Apr | 72 | 24 | |
| May | 50 | 6 | |
| Jun | 19 | 4 | |
| Jul | 2 | 0 | |
| Aug | 3 | 2 | |
| Sep | 1 | 0 | |
| Oct | 0 | 0 | |
| Nov | 0 | 0 | |
| Dec | 1 | 0 | |
| 2018 | Jan | 1 | 1 |
| Feb | 1 | 0 | |
| Mar | 0 | 0 | |
| Apr | 0 | 0 | |
| May | 0 | 0 | |
| Jun | 0 | 0 | |
| Jul | 0 | 0 | |
| Aug | 0 | 0 | |
| Sep | 0 | 0 | |
| Oct | 0 | 0 | |
| Nov | 0 | 0 | |
| Dec | 0 | 0 | |
| 2019 | Jan | 0 | 0 |
| Feb | 0 | 0 | |
| Mar | 0 | 0 | |
| Apr | 1 | 0 | |
| May | 0 | 0 | |
| Jun | 0 | 0 | |
| Jul | 0 | 0 | |
| Aug | 0 | 0 | |
| Sept | 0 | 0 | |
| Oct | 0 | 0 | |
| Nov | 0 | 0 |
The temporal distribution of avian influenza A(H7N9), globally, January 1st, 2013 – November 30, 2019, has been displayed in Figure 1. The highest number of reports occurred in 2017, with a peak in January. Three cases were reported in 2018 and one case has been reported in 2019 so far.
Avian influenza A(H5N1)
No new H5N1 cases were reported to the WHO in November 2019. The most recent case of H5N1 was reported in March 25, 2019 in Nepal. A total of 879 cases including 461 deaths have been reported globally since 1997. One fatal travel-related case of H5N1 was reported in Canada in January 2014.
Avian influenza A(H5N6)
No new cases of H5N6 were reported to the WHO in November 2019. The most recent case of H5N6 was reported in China in August 2019. There have been a total of 24 cases, including 7 deaths, reported globally since 2014, all in China.
Avian influenza A(H9N2)
The National Health Commission of China notified the WHO of 2 new cases of H9N2 on November 12 and 22 2019. The first case is a 4-year-old female from Fujian, China with symptom onset on October 26, 2019. The second case is a 5-year-old female from Anhui, China with symptom onset on November 12, 2019. Both cases had a history of poultry exposure. No additional cases have been detected via contact tracing, however close contacts are under observation. The two cases have recovered. Prior to these cases, the most recent case of H9N2 was reported in March 2019 in China. Globally, 53 cases, including one death, have been reported since 1998.
Avian influenza A(H7N4)
No new cases of H7N4 were reported to the WHO in November 2019. On February 14, 2018, the WHO was notified of the first known human case of H7N4. The case was associated with poultry exposure. No cases have been reported since.
Swine influenza updates
Swine origin influenza A(H3N2)v
The most recent case of swine origin influenza H3N2v was reported in June 2018 in the United States. The case reported exposure to swine at an agricultural fair. A total of 435 cases, including 1 death, have been reported globally since 2011. One locally-acquired case of H3N2v was reported in Canada in December 2016.
Swine origin influenza A(H1N2)v
The most recent case of swine origin influenza H1N2v was reported in August 2018 in the United States. The case reported exposure to swine at an agricultural fair. A total of 26 confirmed cases of H1N2v have been reported in the United States since 2005. Most of the reported cases resulted in mild illness.
Swine origin influenza A(H1N1)v
The most recent case of swine origin influenza H1N1v was reported in May 2019 in the United States. The case was over 65 years, had no history of swine exposure, and has fully recovered. A total of 23 cases have been reported globally since 2005. To date, the reported H1N1v infections have been associated with mild illness.
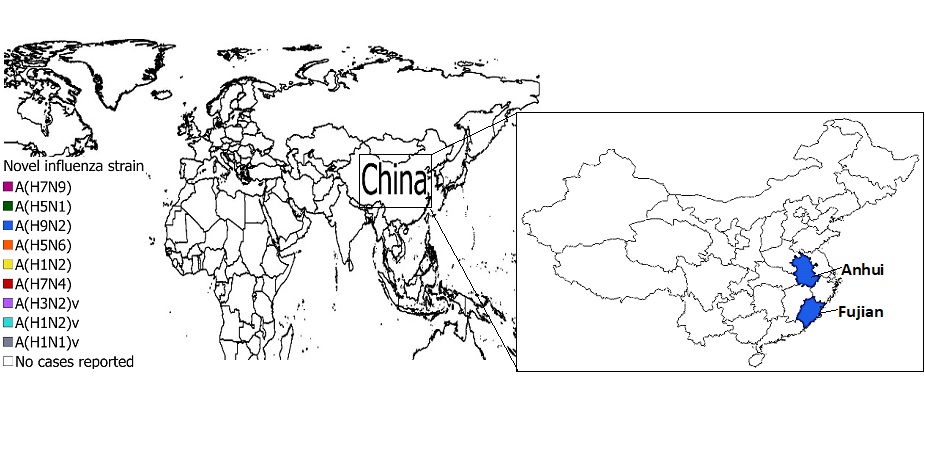
Note: Map was prepared by the Centre for Immunization and Respiratory Infectious Diseases (CIRID) using data from the latest WHO Monthly Influenza at the Human-Animal Interface Risk Assessment. This map reflects data available through these risk assessments as of November 30, 2019.
Figure 2 - Text Description
The spatial distribution of avian and swine influenza human cases in November 2019 has been displayed in Figure 2. Two avian influenza A(H9N2) has been reported in November 2019 from China, in the Anhui and Fujian Provinces.
Middle East respiratory syndrome coronavirus (MERS-CoV)
On November 2019, 12 new cases of MERS-CoV, including one death were reported across six regions in Saudi Arabia (Figure 3, Figure 4). The majority of cases were male (n=11, 92%), and the median age was 54 years (range: 31 to 83 years). Five cases (42%) had known primary camel exposure and six cases (50%) had unknown exposure but were classified as primary, meaning it is unlikely that they acquired the infection from a human MERS case. One case, a 49 year-old female, had unknown exposure but was classified as secondary, meaning that exposure was likely from another MERS patient; however, the source has not been identified. A total of 2494 laboratory-confirmed cases of MERS-CoV, including 855 deaths, have been reported globally since 2012 by the WHO. No cases have been reported in Canada.
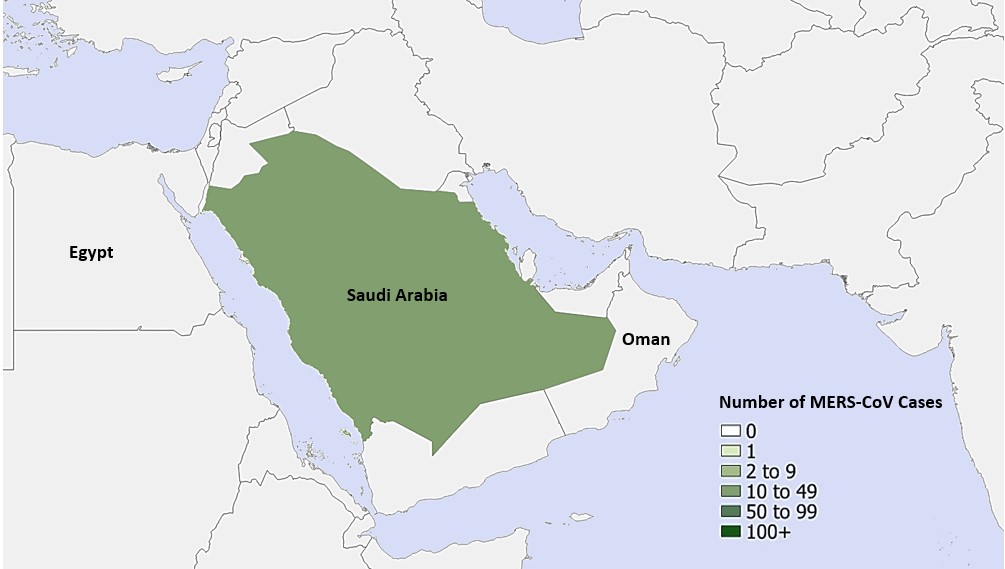
Note: Map was prepared by the Centre for Immunization and Respiratory Infectious Diseases (CIRID) using data from the latest WHO Disease Outbreak News and Saudi Arabia's Ministry of Health. This map reflects data available through these risk assessments as of November 30, 2019.
Figure 3 - Text Description
The spatial distribution of reported MERS cases in November 2019 has been displayed in Figure 3. A total of 12 cases have been reported in November.
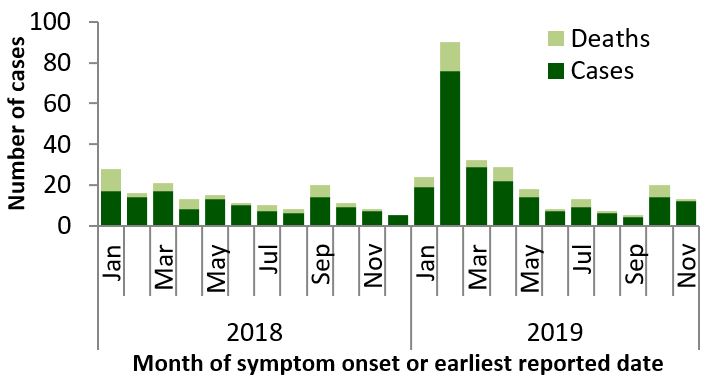
Note: Graph was prepared by the Centre for Immunization and Respiratory Infectious Diseases (CIRID) using data from the WHO Disease Outbreak News and Saudi Arabia's Ministry of Health. This graph reflects data available as of November 30, 2019.
Figure 4 - Text Description
| Year | Month | Cases | Deaths |
|---|---|---|---|
| 2018 | Jan | 17 | 11 |
| Feb | 14 | 2 | |
| Mar | 17 | 4 | |
| Apr | 8 | 5 | |
| May | 13 | 2 | |
| Jun | 10 | 1 | |
| Jul | 7 | 3 | |
| Aug | 6 | 2 | |
| Sep | 14 | 6 | |
| Oct | 9 | 2 | |
| Nov | 7 | 1 | |
| Dec | 5 | 0 | |
| 2019 | Jan | 19 | 5 |
| Feb | 76 | 14 | |
| Mar | 29 | 3 | |
| Apr | 22 | 7 | |
| May | 14 | 4 | |
| Jun | 7 | 1 | |
| Jul | 9 | 4 | |
| Aug | 6 | 1 | |
| Sept | 4 | 1 | |
| Oct | 14 | 6 | |
| Nov | 12 | 1 |
The temporal distribution of MERS-CoV, globally, January 1st, 2018– November 30th, 2019, has been displayed in Figure 4. The highest number of reports occurred in 2019, with a peak in February, and cases decreasing since then.