
Human emerging respiratory pathogens bulletin: Issue 37, January 2020
Download the alternative format
(PDF format, 1.4 MB, 2 pages)
Monthly situational analysis of emerging respiratory diseases affecting humans (data to January 31, 2020)
In this bulletin
- Novel coronavirus updates
- Avian influenza updates
- Swine influenza updates
- Middle East respiratory syndrome coronavirus (MERS-CoV) updates
| Novel influenzaTable 1 Footnote 1 | Cumulative Case CountTable 1 Footnote 2 | Deaths | Case Fatality Rate %Table 1 Footnote 3 |
|---|---|---|---|
| A(H7N9) | 1,568 | 615 | 39% |
| A(H5N1) | 879 | 461 | 52% |
| A(H9N2) | 54 | 1 | <1% |
| A(H5N6) | 24 | 7 | 29% |
| A(H7N4) | 1 | 0 | 0% |
| A(H1N2)Table 1 Footnote 4 | 2 | 0 | 0% |
| A(H3N2)v | 435 | 1 | <1% |
| A(H1N2)v | 26 | 0 | 0% |
| A(H1N1)v | 23 | 0 | 0% |
| MERS-CoVTable 1 Footnote 1 | Cumulative Case CountTable 1 Footnote 2 | Deaths | Case Fatality Rate %Table 1 Footnote 3 |
| Global Case Count | 2,516 | 863 | 34% |
| Saudi Arabia | 2,121 | 785 | 37% |
|
|||
Novel coronavirus updates
On December 31, 2019, cases of a pneumonia of unknown etiology were reported in Wuhan, China which have since been determined to be due to a novel coronavirus (2019-nCoV). On January 30, 2020, the World Health Organization (WHO) declared the outbreak a Public Health Emergency of International Concern. The Public Health Agency of Canada is monitoring the situation closely.
Avian influenza updates
Avian influenza A(H7N9)
No new H7N9 cases were reported to the WHO in January 2020.The last case was reported in April 2019. A total of 1568 human cases of avian influenza A(H7N9), including at least 615 deaths, have been reported globally since 2013, with one case reported in wave 7 (November1, 2018 to September 30, 2019) (Figure 1). Two travel-related cases were reported in Canada in January 2015.
Figure 1. Temporal distribution of human infection with avian influenza A(H7N9), globally, by month and year, January 1, 2013 to January 31, 2020 (n=1568).
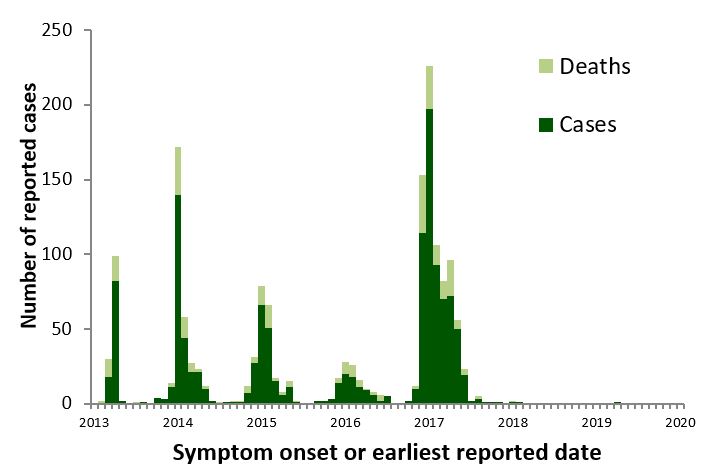
Note: Graph was prepared by the Centre for Immunization and Respiratory Infectious Diseases (CIRID) using data from the latest WHO Monthly Influenza at the Human-Animal Interface Risk Assessment. This graph reflects data available through these risk assessments as of January 31, 2020.
Text description
The temporal distribution of avian influenza A(H7N9), globally, January 1st, 2013 – January 31, 2020, has been displayed in Figure 1. The highest number of reports occurred in 2017, with a peak in January. Three cases were reported in 2018 and one case in 2019.
| Date | Cases | Deaths | |
|---|---|---|---|
| 2016 | Jun | 2 | 0 |
| Jul | 4 | 0 | |
| Aug | 0 | 0 | |
| Sep | 0 | 0 | |
| Oct | 2 | 0 | |
| Nov | 10 | 2 | |
| Dec | 114 | 39 | |
| 2017 | Jan | 197 | 29 |
| Feb | 93 | 13 | |
| Mar | 70 | 12 | |
| Apr | 72 | 24 | |
| May | 50 | 6 | |
| Jun | 19 | 4 | |
| Jul | 2 | 0 | |
| Aug | 3 | 2 | |
| Sep | 1 | 0 | |
| Oct | 0 | 0 | |
| Nov | 0 | 0 | |
| Dec | 1 | 0 | |
| 2018 | Jan | 1 | 1 |
| Feb | 1 | 0 | |
| Mar | 0 | 0 | |
| Apr | 0 | 0 | |
| May | 0 | 0 | |
| June | 0 | 0 | |
| July | 0 | 0 | |
| Aug | 0 | 0 | |
| Sep | 0 | 0 | |
| Oct | 0 | 0 | |
| Nov | 0 | 0 | |
| Dec | 0 | 0 | |
| 2019 | Jan | 0 | 0 |
| Feb | 0 | 0 | |
| Mar | 0 | 0 | |
| Apr | 1 | 0 | |
| May | 0 | 0 | |
| June | 0 | 0 | |
| July | 0 | 0 | |
| Aug | 0 | 0 | |
| Sept | 0 | 0 | |
| Oct | 0 | 0 | |
| Nov | 0 | 0 | |
| Dec | 0 | 0 | |
| 2020 | Jan | 0 | 0 |
Avian influenza A(H5N1)
No new H5N1 cases were reported to the WHO in January 2020. The most recent case of H5N1 was reported in March 25, 2019 in Nepal. A total of 879 cases including 461 deaths have been reported globally since 1997. One fatal travel-related case of H5N1 was reported in Canada in January 2014.
Avian influenza A(H5N6)
No new cases of H5N6 were reported to the WHO in January 2020. The most recent case of H5N6 was reported in China in August 2019. There have been a total of 24 cases, including 7 deaths, reported globally since 2014, all in China.
Avian influenza A(H9N2)
No new cases of H9N2 were reported to the WHO in January 2020. The most recent case was reported in November 2019 in China. Globally, 54 cases, including 1 death, have been reported since 1998.
Avian influenza A(H7N4)
No new cases of H7N4 were reported to the WHO in January 2020. On February 14, 2018, the WHO was notified of the first known human case of H7N4. The case was associated with poultry exposure. No cases have been reported since.
Swine influenza updates
Swine origin influenza A(H3N2)v
The most recent case of swine origin influenza H3N2v was reported in June 2018 in the United States. The case reported exposure to swine at an agricultural fair. A total of 435 cases, including 1 death, have been reported globally since 2011. One locally-acquired case of H3N2v was reported in Canada in December 2016.
Swine origin influenza A(H1N2)v
The most recent case of swine origin influenza H1N2v was reported in August 2018 in the United States. The case reported exposure to swine at an agricultural fair. A total of 26 confirmed cases of H1N2v have been reported in the United States since 2005. Most of the reported cases resulted in mild illness.
Swine origin influenza A(H1N1)v
The most recent case of swine origin influenza H1N1v was reported in May 2019 in the United States. The case was over 65 years old, had no history of swine exposure, and has fully recovered. A total of 23 cases have been reported globally since 2005. To date, the reported H1N1v infections have been associated with mild illness.
Figure 2. Spatial distribution of human cases of avian and swine influenza reported globally in January 2020 (n=0).
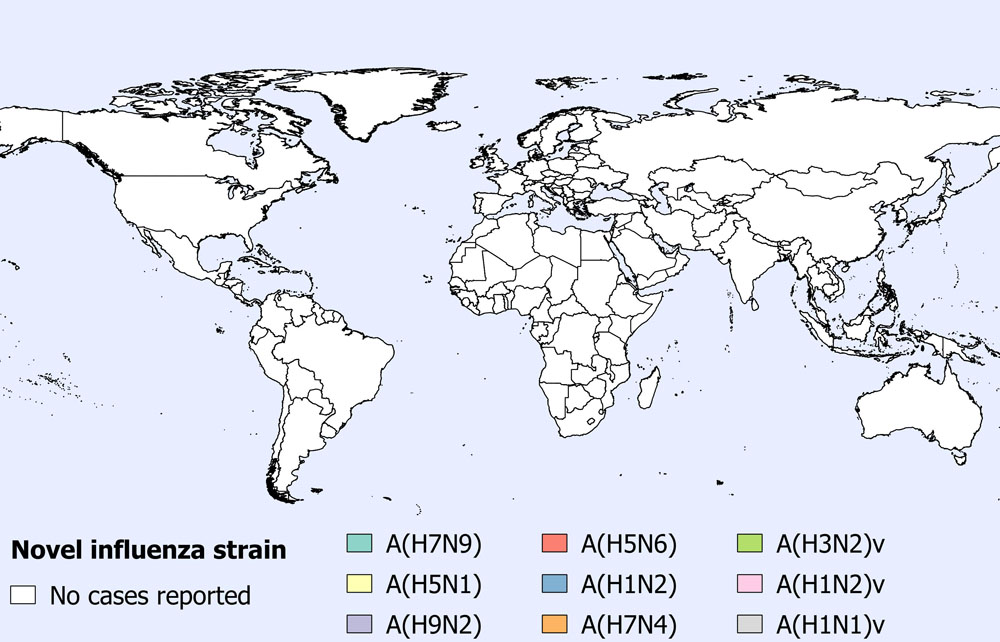
Note: Map was prepared by the Centre for Immunization and Respiratory Infectious Diseases (CIRID) using data from the latest WHO Monthly Influenza at the Human-Animal Interface Risk Assessment. This map reflects data available through these risk assessments as of January 31, 2020.
Text description
The spatial distribution of avian and swine influenza human cases in January 2020 has been displayed in Figure 2. No avian influenza A(H9N2) has been reported in January 2020.
Middle East respiratory syndrome coronavirus (MERS-CoV)
In January 2020, 17 cases of MERS-CoV were reported. Fifteen cases, including two deaths, were reported across five regions of Saudi Arabia. Additionally, two cases in one region of the United Arab Emirates were reported (Figure 3, Figure 4). Most of the cases were male (n=11, 65%), and the median age was 63 years (range: 27 to 85 years). Three cases (18%) had known primary camel exposure and the six other cases (35%) had secondary exposure, meaning it is likely that they acquired the infection from a human MERS case. Of these, three (50%) were healthcare workers. A total of 2516 laboratory-confirmed cases of MERS-CoV, including 863 deaths, have been reported globally since 2012 by the WHO. No cases have been reported in Canada.
Figure 3. Spatial distribution of human cases of MERS-CoV reported in January 2020 (n=17).
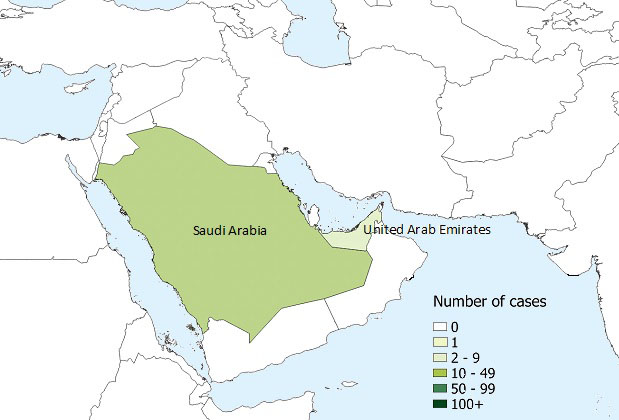
Note: Map was prepared by the Centre for Immunization and Respiratory Infectious Diseases (CIRID) using data from the latest WHO Disease Outbreak News and Saudi Arabia's Ministry of Health. This map reflects data available through these risk assessments as of January 31, 2020.
Text description
The spatial distribution of reported MERS cases in January, 2020 has been displayed in Figure 3. A total of 17 cases have been reported in January.
Figure 4. Temporal distribution of human cases of MERS-CoV reported to the WHO, globally, by month and year, January 1, 2018 to January 31, 2020 (n=361).
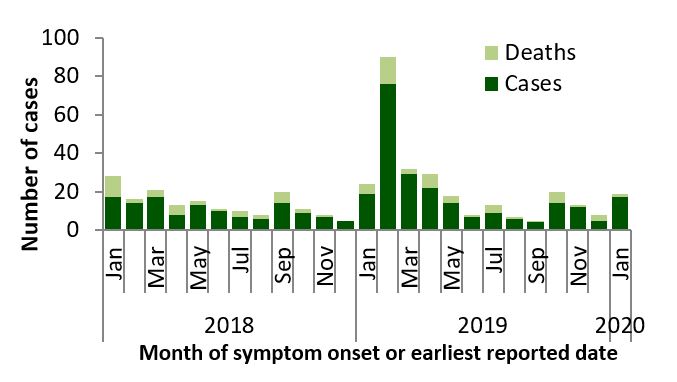
Note: Graph was prepared by the Centre for Immunization and Respiratory Infectious Diseases (CIRID) using data from the WHO Disease Outbreak News and Saudi Arabia's Ministry of Health. This graph reflects data available as of January 31, 2020.
Text description
The temporal distribution of MERS-CoV, globally, January 1st, 2018– January 31st, 2020, has been displayed in Figure 4.
| Date | Cases | Deaths | |
|---|---|---|---|
| 2018 | Jan | 17 | 11 |
| Feb | 14 | 2 | |
| Mar | 17 | 4 | |
| Apr | 8 | 5 | |
| May | 13 | 2 | |
| June | 10 | 1 | |
| July | 7 | 3 | |
| August | 6 | 2 | |
| Sep | 14 | 6 | |
| Oct | 9 | 2 | |
| Nov | 7 | 1 | |
| Dec | 5 | 0 | |
| 2019 | Jan | 19 | 5 |
| Feb | 76 | 14 | |
| Mar | 29 | 3 | |
| Apr | 22 | 7 | |
| May | 14 | 4 | |
| June | 7 | 1 | |
| July | 9 | 4 | |
| August | 6 | 1 | |
| Sep | 4 | 1 | |
| Oct | 14 | 6 | |
| Nov | 15 | 2 | |
| Dec | 4 | 2 | |
| 2020 | Jan | 17 | 2 |