
Respiratory Virus Report, week 38 ending September 21, 2019
Download the alternative format
(PDF format, 1.1 MB, 11 pages)
Organization: Public Health Agency of Canada
On this page
- List of abbreviations
- Respiratory Virus Detections and Isolations
- Number of positive laboratory tests for other respiratory viruses
- Positive Influenza tests
- Positive Respiratory synctial virus tests
- Positive Parainfluenza tests
- Positive Adenovirus tests
- Positive Human metapneumovirus tests
- Positive Enterovirus/Rhinovirus tests
- Positive Coronovirus tests
List of abbreviations
- A(H1N1)pdm09
- Influenza A(H1N1)pdm09
- A(H3)
- Influenza A(H3N2)
- A (UnS)
- Influenza A (Unsubtyped)
- Adeno
- Adenovirus
- CHEO
- Children's Hospital of Eastern Ontario
- Coron
- Coronavirus
- Entero
- Enterovirus
- hMPV
- human metapneumovirus
- HSC
- Health Sciences Centre
- N.A
- Not Applicable
- P.H.L.
- Public Health Laboratory
- P.H.O.L.
- Public Health Ontario Laboratory
- PIV
- Parainfluenza
- Rhino
- Rhinovirus
- RSV
- Respiratory syncytial virus
- UHN
- University Health Network
Respiratory Virus Detections and Isolations
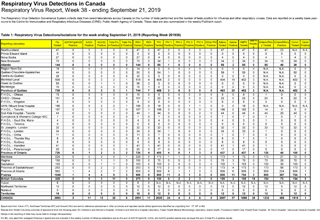
Table 1: Respiratory Virus Detections/Isolations for the week ending September 21, 2019 (Reporting Week 201938)
| Reporting Laboratory | Flu Tested | A(H1N1)pdm09 Positive | A(H3) Positive | A(UnS) Positive | Total Flu A Positive | Total Flu B Positive | RSV Tested | RSV Positive | PIV Tested | PIV 1 Positive | PIV 2 Positive | PIV 3 Positive | PIV 4 Positive | Other PIV Positive | Adeno Tested | Adeno Positive | hMPV Tested | hMPV Positive | Entero/Rhino Tested | Entero/Rhino Positive | Coron Tested | Coron Positive |
|---|---|---|---|---|---|---|---|---|---|---|---|---|---|---|---|---|---|---|---|---|---|---|
| Newfoundland | 47 | 0 | 0 | 0 | 0 | 0 | 47 | 0 | 47 | 0 | 0 | 0 | 0 | 0 | 47 | 0 | 47 | 0 | 47 | 23 | N.A. | N.A. |
| Prince Edward Island | 0 | 0 | 0 | 0 | 0 | 0 | 0 | 0 | 0 | 0 | 0 | 0 | 0 | 0 | 0 | 0 | 0 | 0 | 0 | 0 | 0 | 0 |
| Nova Scotia | 27 | 0 | 0 | 0 | 0 | 0 | 27 | 0 | 4 | 0 | 0 | 0 | 0 | 0 | 4 | 0 | 4 | 0 | 4 | 1 | 4 | 0 |
| New Brunswick | 70 | 0 | 0 | 0 | 0 | 0 | 70 | 0 | 34 | 1 | 0 | 0 | 0 | 0 | 34 | 2 | 34 | 0 | 34 | 16 | 34 | 0 |
| Atlantic | 144 | 0 | 0 | 0 | 0 | 0 | 144 | 0 | 85 | 1 | 0 | 0 | 0 | 0 | 85 | 2 | 85 | 0 | 85 | 40 | 38 | 0 |
| Région Nord-Est | 18 | 0 | 0 | 0 | 0 | 0 | 14 | 0 | 0 | 0 | 0 | 0 | 0 | 0 | 0 | 0 | 0 | 0 | N.A. | N.A. | 0 | 0 |
| Québec-Chaudière-Appalaches | 44 | 0 | 0 | 0 | 0 | 0 | 50 | 0 | 54 | 1 | 0 | 0 | 0 | 0 | 59 | 1 | 50 | 0 | N.A. | N.A. | 50 | 0 |
| Centre-du-Québec | 28 | 0 | 0 | 0 | 0 | 0 | 30 | 0 | 0 | 0 | 0 | 0 | 0 | 0 | 0 | 0 | 0 | 0 | N.A. | N.A. | 0 | 0 |
| Montréal-Laval | 509 | 0 | 0 | 2 | 2 | 1 | 518 | 4 | 404 | 2 | 0 | 0 | 0 | 0 | 404 | 19 | 402 | 3 | N.A. | N.A. | 402 | 0 |
| Ouest du Québec | 55 | 0 | 0 | 1 | 1 | 0 | 56 | 2 | 0 | 0 | 0 | 0 | 0 | 0 | 0 | 0 | 0 | 0 | N.A. | N.A. | 0 | 0 |
| Montérégie | 76 | 0 | 0 | 0 | 0 | 0 | 76 | 1 | 0 | 0 | 0 | 0 | 0 | 0 | 0 | 0 | 0 | 0 | N.A. | N.A. | 0 | 0 |
| Province of Québec | 730 | 0 | 0 | 3 | 3 | 1 | 744 | 7 | 458 | 3 | 0 | 0 | 0 | 0 | 463 | 20 | 452 | 3 | N.A. | N.A. | 452 | 0 |
| Ottawa P.H.L. | 15 | 0 | 0 | 0 | 0 | 0 | 15 | 0 | 9 | 0 | 0 | 0 | 0 | 0 | 9 | 0 | 8 | 0 | 1 | 0 | 0 | 0 |
| CHEO - Ottawa | 101 | 0 | 0 | 0 | 0 | 0 | 101 | 1 | 22 | 0 | 0 | 0 | 0 | 0 | 22 | 0 | 22 | 0 | 24 | 8 | 22 | 0 |
| Kingston P.H.L. | 8 | 0 | 0 | 0 | 0 | 0 | 8 | 0 | 8 | 0 | 0 | 0 | 0 | 0 | 8 | 0 | 8 | 0 | 0 | 0 | 0 | 0 |
| UHN / Mount Sinai Hospital | 196 | 0 | 0 | 2 | 2 | 1 | 196 | 0 | 18 | 0 | 0 | 1 | 1 | 0 | 0 | 0 | 18 | 0 | N.A. | N.A. | N.A. | N.A. |
| P.H.O.L. - Toronto | 197 | 0 | 1 | 0 | 1 | 0 | 197 | 1 | 196 | 3 | 0 | 0 | 0 | 0 | 196 | 0 | 182 | 0 | 14 | 0 | 0 | 0 |
| Sick Kids Hospital - Toronto | 44 | 0 | 0 | 0 | 0 | 0 | 44 | 1 | 44 | 0 | 0 | 0 | 2 | 0 | 44 | 0 | 44 | 4 | 44 | 20 | 44 | 0 |
| Sunnybrook & Women's College HSC | 7 | 0 | 0 | 0 | 0 | 0 | 7 | 0 | 7 | 0 | 0 | 0 | 0 | 0 | 7 | 0 | 7 | 0 | 7 | 0 | 7 | 0 |
| Sault Ste. Marie P.H.L. | 4 | 0 | 0 | 0 | 0 | 0 | 4 | 0 | 4 | 0 | 0 | 0 | 0 | 0 | 4 | 0 | 3 | 0 | 1 | 0 | 0 | 0 |
| Timmins P.H.L. | 0 | 0 | 0 | 0 | 0 | 0 | 0 | 0 | 0 | 0 | 0 | 0 | 0 | 0 | 0 | 0 | 0 | 0 | 0 | 0 | 0 | 0 |
| St. Joseph's - London | 32 | 0 | 0 | 0 | 0 | 0 | 32 | 0 | 32 | 0 | 0 | 0 | 0 | 0 | 32 | 1 | 32 | 0 | 32 | 12 | 32 | 0 |
| London P.H.L. | 34 | 0 | 0 | 0 | 0 | 0 | 34 | 0 | 34 | 1 | 0 | 0 | 0 | 0 | 34 | 0 | 33 | 0 | 1 | 0 | 0 | 0 |
| Orillia P.H.L. | 11 | 0 | 0 | 0 | 0 | 0 | 11 | 0 | 7 | 0 | 0 | 0 | 0 | 0 | 7 | 0 | 7 | 0 | 0 | 0 | 0 | 0 |
| Thunder Bay P.H.L. | 8 | 0 | 0 | 0 | 0 | 0 | 8 | 0 | 8 | 0 | 0 | 0 | 0 | 0 | 8 | 0 | 7 | 0 | 1 | 0 | 0 | 0 |
| Sudbury P.H.L. | 8 | 0 | 0 | 0 | 0 | 0 | 8 | 0 | 8 | 0 | 0 | 0 | 0 | 0 | 8 | 0 | 8 | 0 | 0 | 0 | 0 | 0 |
| Hamilton P.H.L. | 41 | 0 | 0 | 0 | 0 | 1 | 41 | 1 | 41 | 0 | 0 | 0 | 0 | 0 | 41 | 1 | 41 | 0 | 1 | 0 | 0 | 0 |
| Peterborough P.H.L. | 20 | 0 | 0 | 0 | 0 | 0 | 20 | 0 | 17 | 0 | 0 | 0 | 0 | 0 | 17 | 0 | 17 | 0 | 0 | 0 | 0 | 0 |
| Province of Ontario | 726 | 0 | 1 | 2 | 3 | 2 | 726 | 4 | 455 | 4 | 0 | 1 | 3 | 0 | 437 | 2 | 437 | 4 | 126 | 40 | 105 | 0 |
| Manitoba | 224 | 0 | 0 | 0 | 0 | 1 | 224 | 0 | 173 | 1 | 1 | 0 | 0 | 0 | 173 | 1 | 72 | 0 | 173 | 27 | 72 | 0 |
| Regina | 150 | 0 | 0 | 1 | 1 | 0 | 150 | 0 | 70 | 0 | 0 | 0 | 0 | 0 | 70 | 3 | 70 | 0 | 70 | 26 | 70 | 0 |
| Saskatoon | 103 | 0 | 0 | 1 | 1 | 0 | 103 | 0 | 103 | 2 | 0 | 0 | 0 | 0 | 103 | 1 | 103 | 0 | 103 | 30 | 103 | 0 |
| Province of Saskatchewan | 253 | 0 | 0 | 2 | 2 | 0 | 253 | 0 | 173 | 2 | 0 | 0 | 0 | 0 | 173 | 4 | 173 | 0 | 173 | 56 | 173 | 0 |
| Province of Alberta | 563 | 1 | 4 | 2 | 7 | 2 | 509 | 0 | 509 | 8 | 1 | 1 | 0 | 0 | 509 | 6 | 509 | 3 | 509 | 224 | 509 | 1 |
| Prairies | 1040 | 1 | 4 | 4 | 9 | 3 | 986 | 0 | 855 | 11 | 2 | 1 | 0 | 0 | 855 | 11 | 754 | 3 | 855 | 307 | 754 | 1 |
| British Columbia | 325 | 2 | 6 | 3 | 11 | 0 | 273 | 0 | 155 | 5 | 2 | 2 | 3 | 0 | 155 | 2 | 155 | 18 | 154 | 73 | 154 | 0 |
| Yukon | 6 | 0 | 0 | 0 | 0 | 0 | 6 | 0 | N.A. | N.A. | N.A. | N.A. | N.A. | N.A. | N.A. | N.A. | N.A. | N.A. | N.A. | N.A. | N.A. | N.A. |
| Northwest Territories | 12 | 0 | 0 | 0 | 0 | 0 | 12 | 0 | 12 | 0 | 0 | 0 | 0 | 0 | 12 | 0 | 12 | 0 | 12 | 5 | 12 | 0 |
| Nunavut | 0 | 0 | 0 | 0 | 0 | 0 | 0 | 0 | 0 | 0 | 0 | 0 | 0 | 0 | 0 | 0 | 0 | 0 | 0 | 0 | 0 | 0 |
| Territories | 18 | 0 | 0 | 0 | 0 | 0 | 18 | 0 | 12 | 0 | 0 | 0 | 0 | 0 | 12 | 0 | 12 | 0 | 12 | 5 | 12 | 0 |
| CANADA | 2983 | 3 | 11 | 12 | 26 | 6 | 2891 | 11 | 2020 | 24 | 4 | 4 | 6 | 0 | 2007 | 37 | 1895 | 28 | 1232 | 465 | 1515 | 1 |
Table 1 notes
|
||||||||||||||||||||||
Table 2: Respiratory Virus Detections/Isolations for the period August 31, 2019 - September 21, 2019 (Reporting Weeks 201935-201938)
| Reporting Laboratory | Flu Tested | A(H1N1)pdm09 Positive | A(H3) Positive | A(UnS) Positive | Total Flu A Positive | Total Flu B Positive | RSV Tested | RSV Positive | PIV Tested | PIV 1 Positive | PIV 2 Positive | PIV 3 Positive | PIV 4 Positive | Other PIV Positive | Adeno Tested | Adeno Positive | hMPV Tested | hMPV Positive | Entero/Rhino Tested | Entero/Rhino Positive | Coron Tested | Coron Positive |
|---|---|---|---|---|---|---|---|---|---|---|---|---|---|---|---|---|---|---|---|---|---|---|
| Newfoundland | 146 | 0 | 0 | 0 | 0 | 0 | 146 | 0 | 146 | 2 | 0 | 0 | 0 | 0 | 146 | 0 | 146 | 0 | 146 | 45 | N.A. | N.A. |
| Prince Edward Island | 2 | 0 | 0 | 0 | 0 | 0 | 2 | 0 | 1 | 0 | 0 | 0 | 0 | 0 | 1 | 0 | 1 | 0 | 1 | 0 | 1 | 0 |
| Nova Scotia | 58 | 0 | 0 | 0 | 0 | 0 | 59 | 0 | 18 | 0 | 0 | 0 | 0 | 0 | 18 | 0 | 18 | 0 | 18 | 2 | 18 | 0 |
| New Brunswick | 333 | 1 | 1 | 2 | 4 | 0 | 333 | 0 | 157 | 3 | 0 | 0 | 0 | 0 | 157 | 5 | 157 | 0 | 157 | 53 | 157 | 0 |
| Atlantic | 539 | 1 | 1 | 2 | 4 | 0 | 540 | 0 | 322 | 5 | 0 | 0 | 0 | 0 | 322 | 5 | 322 | 0 | 322 | 100 | 176 | 0 |
| Région Nord-Est | 87 | 0 | 0 | 0 | 0 | 0 | 76 | 0 | 0 | 0 | 0 | 0 | 0 | 0 | 0 | 0 | 0 | 0 | N.A. | N.A. | 0 | 0 |
| Québec-Chaudière-Appalaches | 174 | 0 | 0 | 0 | 0 | 0 | 235 | 0 | 246 | 2 | 0 | 0 | 0 | 0 | 257 | 4 | 170 | 0 | N.A. | N.A. | 234 | 0 |
| Centre-du-Québec | 85 | 0 | 0 | 1 | 1 | 0 | 77 | 0 | 0 | 0 | 0 | 0 | 0 | 0 | 0 | 0 | 0 | 0 | N.A. | N.A. | 0 | 0 |
| Montréal-Laval | 1511 | 0 | 0 | 10 | 10 | 5 | 1546 | 10 | 1262 | 12 | 1 | 0 | 1 | 0 | 1262 | 45 | 1065 | 5 | N.A. | N.A. | 1246 | 4 |
| Ouest du Québec | 147 | 0 | 0 | 3 | 3 | 0 | 150 | 3 | 0 | 0 | 0 | 0 | 0 | 0 | 0 | 0 | 0 | 0 | N.A. | N.A. | 0 | 0 |
| Montérégie | 185 | 0 | 0 | 3 | 3 | 1 | 183 | 1 | 0 | 0 | 0 | 0 | 0 | 0 | 0 | 0 | 0 | 0 | N.A. | N.A. | 0 | 0 |
| Province of Québec | 2189 | 0 | 0 | 17 | 17 | 6 | 2267 | 14 | 1508 | 14 | 1 | 0 | 1 | 0 | 1519 | 49 | 1235 | 5 | N.A. | N.A. | 1480 | 4 |
| Ottawa P.H.L. | 42 | 0 | 0 | 0 | 0 | 0 | 40 | 0 | 34 | 1 | 0 | 0 | 0 | 0 | 34 | 0 | 32 | 0 | 2 | 0 | 0 | 0 |
| CHEO - Ottawa | 322 | 0 | 0 | 1 | 1 | 1 | 322 | 5 | 76 | 0 | 0 | 0 | 0 | 0 | 76 | 0 | 76 | 0 | 79 | 21 | 75 | 0 |
| Kingston P.H.L. | 25 | 0 | 0 | 0 | 0 | 0 | 25 | 0 | 25 | 0 | 0 | 0 | 0 | 0 | 25 | 0 | 25 | 0 | 1 | 0 | 0 | 0 |
| UHN / Mount Sinai Hospital | 650 | 0 | 0 | 7 | 7 | 2 | 650 | 4 | 59 | 0 | 0 | 3 | 1 | 0 | 0 | 0 | 59 | 1 | N.A. | N.A. | N.A. | N.A. |
| P.H.O.L. - Toronto | 691 | 0 | 7 | 0 | 7 | 0 | 691 | 2 | 677 | 10 | 0 | 2 | 0 | 0 | 677 | 3 | 640 | 0 | 43 | 0 | 0 | 0 |
| Sick Kids Hospital - Toronto | 126 | 0 | 0 | 0 | 0 | 0 | 126 | 3 | 126 | 3 | 0 | 0 | 2 | 0 | 126 | 0 | 126 | 4 | 126 | 47 | 126 | 0 |
| Sunnybrook & Women's College HSC | 22 | 0 | 0 | 0 | 0 | 0 | 22 | 0 | 22 | 0 | 0 | 0 | 0 | 0 | 22 | 0 | 22 | 0 | 22 | 2 | 22 | 0 |
| Sault Ste. Marie P.H.L. | 14 | 0 | 0 | 0 | 0 | 0 | 14 | 0 | 14 | 0 | 0 | 0 | 0 | 0 | 14 | 0 | 13 | 0 | 1 | 0 | 0 | 0 |
| Timmins P.H.L. | 5 | 0 | 0 | 0 | 0 | 0 | 5 | 0 | 5 | 0 | 0 | 0 | 0 | 0 | 5 | 0 | 5 | 0 | 0 | 0 | 0 | 0 |
| St. Joseph's - London | 92 | 0 | 0 | 0 | 0 | 0 | 92 | 1 | 92 | 1 | 0 | 0 | 0 | 0 | 92 | 2 | 92 | 0 | 90 | 29 | 89 | 0 |
| London P.H.L. | 133 | 0 | 0 | 0 | 0 | 0 | 133 | 0 | 133 | 1 | 0 | 0 | 0 | 0 | 133 | 0 | 126 | 0 | 8 | 0 | 0 | 0 |
| Orillia P.H.L. | 26 | 0 | 0 | 0 | 0 | 0 | 26 | 0 | 22 | 0 | 0 | 0 | 0 | 0 | 22 | 0 | 21 | 0 | 1 | 0 | 0 | 0 |
| Thunder Bay P.H.L. | 19 | 0 | 0 | 0 | 0 | 0 | 19 | 0 | 19 | 0 | 0 | 1 | 0 | 0 | 19 | 0 | 14 | 0 | 5 | 0 | 0 | 0 |
| Sudbury P.H.L. | 26 | 0 | 0 | 0 | 0 | 0 | 26 | 0 | 26 | 0 | 0 | 0 | 0 | 0 | 26 | 0 | 22 | 0 | 4 | 0 | 0 | 0 |
| Hamilton P.H.L. | 131 | 1 | 2 | 0 | 3 | 1 | 125 | 1 | 124 | 1 | 0 | 0 | 0 | 0 | 124 | 2 | 121 | 0 | 4 | 0 | 0 | 0 |
| Peterborough P.H.L. | 59 | 0 | 0 | 0 | 0 | 0 | 56 | 0 | 53 | 0 | 0 | 0 | 0 | 0 | 53 | 0 | 53 | 0 | 3 | 0 | 0 | 0 |
| Province of Ontario | 2383 | 1 | 9 | 8 | 18 | 4 | 2372 | 16 | 1507 | 17 | 0 | 6 | 3 | 0 | 1448 | 7 | 1447 | 5 | 389 | 99 | 312 | 0 |
| Manitoba | 691 | 0 | 0 | 1 | 1 | 1 | 691 | 3 | 517 | 1 | 1 | 1 | 0 | 0 | 517 | 6 | 218 | 0 | 517 | 82 | 218 | 1 |
| Regina | 672 | 0 | 0 | 2 | 2 | 0 | 672 | 0 | 393 | 1 | 0 | 0 | 0 | 0 | 393 | 5 | 286 | 0 | 393 | 94 | 393 | 0 |
| Saskatoon | 332 | 0 | 0 | 1 | 1 | 0 | 332 | 1 | 332 | 4 | 0 | 0 | 1 | 0 | 332 | 8 | 332 | 0 | 332 | 96 | 332 | 0 |
| Province of Saskatchewan | 1004 | 0 | 0 | 3 | 3 | 0 | 1004 | 1 | 725 | 5 | 0 | 0 | 1 | 0 | 725 | 13 | 618 | 0 | 725 | 190 | 725 | 0 |
| Province of Alberta | 1884 | 1 | 17 | 2 | 20 | 4 | 1716 | 0 | 1716 | 16 | 2 | 6 | 5 | 0 | 1716 | 29 | 1716 | 6 | 1716 | 581 | 1716 | 4 |
| Prairies | 3579 | 1 | 17 | 6 | 24 | 5 | 3411 | 4 | 2958 | 22 | 3 | 7 | 6 | 0 | 2958 | 48 | 2552 | 6 | 2958 | 853 | 2659 | 5 |
| British Columbia | 1025 | 4 | 28 | 5 | 37 | 0 | 973 | 1 | 644 | 10 | 2 | 6 | 3 | 0 | 644 | 4 | 644 | 31 | 613 | 167 | 613 | 2 |
| Yukon | 39 | 0 | 2 | 0 | 2 | 0 | 39 | 0 | N.A. | N.A. | N.A. | N.A. | N.A. | N.A. | N.A. | N.A. | N.A. | N.A. | N.A. | N.A. | N.A. | N.A. |
| Northwest Territories | 38 | 0 | 0 | 0 | 0 | 0 | 38 | 0 | 38 | 0 | 0 | 0 | 0 | 0 | 38 | 0 | 38 | 0 | 38 | 24 | 38 | 1 |
| Nunavut | 9 | 0 | 0 | 0 | 0 | 0 | 9 | 0 | 9 | 0 | 2 | 0 | 0 | 0 | 9 | 1 | 9 | 0 | 9 | 4 | 9 | 0 |
| Territories | 86 | 0 | 2 | 0 | 2 | 0 | 86 | 0 | 47 | 0 | 2 | 0 | 0 | 0 | 47 | 1 | 47 | 0 | 47 | 28 | 47 | 1 |
| CANADA | 9801 | 7 | 57 | 38 | 102 | 15 | 9649 | 35 | 6986 | 68 | 8 | 19 | 13 | 0 | 6938 | 114 | 6247 | 47 | 4329 | 1247 | 5287 | 12 |
Table 2 notes
|
||||||||||||||||||||||
Number of positive laboratory tests for other respiratory viruses
Figure 1: Number positive laboratory tests for other respiratory viruses by report week, Canada. 2019-20
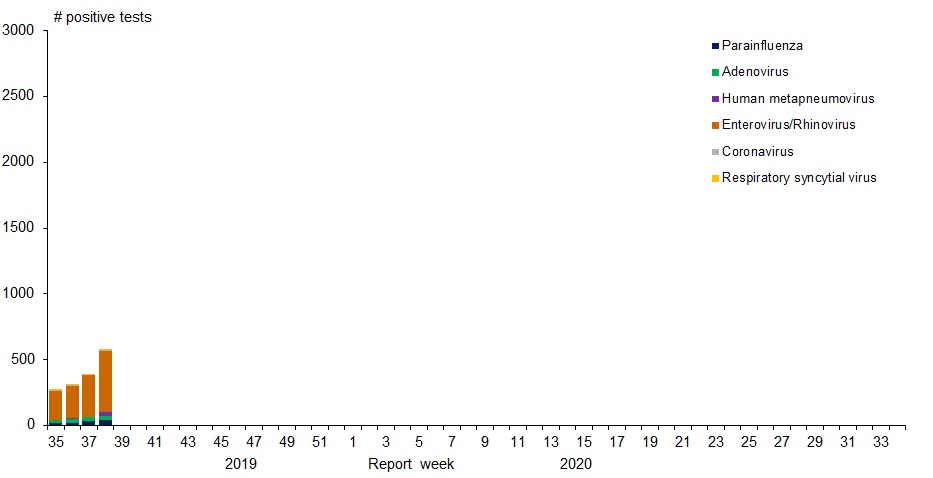
Figure 1: Number positive laboratory tests for other respiratory viruses by report week, Canada. 2019-20 - Text description
| Week | ParaInfluenza | Adenovirus | Human metapneumovirus | Enterovirus/Rhinovirus | Coronavirus | Respiratory syncytial virus |
|---|---|---|---|---|---|---|
| 35 | 16 | 24 | 2 | 221 | 5 | 8 |
| 36 | 22 | 23 | 12 | 244 | 3 | 8 |
| 37 | 32 | 30 | 5 | 316 | 3 | 8 |
| 38 | 38 | 37 | 28 | 466 | 1 | 11 |
Positive Influenza tests
Figure 2: Positive Influenza Tests (%) in Canada by Region by Week of Report
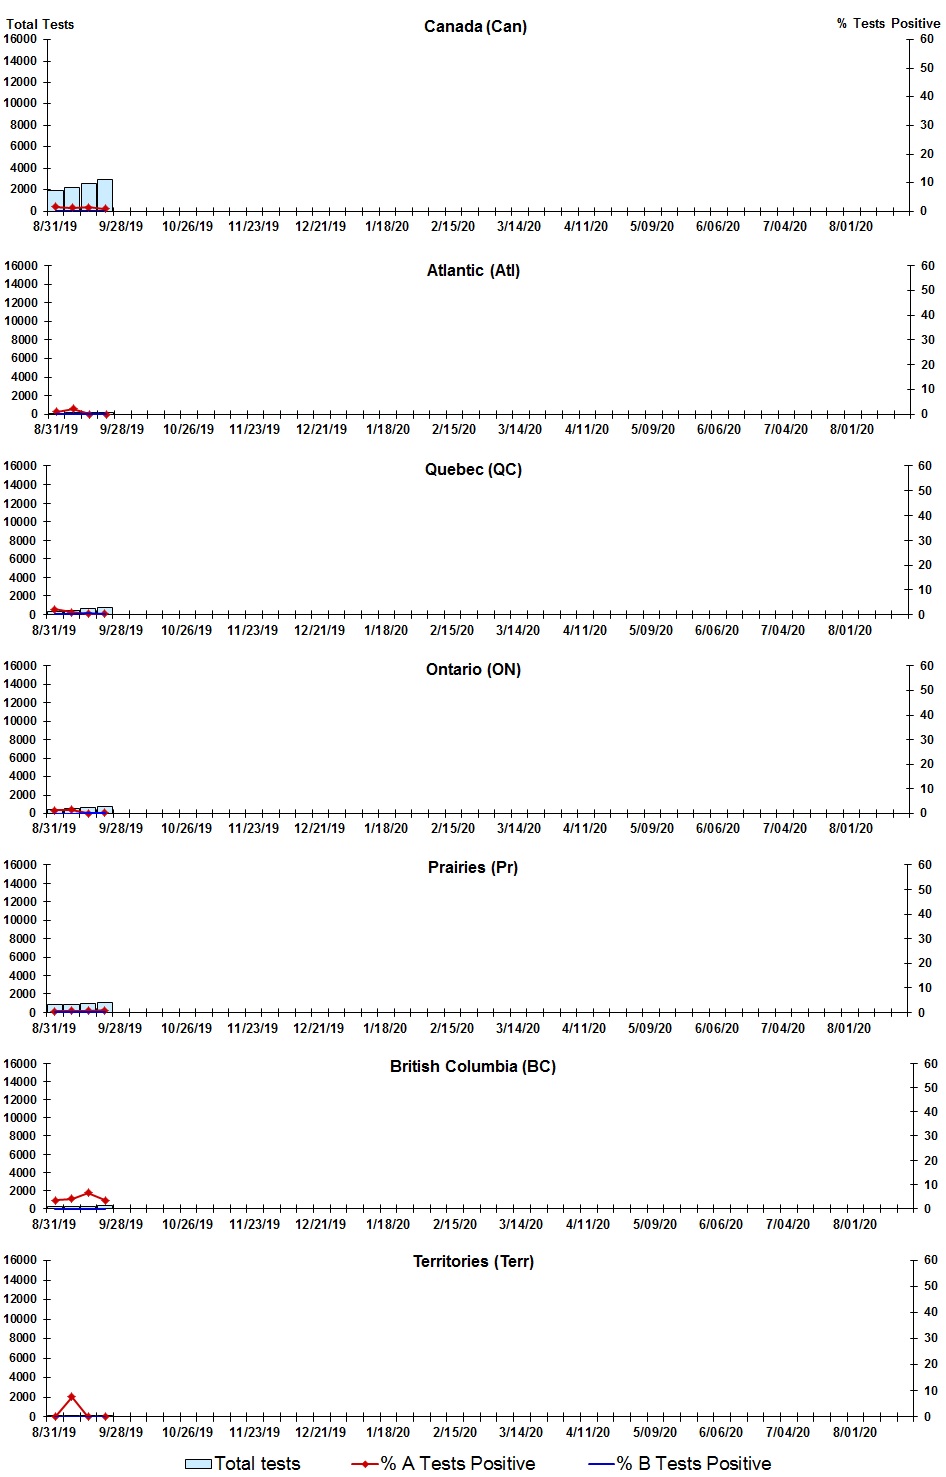
Figure 2: Positive Influenza Tests (%) in Canada by Region by Week of Report - Text description
| Week | Week end | Can Tests | Can A % |
Can B % |
Atl Tests | Atl A % |
Atl B % |
QC Tests | QC A % |
QC B % |
ON Tests | ON A % |
ON B % |
Pr Tests | Pr A % |
Pr B % |
BC Tests | BC A % |
BC B % |
Terr Tests | Terr A % |
Terr B % |
|---|---|---|---|---|---|---|---|---|---|---|---|---|---|---|---|---|---|---|---|---|---|---|
| 35 | 2019-08-31 | 1979 | 1.52 | 0.10 | 95 | 1.05 | 0.00 | 375 | 2.13 | 0.27 | 475 | 1.26 | 0.00 | 802 | 0.50 | 0.12 | 202 | 3.47 | 0.00 | 30 | 0 | 0 |
| 36 | 2019-09-07 | 2208 | 1.31 | 0.09 | 138 | 2.17 | 0.00 | 472 | 0.85 | 0.21 | 514 | 1.56 | 0.00 | 808 | 0.74 | 0.12 | 250 | 4.00 | 0.00 | 26 | 7.69 | 0 |
| 37 | 2019-09-14 | 2631 | 1.44 | 0.19 | 162 | 0.00 | 0.00 | 612 | 0.33 | 0.49 | 668 | 0.15 | 0.30 | 929 | 0.54 | 0.00 | 248 | 6.45 | 0.00 | 12 | 0 | 0 |
| 38 | 2019-09-21 | 2983 | 0.87 | 0.20 | 144 | 0.00 | 0.00 | 730 | 0.41 | 0.14 | 726 | 0.41 | 0.28 | 1040 | 0.87 | 0.29 | 325 | 3.38 | 0.00 | 18 | 0 | 0 |
Positive Respiratory synctial virus tests
Figure 3: Positive Respiratory syncytial virus (RSV) Tests (%) in Canada by Region by Week of Report
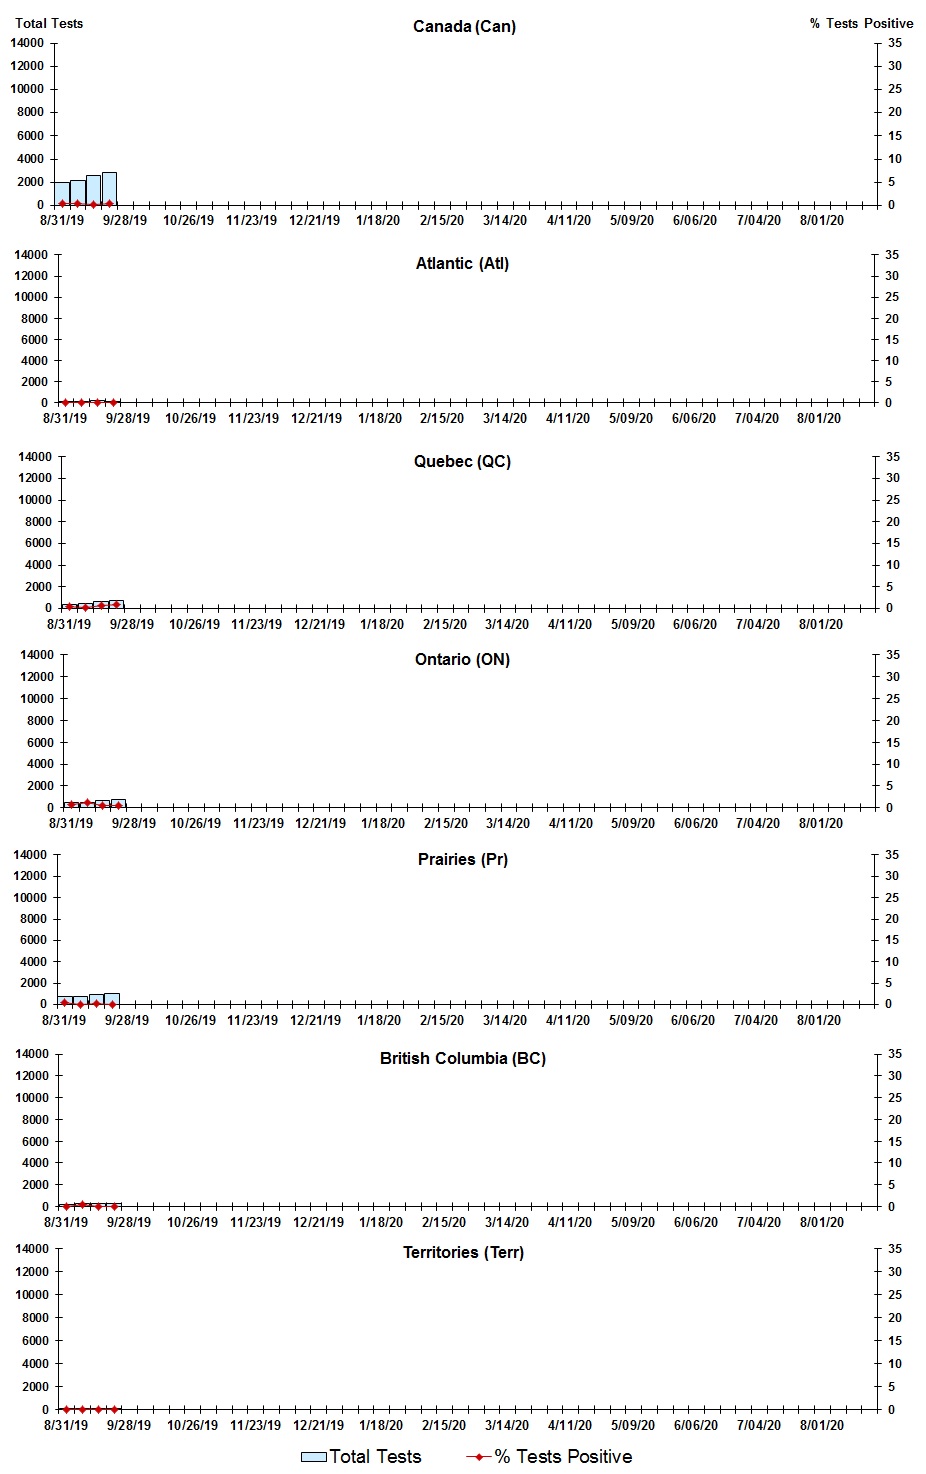
Figure 3: Positive Respiratory syncytial virus (RSV) Tests (%) in Canada by Region by Week of Report - Text description
| Week | Week end | Can Tests | RSV % |
Atl Tests | RSV % |
QC Tests | RSV % |
ON Tests | RSV % |
Pr Tests | RSV % |
BC Tests | RSV % |
Terr Tests | RSV % |
|---|---|---|---|---|---|---|---|---|---|---|---|---|---|---|---|
| 35 | 2019-08-31 | 1948 | 0.41 | 95 | 0 | 399 | 0.5 | 466 | 0.64 | 756 | 0.4 | 202 | 0 | 30 | 0 |
| 36 | 2019-09-07 | 2191 | 0.37 | 139 | 0 | 481 | 0.21 | 512 | 1.17 | 783 | 0 | 250 | 0.4 | 26 | 0 |
| 37 | 2019-09-14 | 2619 | 0.31 | 162 | 0 | 643 | 0.62 | 668 | 0.45 | 886 | 0.11 | 248 | 0 | 12 | 0 |
| 38 | 2019-09-21 | 2891 | 0.38 | 144 | 0 | 744 | 0.94 | 726 | 0.55 | 986 | 0 | 273 | 0 | 18 | 0 |
Positive Parainfluenza tests
Figure 4: Positive Parainfluenza (PIV) Tests (%) in Canada by Region by Week of Report
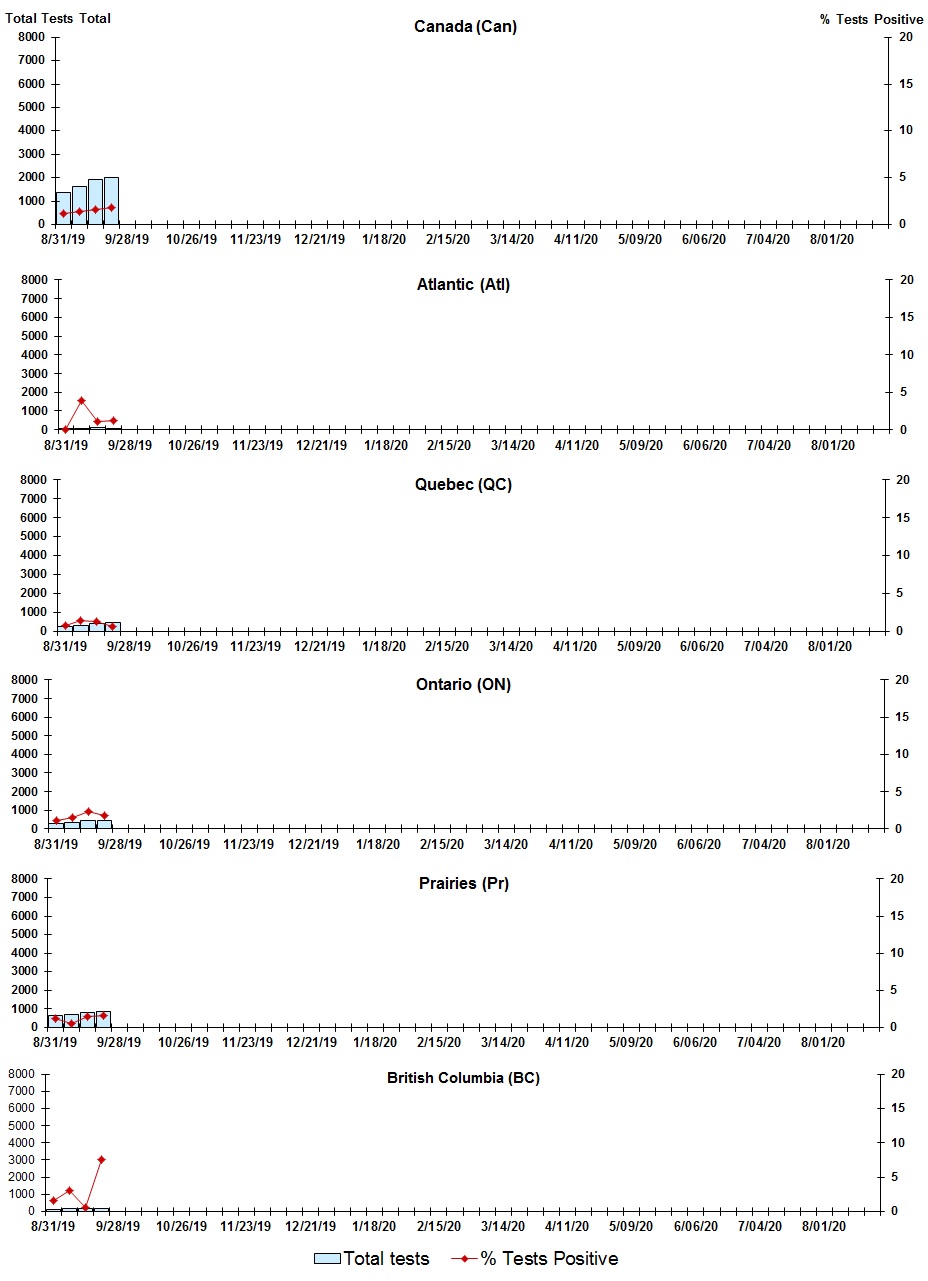
Figure 4: Positive Parainfluenza (PIV) Tests (%) in Canada by Region by Week of Report - Text description
| Week | Week End | Canada Tests | PIV % |
Atl Tests | PIV % |
QC Tests | PIV % |
ON Tests | PIV % |
Pr Tests | PIV % |
BC Tests | PIV % |
|---|---|---|---|---|---|---|---|---|---|---|---|---|---|
| 35 | 2019-08-31 | 1389 | 1.15 | 74 | 0 | 252 | 0.79 | 276 | 1.09 | 633 | 1.26 | 124 | 1.61 |
| 36 | 2019-09-07 | 1633 | 1.35 | 76 | 3.95 | 345 | 1.45 | 339 | 1.47 | 683 | 0.59 | 164 | 3.05 |
| 37 | 2019-09-14 | 1936 | 1.65 | 87 | 1.15 | 453 | 1.32 | 437 | 2.29 | 787 | 1.52 | 160 | 0.63 |
| 38 | 2019-09-21 | 2028 | 1.87 | 85 | 1.18 | 458 | 0.66 | 455 | 1.76 | 855 | 1.64 | 160 | 7.5 |
Positive Adenovirus tests
Figure 5: Positive Adenovirus (adeno) Tests (%) in Canada by Region by Week of Report
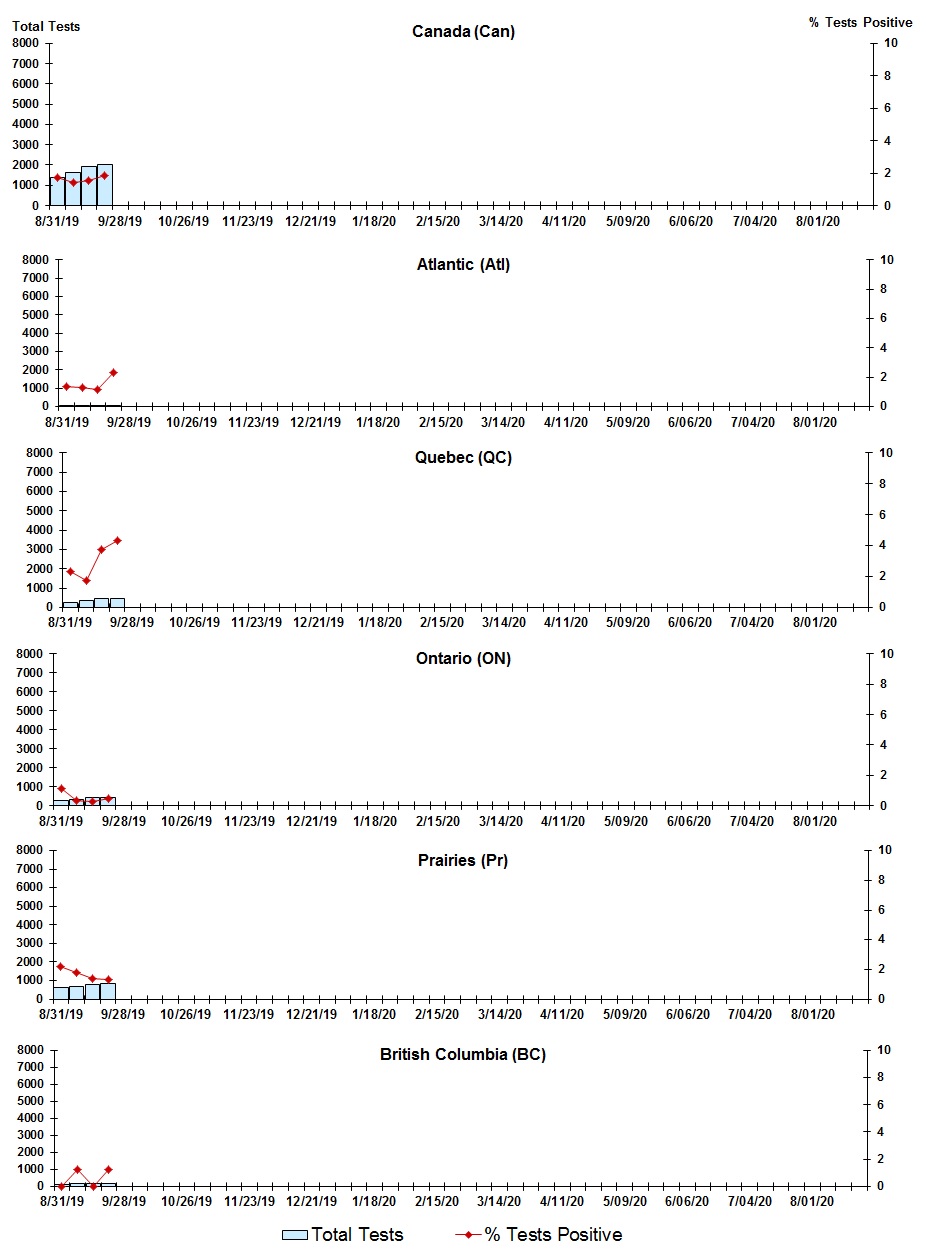
Figure 5: Positive Adenovirus (adeno) Tests (%) in Canada by Region by Week of Report - Text description
| Week | Week End | Can Tests | Adeno % |
Atl Tests | Adeno % |
QC Tests | Adeno % |
ON Tests | Adeno % |
Pr Tests | Adeno % |
BC Tests | Adeno % |
|---|---|---|---|---|---|---|---|---|---|---|---|---|---|
| 35 | 2019-08-31 | 1377 | 1.74 | 74 | 1.35 | 255 | 2.35 | 261 | 1.15 | 633 | 2.21 | 124 | 0 |
| 36 | 2019-09-07 | 1622 | 1.42 | 76 | 1.32 | 348 | 1.72 | 325 | 0.31 | 683 | 1.76 | 164 | 1.22 |
| 37 | 2019-09-14 | 1924 | 1.56 | 87 | 1.15 | 453 | 3.75 | 425 | 0.24 | 787 | 1.4 | 160 | 0 |
| 38 | 2019-09-21 | 2015 | 1.84 | 85 | 2.35 | 463 | 4.32 | 437 | 0.46 | 855 | 1.29 | 160 | 1.25 |
Positive Human metapneumovirus tests
Figure 6: Positive human metapneumovirus (hMPV) Tests (%) in Canada by Region by Week of Report
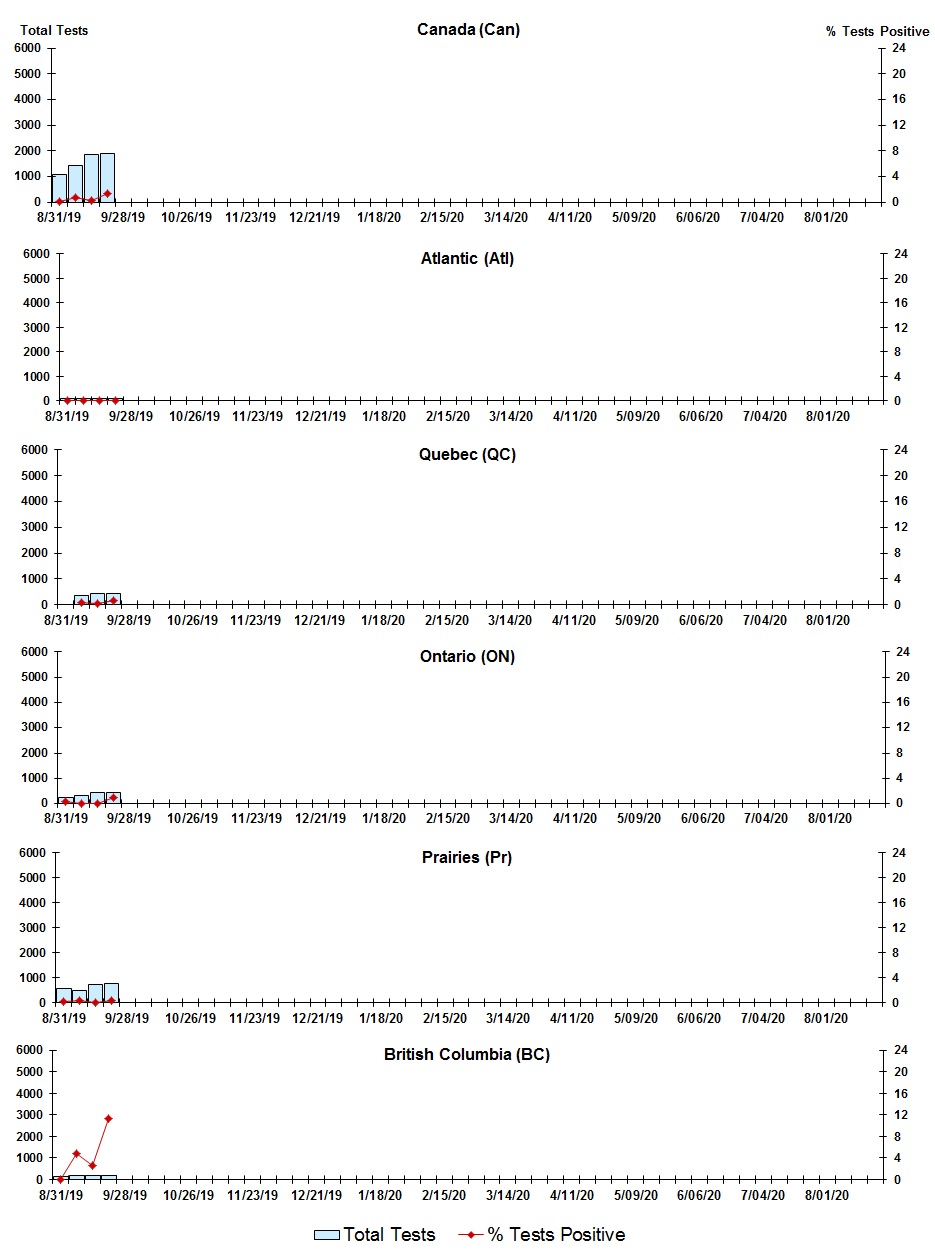
Figure 6: Positive human metapneumovirus (hMPV) Tests (%) in Canada by Region by Week of Report - Text description
| Week | Week End | Can Tests | hMPV % |
Atl Tests | hMPV % |
QC Tests | hMPV % |
ON Tests | hMPV % |
Pr Tests | hMPV % |
BC Tests | hMPV % |
|---|---|---|---|---|---|---|---|---|---|---|---|---|---|
| 35 | 2019-08-31 | 1069 | 0.19 | 74 | 0.00 | #N/A | #N/A | 264 | 0.38 | 577 | 0.17 | 124 | 0 |
| 36 | 2019-09-07 | 1424 | 0.84 | 76 | 0.00 | 338 | 0.3 | 322 | 0 | 498 | 0.4 | 164 | 4.88 |
| 37 | 2019-09-14 | 1851 | 0.27 | 87 | 0.00 | 445 | 0.22 | 424 | 0 | 723 | 0 | 160 | 2.5 |
| 38 | 2019-09-21 | 1903 | 1.47 | 85 | 0.00 | 452 | 0.66 | 437 | 0.92 | 754 | 0.4 | 160 | 11.25 |
Positive Enterovirus/Rhinovirus tests
Figure 7: Positive Enterovirus/Rhinovirus (entero/rhino) Tests (%) in Canada by Region by Week of Report
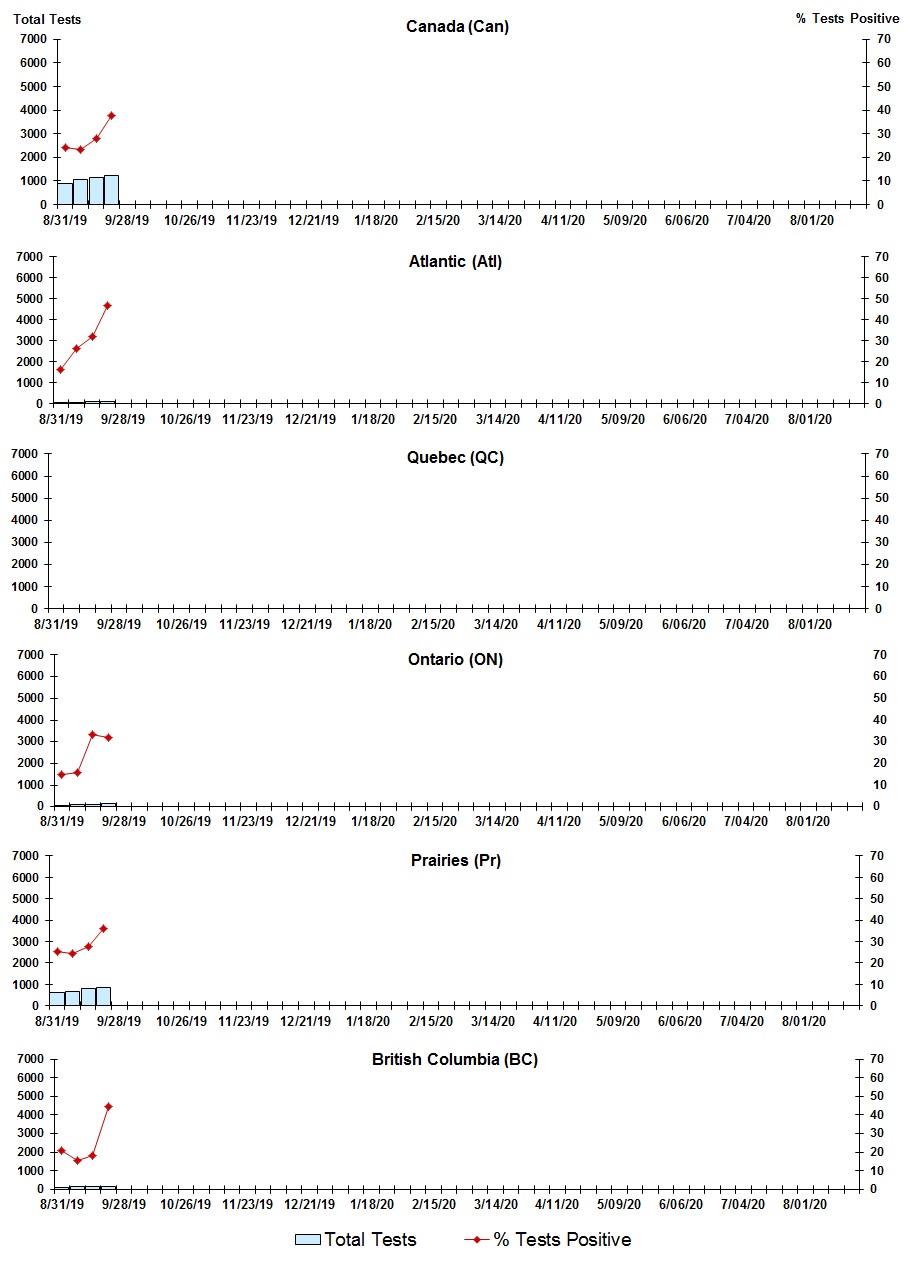
Figure 7: Positive Enterovirus/Rhinovirus (entero/rhino) Tests (%) in Canada by Region by Week of Report - Text description
| Week | Week End | Canada Tests | Entero/rhino % |
Atl Tests | Entero/rhino % |
QC Tests | Entero/rhino % |
ON Tests | Entero/rhino % |
Pr Tests | Entero/rhino % |
BC Tests | Entero/rhino % |
|---|---|---|---|---|---|---|---|---|---|---|---|---|---|
| 35 | 2019-08-31 | 907 | 24.37 | 74 | 16.22 | N.A. | N.A. | 54 | 14.81 | 633 | 25.12 | 116 | 20.69 |
| 36 | 2019-09-07 | 1047 | 23.3 | 76 | 26.32 | N.A. | N.A. | 107 | 15.89 | 683 | 24.6 | 155 | 15.48 |
| 37 | 2019-09-14 | 1135 | 27.84 | 87 | 32.18 | N.A. | N.A. | 102 | 33.33 | 787 | 27.83 | 147 | 18.37 |
| 38 | 2019-09-21 | 1240 | 37.58 | 85 | 47.06 | N.A. | N.A. | 126 | 31.75 | 855 | 35.91 | 159 | 44.65 |
Positive Coronovirus tests
Figure 8: Positive Coronavirus (coron) Tests (%) in Canada by Region by Week of Report
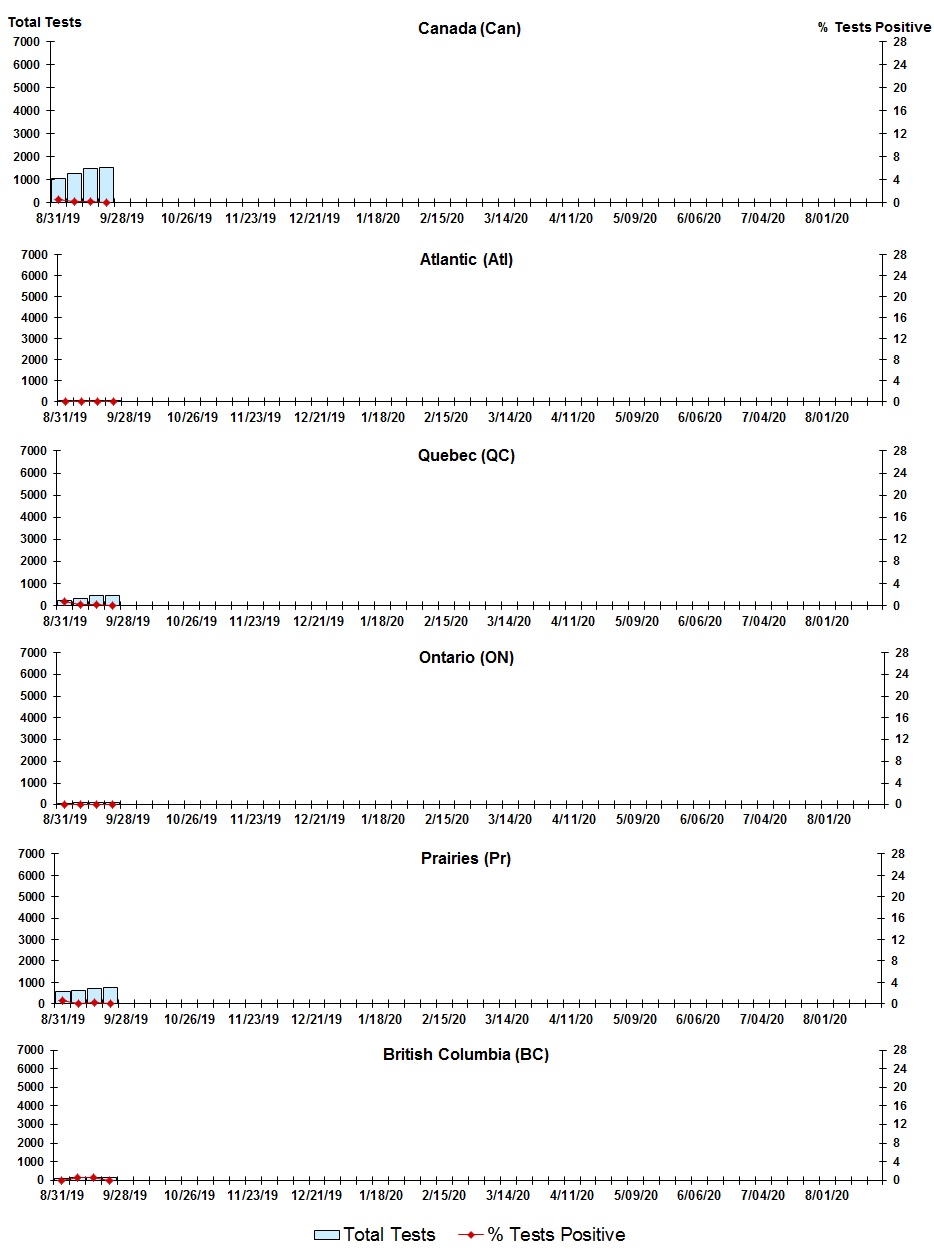
Figure 8: Positive Coronavirus (coron) Tests (%) in Canada by Region by Week of Report - Text description
| Week | Week End | Canada Tests | Coron % |
Atl Tests | Coron % |
QC Tests | Coron % |
ON Tests | Coron % |
Pr Tests | Coron % |
BC Tests | Coron % |
|---|---|---|---|---|---|---|---|---|---|---|---|---|---|
| 35 | 2019-08-31 | 1043 | 0.48 | 38 | 0 | 246 | 0.81 | 36 | 0 | 577 | 0.52 | 116 | 0 |
| 36 | 2019-09-07 | 1257 | 0.24 | 46 | 0 | 338 | 0.3 | 87 | 0 | 605 | 0 | 155 | 0.65 |
| 37 | 2019-09-14 | 1464 | 0.2 | 54 | 0 | 444 | 0.23 | 84 | 0 | 723 | 0.14 | 147 | 0.68 |
| 38 | 2019-09-21 | 1523 | 0.07 | 38 | 0 | 452 | 0 | 105 | 0 | 754 | 0.13 | 159 | 0 |