
Respiratory Virus Report, week 39 ending September 28 2019
Download the alternative format
(PDF format, 1 MB, 11 pages)
Organization: Public Health Agency of Canada
On this page
- List of abbreviations
- Respiratory Virus Detections and Isolations
- Number of positive laboratory tests for other respiratory viruses
- Positive Influenza tests
- Positive Respiratory synctial virus tests
- Positive Parainfluenza tests
- Positive Adenovirus tests
- Positive Human metapneumovirus tests
- Positive Enterovirus/Rhinovirus tests
- Positive Coronovirus tests
List of abbreviations
- A(H1N1)pdm09
- Influenza A(H1N1)pdm09
- A(H3)
- Influenza A(H3N2)
- A (UnS)
- Influenza A (Unsubtyped)
- Adeno
- Adenovirus
- CHEO
- Children's Hospital of Eastern Ontario
- Coron
- Coronavirus
- Entero
- Enterovirus
- hMPV
- human metapneumovirus
- HSC
- Health Sciences Centre
- N.A
- Not Applicable
- P.H.L.
- Public Health Laboratory
- P.H.O.L.
- Public Health Ontario Laboratory
- PIV
- Parainfluenza
- Rhino
- Rhinovirus
- RSV
- Respiratory syncytial virus
- UHN
- University Health Network
Respiratory Virus Detections and Isolations
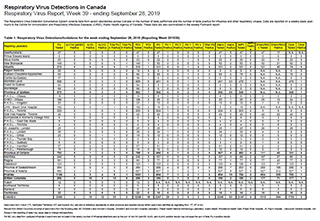
Table 1: Respiratory Virus Detections/Isolations for the week ending September 28, 2019 (Reporting Week 201939)
| Reporting Laboratory | Flu Tested | A(H1N1)pdm09 Positive | A(H3) Positive | A(UnS) Positive | Total Flu A Positive | Total Flu B Positive | RSV Tested | RSV Positive | PIV Tested | PIV 1 Positive | PIV 2 Positive | PIV 3 Positive | PIV 4 Positive | Other PIV Positive | Adeno Tested | Adeno Positive | hMPV Tested | hMPV Positive | Entero/Rhino Tested | Entero/Rhino Positive | Coron Tested | Coron Positive |
|---|---|---|---|---|---|---|---|---|---|---|---|---|---|---|---|---|---|---|---|---|---|---|
| Newfoundland | 47 | 0 | 0 | 0 | 0 | 0 | 47 | 0 | 47 | 1 | 0 | 0 | 0 | 0 | 47 | 0 | 47 | 0 | 47 | 17 | N.A. | N.A. |
| Prince Edward Island | 0 | 0 | 0 | 0 | 0 | 0 | 0 | 0 | 0 | 0 | 0 | 0 | 0 | 0 | 0 | 0 | 0 | 0 | 0 | 0 | 0 | 0 |
| Nova Scotia | 23 | 0 | 0 | 0 | 0 | 0 | 23 | 0 | 22 | 2 | 0 | 1 | 0 | 0 | 22 | 0 | 22 | 0 | 22 | 5 | 22 | 0 |
| New Brunswick | 149 | 0 | 0 | 0 | 0 | 1 | 149 | 1 | 52 | 2 | 0 | 0 | 0 | 0 | 52 | 2 | 52 | 0 | 52 | 21 | 52 | 0 |
| Atlantic | 219 | 0 | 0 | 0 | 0 | 1 | 219 | 1 | 121 | 5 | 0 | 1 | 0 | 0 | 121 | 2 | 121 | 0 | 121 | 43 | 74 | 0 |
| Région Nord-Est | 25 | 0 | 0 | 0 | 0 | 0 | 19 | 0 | 0 | 0 | 0 | 0 | 0 | 0 | 0 | 0 | 0 | 0 | N.A. | N.A. | 0 | 0 |
| Québec-Chaudière-Appalaches | 65 | 0 | 0 | 0 | 0 | 0 | 69 | 0 | 85 | 0 | 0 | 1 | 0 | 0 | 85 | 2 | 78 | 0 | N.A. | N.A. | 78 | 0 |
| Centre-du-Québec | 37 | 0 | 0 | 0 | 0 | 0 | 36 | 1 | 0 | 0 | 0 | 0 | 0 | 0 | 0 | 0 | 0 | 0 | N.A. | N.A. | 0 | 0 |
| Montréal-Laval | 590 | 0 | 0 | 3 | 3 | 0 | 605 | 6 | 481 | 6 | 0 | 1 | 0 | 0 | 481 | 23 | 470 | 1 | N.A. | N.A. | 470 | 1 |
| Ouest du Québec | 84 | 0 | 0 | 0 | 0 | 0 | 84 | 0 | 0 | 0 | 0 | 0 | 0 | 0 | 0 | 0 | 0 | 0 | N.A. | N.A. | 0 | 0 |
| Montérégie | 69 | 0 | 0 | 0 | 0 | 0 | 69 | 0 | 0 | 0 | 0 | 0 | 0 | 0 | 0 | 0 | 0 | 0 | N.A. | N.A. | 0 | 0 |
| Province of Québec | 870 | 0 | 0 | 3 | 3 | 0 | 882 | 7 | 566 | 6 | 0 | 2 | 0 | 0 | 566 | 25 | 548 | 1 | N.A. | N.A. | 548 | 1 |
| P.H.O.L. - Ottawa | 19 | 0 | 0 | 0 | 0 | 0 | 19 | 0 | 6 | 0 | 0 | 0 | 0 | 0 | 6 | 0 | 6 | 0 | 0 | 0 | 0 | 0 |
| CHEO - Ottawa | 106 | 0 | 0 | 0 | 0 | 0 | 106 | 0 | 25 | 0 | 0 | 0 | 1 | 0 | 25 | 1 | 25 | 0 | 25 | 12 | 24 | 0 |
| P.H.O.L. - Kingston | 23 | 0 | 0 | 0 | 0 | 0 | 23 | 1 | 13 | 0 | 0 | 0 | 0 | 0 | 13 | 0 | 12 | 0 | 1 | 0 | 0 | 0 |
| UHN / Mount Sinai Hospital | 192 | 0 | 0 | 1 | 1 | 0 | 192 | 2 | 19 | 0 | 0 | 0 | 1 | 0 | 0 | 0 | 19 | 0 | N.A. | N.A. | N.A. | N.A. |
| P.H.O.L. - Toronto | 229 | 0 | 1 | 0 | 1 | 0 | 229 | 0 | 224 | 1 | 0 | 0 | 0 | 0 | 224 | 0 | 223 | 0 | 3 | 0 | 0 | 0 |
| Sick Kids Hospital - Toronto | 42 | 0 | 0 | 0 | 0 | 0 | 42 | 2 | 42 | 2 | 0 | 0 | 0 | 0 | 42 | 0 | 42 | 0 | 42 | 22 | 42 | 0 |
| Sunnybrook & Women's College HSC | 9 | 0 | 0 | 0 | 0 | 0 | 9 | 0 | 9 | 0 | 0 | 0 | 0 | 0 | 9 | 0 | 9 | 0 | 9 | 3 | 9 | 0 |
| P.H.O.L. - Sault Ste. Marie | 5 | 0 | 0 | 0 | 0 | 0 | 5 | 0 | 4 | 0 | 0 | 0 | 0 | 0 | 4 | 0 | 4 | 0 | 0 | 0 | 0 | 0 |
| P.H.O.L. - Timmins | 4 | 0 | 0 | 0 | 0 | 0 | 4 | 0 | 4 | 0 | 0 | 0 | 0 | 0 | 4 | 0 | 4 | 0 | 0 | 0 | 0 | 0 |
| St. Joseph's - London | 25 | 0 | 0 | 0 | 0 | 0 | 25 | 0 | 25 | 1 | 1 | 0 | 0 | 0 | 25 | 1 | 25 | 0 | 26 | 8 | 26 | 0 |
| P.H.O.L. - London | 35 | 0 | 0 | 0 | 0 | 0 | 35 | 0 | 34 | 1 | 0 | 0 | 0 | 0 | 34 | 1 | 33 | 0 | 4 | 0 | 0 | 0 |
| P.H.O.L. - Orillia | 23 | 0 | 0 | 1 | 1 | 0 | 19 | 0 | 12 | 0 | 0 | 0 | 0 | 0 | 12 | 0 | 12 | 0 | 0 | 0 | 0 | 0 |
| P.H.O.L. - Thunder Bay | 3 | 0 | 0 | 0 | 0 | 0 | 3 | 0 | 3 | 0 | 0 | 0 | 0 | 0 | 3 | 0 | 3 | 0 | 0 | 0 | 0 | 0 |
| P.H.O.L. - Sudbury | 5 | 0 | 0 | 0 | 0 | 0 | 5 | 0 | 3 | 0 | 0 | 0 | 0 | 0 | 3 | 1 | 2 | 0 | 1 | 0 | 0 | 0 |
| P.H.O.L. - Hamilton | 57 | 0 | 0 | 0 | 0 | 0 | 57 | 1 | 51 | 1 | 0 | 0 | 0 | 0 | 51 | 0 | 51 | 0 | 0 | 0 | 0 | 0 |
| P.H.O.L. - Peterborough | 15 | 0 | 0 | 0 | 0 | 0 | 15 | 0 | 12 | 0 | 0 | 0 | 0 | 0 | 12 | 0 | 12 | 0 | 0 | 0 | 0 | 0 |
| Province of Ontario | 792 | 0 | 1 | 2 | 3 | 0 | 788 | 6 | 486 | 6 | 1 | 0 | 2 | 0 | 467 | 4 | 482 | 0 | 111 | 45 | 101 | 0 |
| Manitoba | 240 | 0 | 0 | 0 | 0 | 0 | 240 | 0 | 167 | 0 | 0 | 0 | 0 | 0 | 167 | 3 | 66 | 2 | 167 | 27 | 66 | 0 |
| Regina | 161 | 0 | 0 | 3 | 3 | 0 | 161 | 0 | 77 | 2 | 0 | 0 | 0 | 0 | 77 | 1 | 77 | 0 | 77 | 43 | 77 | 0 |
| Saskatoon | 123 | 0 | 0 | 0 | 0 | 0 | 123 | 1 | 123 | 2 | 0 | 0 | 0 | 0 | 123 | 6 | 126 | 0 | 123 | 57 | 123 | 0 |
| Province of Saskatchewan | 284 | 0 | 0 | 3 | 3 | 0 | 284 | 1 | 200 | 4 | 0 | 0 | 0 | 0 | 200 | 7 | 203 | 0 | 200 | 100 | 200 | 0 |
| Province of Alberta | 582 | 2 | 3 | 1 | 6 | 1 | 527 | 0 | 527 | 3 | 1 | 2 | 1 | 0 | 527 | 9 | 527 | 0 | 527 | 212 | 527 | 1 |
| Prairies | 1106 | 2 | 3 | 4 | 9 | 1 | 1051 | 1 | 894 | 7 | 1 | 2 | 1 | 0 | 894 | 19 | 796 | 2 | 894 | 339 | 793 | 1 |
| British Columbia | 296 | 0 | 10 | 3 | 13 | 0 | 296 | 3 | 190 | 5 | 1 | 0 | 0 | 0 | 190 | 2 | 190 | 2 | 177 | 71 | 177 | 1 |
| Yukon | 12 | 0 | 5 | 0 | 5 | 0 | 12 | 0 | N.A. | N.A. | N.A. | N.A. | N.A. | N.A. | N.A. | N.A. | N.A. | N.A. | N.A. | N.A. | N.A. | N.A. |
| Northwest Territories | 6 | 0 | 0 | 0 | 0 | 0 | 5 | 0 | 5 | 0 | 0 | 0 | 0 | 0 | 5 | 0 | 5 | 1 | 5 | 3 | 5 | 0 |
| Nunavut | 5 | 0 | 0 | 0 | 0 | 0 | 5 | 0 | 5 | 0 | 0 | 0 | 0 | 0 | 5 | 1 | 5 | 0 | 5 | 3 | 5 | 0 |
| Territories | 23 | 0 | 5 | 0 | 5 | 0 | 22 | 0 | 10 | 0 | 0 | 0 | 0 | 0 | 10 | 1 | 10 | 1 | 10 | 6 | 10 | 0 |
| CANADA | 3306 | 2 | 19 | 12 | 33 | 2 | 3258 | 18 | 2267 | 29 | 3 | 5 | 3 | 0 | 2248 | 53 | 2147 | 6 | 1313 | 504 | 1703 | 3 |
Table 1 notes
|
||||||||||||||||||||||
Table 2: Respiratory Virus Detections/Isolations for the period August 31, 2019 - September 28, 2019 (Reporting Weeks 201935-201939)
| Reporting Laboratory | Flu Tested | A(H1N1)pdm09 Positive | A(H3) Positive | A(UnS) Positive | Total Flu A Positive | Total Flu B Positive | RSV Tested | RSV Positive | PIV Tested | PIV 1 Positive | PIV 2 Positive | PIV 3 Positive | PIV 4 Positive | Other PIV Positive | Adeno Tested | Adeno Positive | hMPV Tested | hMPV Positive | Entero/Rhino Tested | Entero/Rhino Positive | Coron Tested | Coron Positive |
|---|---|---|---|---|---|---|---|---|---|---|---|---|---|---|---|---|---|---|---|---|---|---|
| Newfoundland | 193 | 0 | 0 | 0 | 0 | 0 | 193 | 0 | 193 | 3 | 0 | 0 | 0 | 0 | 193 | 0 | 193 | 0 | 193 | 62 | N.A. | N.A. |
| Prince Edward Island | 7 | 0 | 0 | 0 | 0 | 0 | 7 | 0 | 5 | 0 | 0 | 0 | 0 | 0 | 5 | 0 | 5 | 0 | 5 | 3 | 5 | 0 |
| Nova Scotia | 81 | 0 | 0 | 0 | 0 | 0 | 82 | 0 | 40 | 2 | 0 | 1 | 0 | 0 | 40 | 0 | 40 | 0 | 40 | 7 | 40 | 0 |
| New Brunswick | 482 | 1 | 1 | 2 | 4 | 1 | 482 | 1 | 209 | 5 | 0 | 0 | 0 | 0 | 209 | 7 | 209 | 0 | 209 | 74 | 209 | 0 |
| Atlantic | 763 | 1 | 1 | 2 | 4 | 1 | 764 | 1 | 447 | 10 | 0 | 1 | 0 | 0 | 447 | 7 | 447 | 0 | 447 | 146 | 254 | 0 |
| Région Nord-Est | 112 | 0 | 0 | 0 | 0 | 0 | 95 | 0 | 0 | 0 | 0 | 0 | 0 | 0 | 0 | 0 | 0 | 0 | N.A. | N.A. | 0 | 0 |
| Québec-Chaudière-Appalaches | 239 | 0 | 0 | 0 | 0 | 0 | 304 | 0 | 331 | 2 | 0 | 1 | 0 | 0 | 342 | 6 | 248 | 0 | N.A. | N.A. | 312 | 0 |
| Centre-du-Québec | 122 | 0 | 0 | 1 | 1 | 0 | 113 | 1 | 0 | 0 | 0 | 0 | 0 | 0 | 0 | 0 | 0 | 0 | N.A. | N.A. | 0 | 0 |
| Montréal-Laval | 2101 | 0 | 0 | 13 | 13 | 5 | 2151 | 16 | 1743 | 18 | 1 | 1 | 1 | 0 | 1743 | 68 | 1535 | 6 | N.A. | N.A. | 1716 | 5 |
| Ouest du Québec | 231 | 0 | 0 | 3 | 3 | 0 | 234 | 3 | 0 | 0 | 0 | 0 | 0 | 0 | 0 | 0 | 0 | 0 | N.A. | N.A. | 0 | 0 |
| Montérégie | 254 | 0 | 0 | 3 | 3 | 1 | 252 | 1 | 0 | 0 | 0 | 0 | 0 | 0 | 0 | 0 | 0 | 0 | N.A. | N.A. | 0 | 0 |
| Province of Québec | 3059 | 0 | 0 | 20 | 20 | 6 | 3149 | 21 | 2074 | 20 | 1 | 2 | 1 | 0 | 2085 | 74 | 1783 | 6 | N.A. | N.A. | 2028 | 5 |
| P.H.O.L. - Ottawa | 61 | 0 | 0 | 0 | 0 | 0 | 59 | 0 | 46 | 1 | 0 | 0 | 0 | 0 | 46 | 0 | 44 | 0 | 2 | 0 | 0 | 0 |
| CHEO - Ottawa | 428 | 0 | 0 | 1 | 1 | 1 | 428 | 5 | 101 | 0 | 0 | 0 | 1 | 0 | 101 | 1 | 101 | 0 | 104 | 33 | 99 | 0 |
| P.H.O.L. - Kingston | 48 | 0 | 0 | 0 | 0 | 0 | 48 | 1 | 38 | 0 | 0 | 0 | 0 | 0 | 38 | 0 | 37 | 0 | 2 | 0 | 0 | 0 |
| UHN / Mount Sinai Hospital | 842 | 0 | 0 | 8 | 8 | 2 | 842 | 6 | 78 | 0 | 0 | 3 | 2 | 0 | 0 | 0 | 78 | 1 | N.A. | N.A. | N.A. | N.A. |
| P.H.O.L. - Toronto | 920 | 0 | 8 | 0 | 8 | 0 | 920 | 2 | 901 | 11 | 0 | 2 | 0 | 0 | 901 | 3 | 863 | 0 | 47 | 0 | 0 | 0 |
| Sick Kids Hospital - Toronto | 168 | 0 | 0 | 0 | 0 | 0 | 168 | 5 | 168 | 5 | 0 | 0 | 2 | 0 | 168 | 0 | 168 | 4 | 168 | 69 | 168 | 0 |
| Sunnybrook & Women's College HSC | 31 | 0 | 0 | 0 | 0 | 0 | 31 | 0 | 31 | 0 | 0 | 0 | 0 | 0 | 31 | 0 | 31 | 0 | 31 | 5 | 31 | 0 |
| P.H.O.L. - Sault Ste. Marie | 19 | 0 | 0 | 0 | 0 | 0 | 19 | 0 | 18 | 0 | 0 | 0 | 0 | 0 | 18 | 0 | 17 | 0 | 1 | 0 | 0 | 0 |
| P.H.O.L. - Timmins | 9 | 0 | 0 | 0 | 0 | 0 | 9 | 0 | 9 | 0 | 0 | 0 | 0 | 0 | 9 | 0 | 9 | 0 | 0 | 0 | 0 | 0 |
| St. Joseph's - London | 117 | 0 | 0 | 0 | 0 | 0 | 117 | 1 | 117 | 2 | 1 | 0 | 0 | 0 | 117 | 3 | 117 | 0 | 116 | 37 | 115 | 0 |
| P.H.O.L. - London | 168 | 0 | 0 | 0 | 0 | 0 | 168 | 0 | 167 | 2 | 0 | 0 | 0 | 0 | 167 | 1 | 159 | 0 | 16 | 0 | 0 | 0 |
| P.H.O.L. - Orillia | 49 | 0 | 0 | 1 | 1 | 0 | 45 | 0 | 38 | 0 | 0 | 0 | 0 | 0 | 38 | 0 | 37 | 0 | 1 | 0 | 0 | 0 |
| P.H.O.L. - Thunder Bay | 22 | 0 | 0 | 0 | 0 | 0 | 22 | 0 | 22 | 0 | 0 | 1 | 0 | 0 | 22 | 0 | 17 | 0 | 5 | 0 | 0 | 0 |
| P.H.O.L. - Sudbury | 31 | 0 | 0 | 0 | 0 | 0 | 31 | 0 | 29 | 0 | 0 | 0 | 0 | 0 | 29 | 1 | 24 | 0 | 5 | 0 | 0 | 0 |
| P.H.O.L. - Hamilton | 188 | 1 | 2 | 0 | 3 | 1 | 182 | 2 | 175 | 2 | 0 | 0 | 0 | 0 | 175 | 2 | 172 | 0 | 4 | 0 | 0 | 0 |
| P.H.O.L. - Peterborough | 74 | 0 | 0 | 0 | 0 | 0 | 71 | 0 | 68 | 0 | 0 | 0 | 0 | 0 | 68 | 0 | 68 | 0 | 3 | 0 | 0 | 0 |
| Province of Ontario | 3175 | 1 | 10 | 10 | 21 | 4 | 3160 | 22 | 2006 | 23 | 1 | 6 | 5 | 0 | 1928 | 11 | 1942 | 5 | 505 | 144 | 413 | 0 |
| Manitoba | 931 | 0 | 0 | 1 | 1 | 1 | 931 | 3 | 684 | 1 | 1 | 1 | 0 | 0 | 684 | 9 | 284 | 2 | 684 | 109 | 284 | 1 |
| Regina | 833 | 0 | 0 | 5 | 5 | 0 | 833 | 0 | 470 | 3 | 0 | 0 | 0 | 0 | 470 | 6 | 363 | 0 | 470 | 137 | 470 | 0 |
| Saskatoon | 455 | 0 | 0 | 1 | 1 | 0 | 455 | 2 | 455 | 6 | 0 | 0 | 1 | 0 | 455 | 14 | 458 | 0 | 455 | 153 | 455 | 0 |
| Province of Saskatchewan | 1288 | 0 | 0 | 6 | 6 | 0 | 1288 | 2 | 925 | 9 | 0 | 0 | 1 | 0 | 925 | 20 | 821 | 0 | 925 | 290 | 925 | 0 |
| Province of Alberta | 2513 | 3 | 22 | 3 | 28 | 5 | 2281 | 0 | 2281 | 21 | 3 | 8 | 6 | 0 | 2281 | 40 | 2281 | 6 | 2281 | 814 | 2281 | 5 |
| Prairies | 4732 | 3 | 22 | 10 | 35 | 6 | 4500 | 5 | 3890 | 31 | 4 | 9 | 7 | 0 | 3890 | 69 | 3386 | 8 | 3890 | 1213 | 3490 | 6 |
| British Columbia | 1321 | 4 | 40 | 6 | 50 | 0 | 1269 | 4 | 834 | 15 | 3 | 6 | 3 | 0 | 834 | 6 | 834 | 33 | 790 | 238 | 790 | 3 |
| Yukon | 51 | 0 | 7 | 0 | 5 | 0 | 51 | 0 | N.A. | N.A. | N.A. | N.A. | N.A. | N.A. | N.A. | N.A. | N.A. | N.A. | N.A. | N.A. | N.A. | N.A. |
| Northwest Territories | 45 | 0 | 0 | 0 | 0 | 0 | 44 | 0 | 44 | 0 | 0 | 0 | 0 | 0 | 44 | 0 | 44 | 1 | 44 | 28 | 44 | 1 |
| Nunavut | 14 | 0 | 0 | 0 | 0 | 0 | 14 | 0 | 14 | 0 | 2 | 0 | 0 | 0 | 14 | 2 | 14 | 0 | 14 | 7 | 14 | 0 |
| Territories | 110 | 0 | 7 | 0 | 5 | 0 | 109 | 0 | 58 | 0 | 2 | 0 | 0 | 0 | 58 | 2 | 58 | 1 | 58 | 35 | 58 | 1 |
| CANADA | 13160 | 9 | 80 | 48 | 135 | 17 | 12951 | 53 | 9309 | 99 | 11 | 24 | 16 | 0 | 9242 | 169 | 8450 | 53 | 5690 | 1776 | 7033 | 15 |
Table 2 notes
|
||||||||||||||||||||||
Number of positive laboratory tests for other respiratory viruses
Figure 1: Number positive laboratory tests for other respiratory viruses by report week, Canada. 2019-20
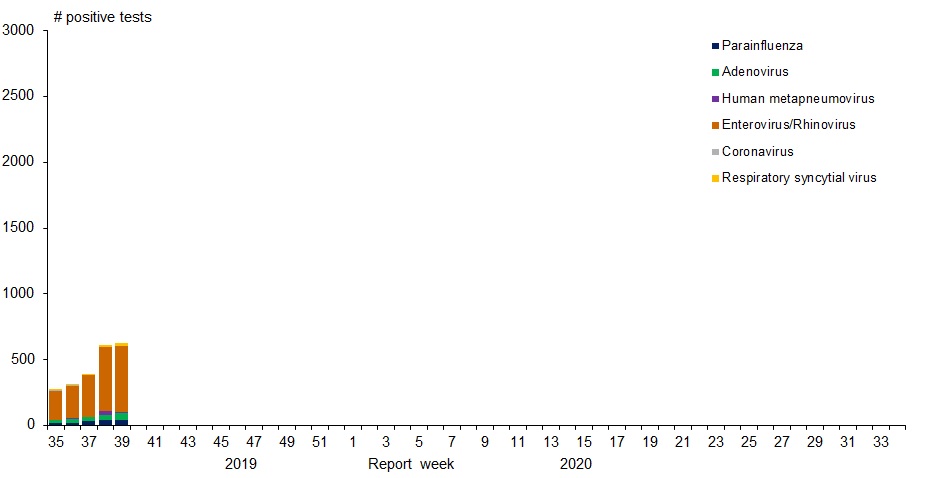
Figure 1: Number positive laboratory tests for other respiratory viruses by report week, Canada. 2019-20 - Text description
| Week | ParaInfluenza | Adenovirus | Human metapneumovirus | Enterovirus/Rhinovirus | Coronavirus | Respiratory syncytial virus |
|---|---|---|---|---|---|---|
| 35 | 16 | 24 | 2 | 221 | 5 | 8 |
| 36 | 22 | 23 | 12 | 244 | 3 | 8 |
| 37 | 32 | 30 | 5 | 316 | 3 | 8 |
| 38 | 40 | 39 | 28 | 491 | 1 | 11 |
| 39 | 40 | 53 | 6 | 504 | 3 | 18 |
Positive Influenza tests
Figure 2: Positive Influenza Tests (%) in Canada by Region by Week of Report
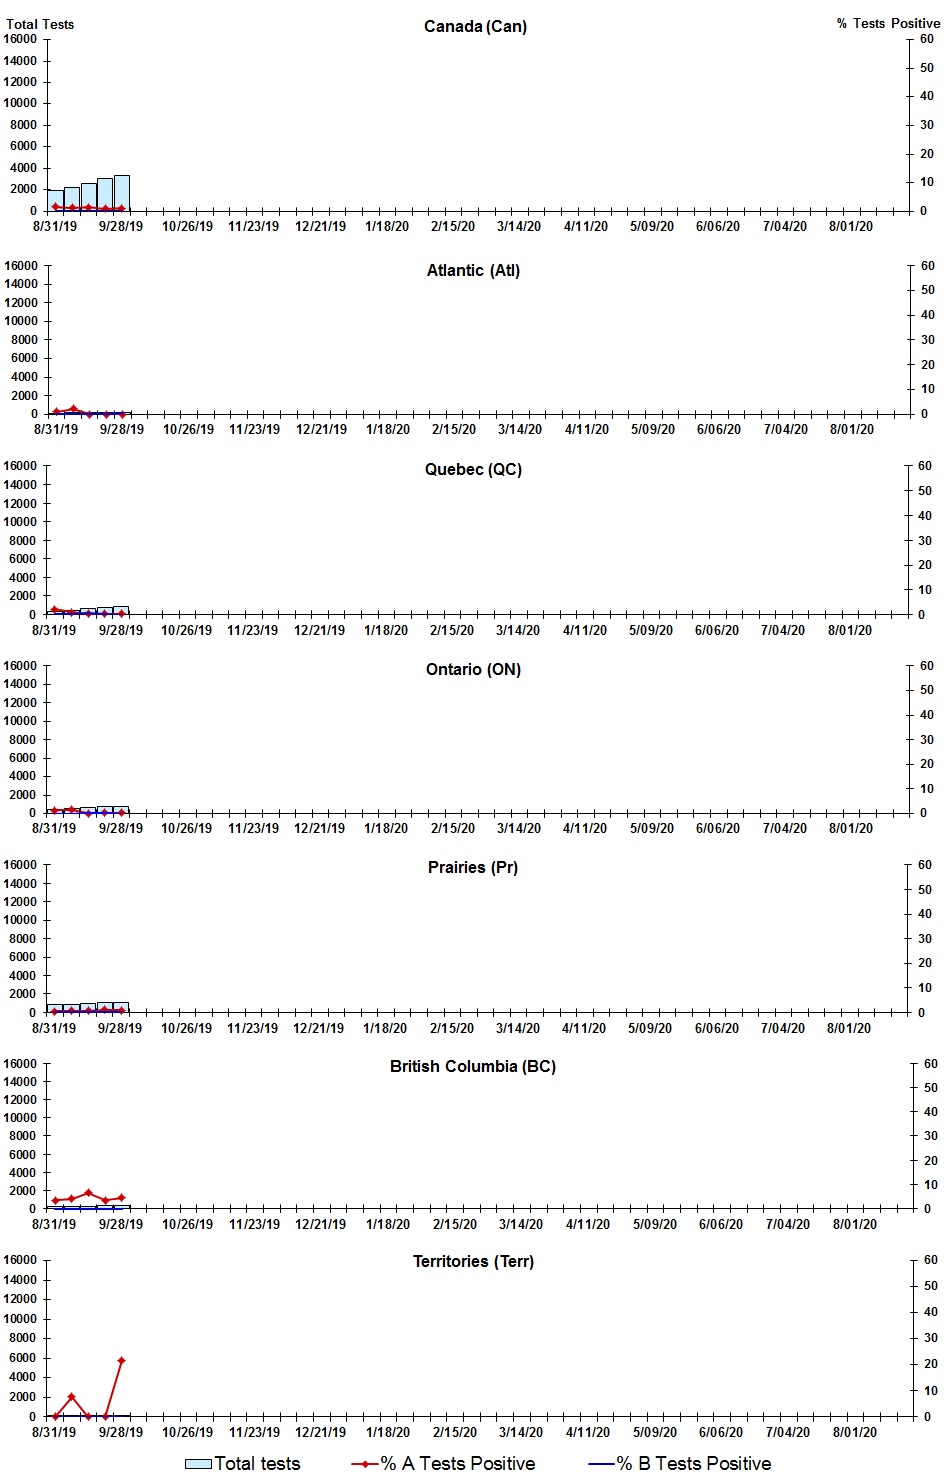
Figure 2: Positive Influenza Tests (%) in Canada by Region by Week of Report - Text description
| Week | Week end | Can Tests | Can A % |
Can B % |
Atl Tests | Atl A % |
Atl B % |
QC Tests | QC A % |
QC B % |
ON Tests | ON A % |
ON B % |
Pr Tests | Pr A % |
Pr B % |
BC Tests | BC A % |
BC B % |
Terr Tests | Terr A % |
Terr B % |
|---|---|---|---|---|---|---|---|---|---|---|---|---|---|---|---|---|---|---|---|---|---|---|
| 35 | 2019-08-31 | 1979 | 1.5 | 0.1 | 95 | 1.1 | 0.0 | 375 | 2.1 | 0.3 | 475 | 1.3 | 0.0 | 802 | 0.5 | 0.1 | 202 | 3.5 | 0.0 | 30 | 0.0 | 0.0 |
| 36 | 2019-09-07 | 2208 | 1.3 | 0.1 | 138 | 2.2 | 0.0 | 472 | 0.9 | 0.2 | 514 | 1.6 | 0.0 | 808 | 0.7 | 0.1 | 250 | 4.0 | 0.0 | 26 | 7.7 | 0.0 |
| 37 | 2019-09-14 | 2631 | 1.4 | 0.2 | 162 | 0.0 | 0.0 | 612 | 0.3 | 0.5 | 668 | 0.2 | 0.3 | 929 | 0.5 | 0.0 | 248 | 6.5 | 0.0 | 12 | 0.0 | 0.0 |
| 38 | 2019-09-21 | 3036 | 0.9 | 0.2 | 149 | 0.0 | 0.0 | 730 | 0.4 | 0.1 | 726 | 0.4 | 0.3 | 1087 | 1.0 | 0.3 | 325 | 3.4 | 0.0 | 19 | 0.0 | 0.0 |
| 39 | 2019-09-28 | 3306 | 1.0 | 0.1 | 219 | 0.0 | 0.5 | 870 | 0.3 | 0.0 | 792 | 0.4 | 0.0 | 1106 | 0.8 | 0.1 | 296 | 4.4 | 0.0 | 23 | 21.7 | 0.0 |
Positive Respiratory synctial virus tests
Figure 3: Positive Respiratory syncytial virus (RSV) Tests (%) in Canada by Region by Week of Report
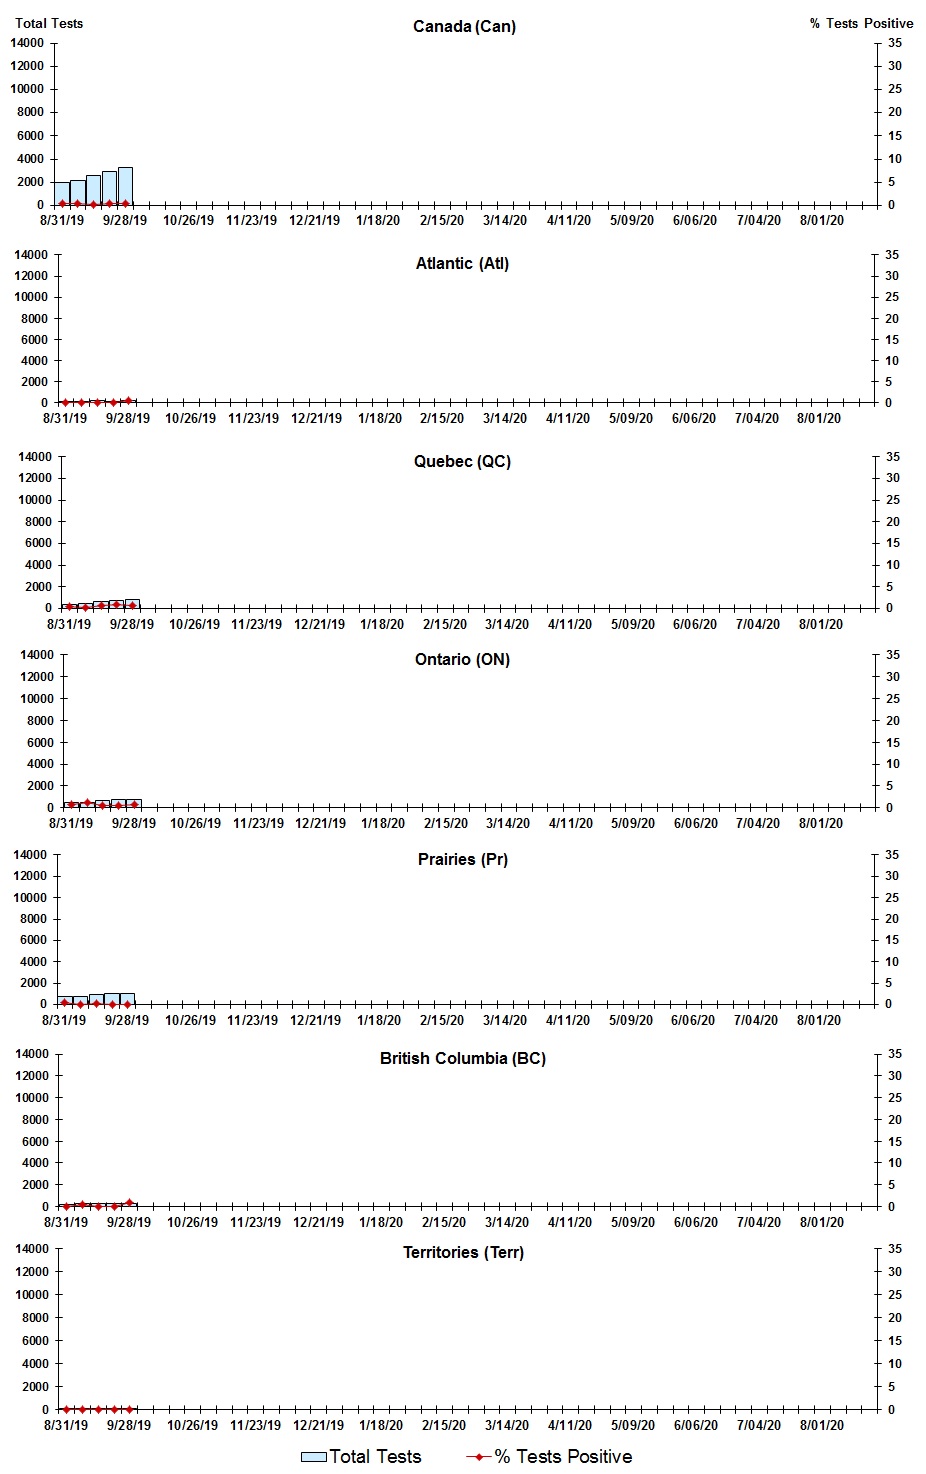
Figure 3: Positive Respiratory syncytial virus (RSV) Tests (%) in Canada by Region by Week of Report - Text description
| Week | Week end | Can Tests | RSV % |
Atl Tests | RSV % |
QC Tests | RSV % |
ON Tests | RSV % |
Pr Tests | RSV % |
BC Tests | RSV % |
Terr Tests | RSV % |
|---|---|---|---|---|---|---|---|---|---|---|---|---|---|---|---|
| 35 | 2019-08-31 | 1948 | 0.4 | 95 | 0.0 | 399 | 0.5 | 466 | 0.6 | 756 | 0.4 | 202 | 0.0 | 30 | 0.0 |
| 36 | 2019-09-07 | 2191 | 0.4 | 139 | 0.0 | 481 | 0.2 | 512 | 1.2 | 783 | 0.0 | 250 | 0.4 | 26 | 0.0 |
| 37 | 2019-09-14 | 2619 | 0.3 | 162 | 0.0 | 643 | 0.6 | 668 | 0.5 | 886 | 0.1 | 248 | 0.0 | 12 | 0.0 |
| 38 | 2019-09-21 | 2935 | 0.4 | 149 | 0.0 | 744 | 0.9 | 726 | 0.6 | 1024 | 0.0 | 273 | 0.0 | 19 | 0.0 |
| 39 | 2019-09-28 | 3258 | 0.6 | 219 | 0.5 | 882 | 0.8 | 788 | 0.8 | 1051 | 0.1 | 296 | 1.0 | 22 | 0.0 |
Positive Parainfluenza tests
Figure 4: Positive Parainfluenza (PIV) Tests (%) in Canada by Region by Week of Report
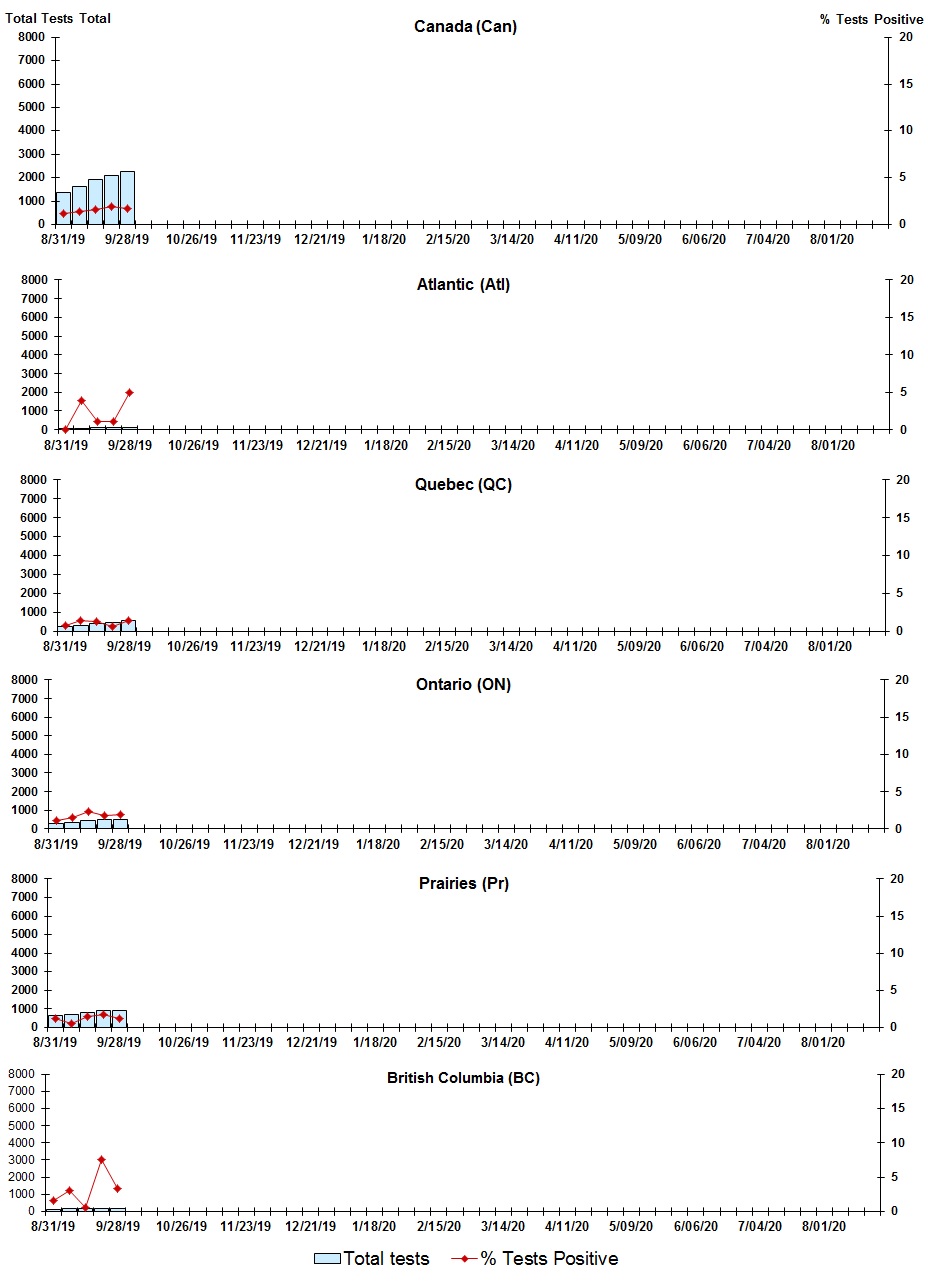
Figure 4: Positive Parainfluenza (PIV) Tests (%) in Canada by Region by Week of Report - Text description
| Week | Week End | Canada Tests | PIV % |
Atl Tests | PIV % |
QC Tests | PIV % |
ON Tests | PIV % |
Pr Tests | PIV % |
BC Tests | PIV % |
|---|---|---|---|---|---|---|---|---|---|---|---|---|---|
| 35 | 2019-08-31 | 1389 | 1.2 | 74 | 0.0 | 252 | 0.8 | 276 | 1.1 | 633 | 1.3 | 124 | 1.6 |
| 36 | 2019-09-07 | 1633 | 1.4 | 76 | 4.0 | 345 | 1.5 | 339 | 1.5 | 683 | 0.6 | 164 | 3.1 |
| 37 | 2019-09-14 | 1936 | 1.7 | 87 | 1.2 | 453 | 1.3 | 437 | 2.3 | 787 | 1.5 | 160 | 0.6 |
| 38 | 2019-09-21 | 2084 | 1.9 | 89 | 1.1 | 458 | 0.7 | 468 | 1.7 | 893 | 1.8 | 160 | 7.5 |
| 39 | 2019-09-28 | 2267 | 1.8 | 121 | 5.0 | 566 | 1.4 | 486 | 1.9 | 894 | 1.2 | 178 | 3.4 |
Positive Adenovirus tests
Figure 5: Positive Adenovirus (adeno) Tests (%) in Canada by Region by Week of Report
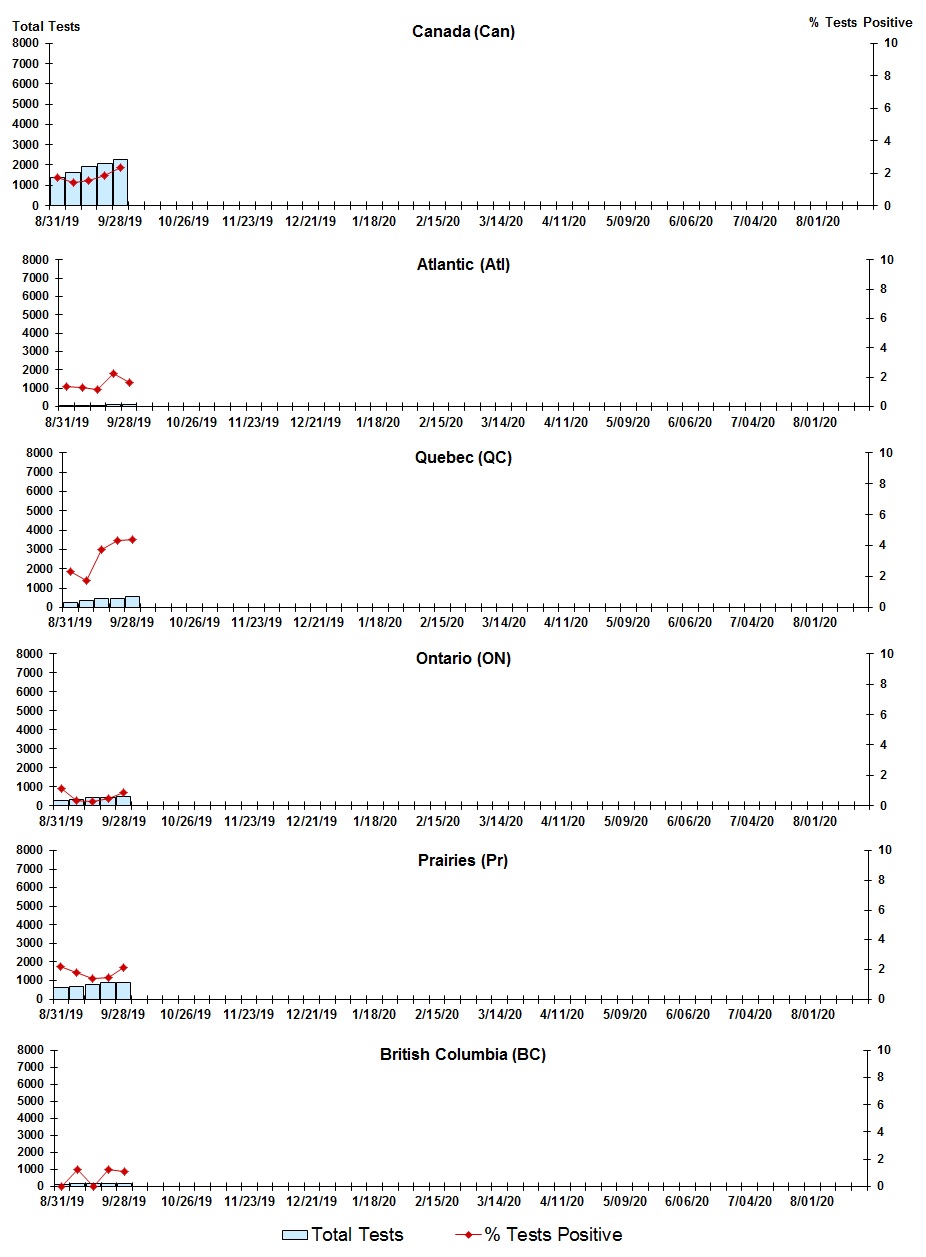
Figure 5: Positive Adenovirus (adeno) Tests (%) in Canada by Region by Week of Report - Text description
| Week | Week End | Can Tests | Adeno % |
Atl Tests | Adeno % |
QC Tests | Adeno % |
ON Tests | Adeno % |
Pr Tests | Adeno % |
BC Tests | Adeno % |
|---|---|---|---|---|---|---|---|---|---|---|---|---|---|
| 35 | 2019-08-31 | 1377 | 1.7 | 74 | 1.4 | 255 | 2.4 | 261 | 1.2 | 633 | 2.2 | 124 | 0.0 |
| 36 | 2019-09-07 | 1622 | 1.4 | 76 | 1.3 | 348 | 1.7 | 325 | 0.3 | 683 | 1.8 | 164 | 1.2 |
| 37 | 2019-09-14 | 1924 | 1.6 | 87 | 1.2 | 453 | 3.8 | 425 | 0.2 | 787 | 1.4 | 160 | 0.0 |
| 38 | 2019-09-21 | 2071 | 1.9 | 89 | 2.3 | 463 | 4.3 | 450 | 0.4 | 893 | 1.5 | 160 | 1.3 |
| 39 | 2019-09-28 | 2248 | 2.4 | 121 | 1.7 | 566 | 4.4 | 467 | 0.9 | 894 | 2.1 | 178 | 1.1 |
Positive Human metapneumovirus tests
Figure 6: Positive human metapneumovirus (hMPV) Tests (%) in Canada by Region by Week of Report
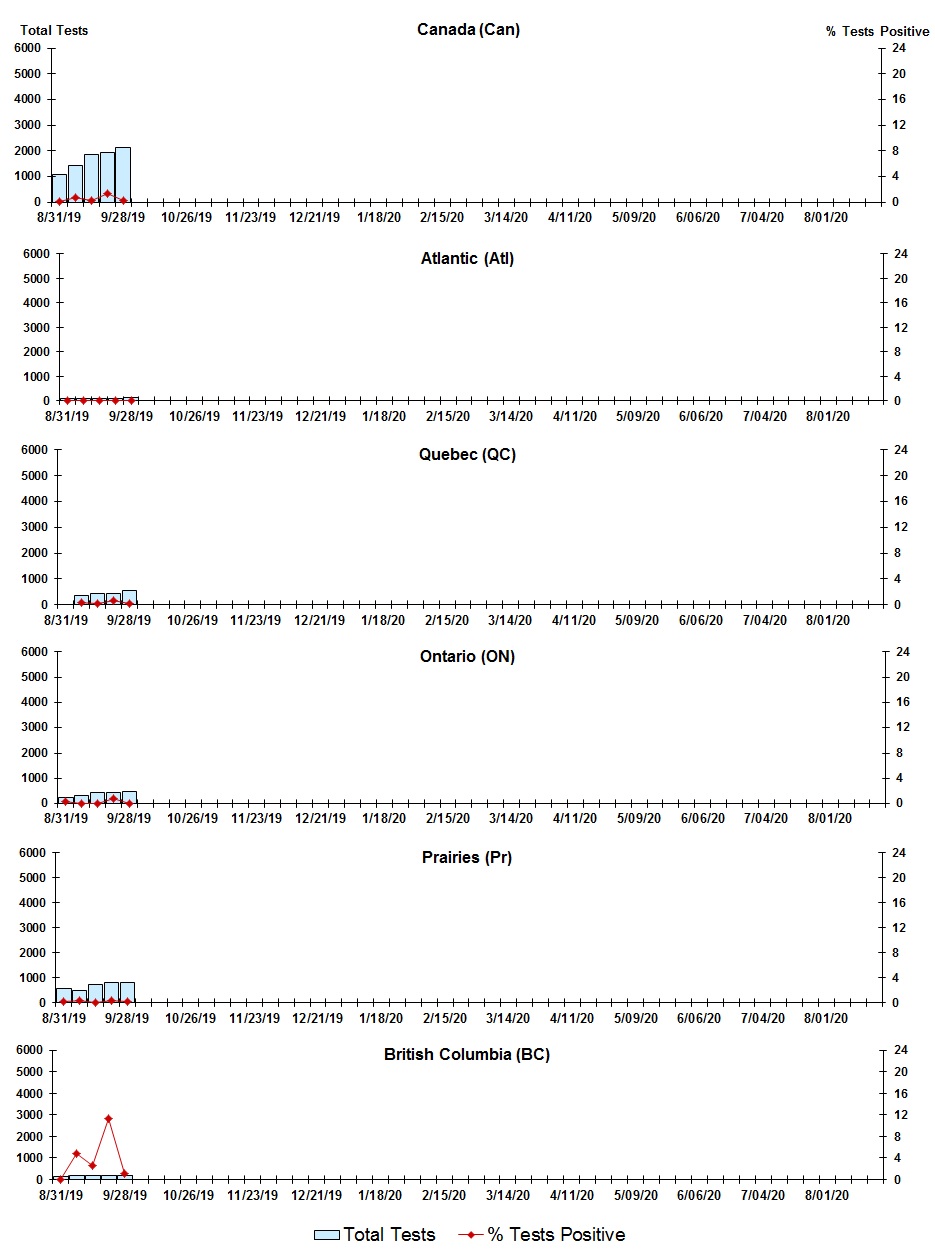
Figure 6: Positive human metapneumovirus (hMPV) Tests (%) in Canada by Region by Week of Report - Text description
| Week | Week End | Can Tests | hMPV % |
Atl Tests | hMPV % |
QC Tests | hMPV % |
ON Tests | hMPV % |
Pr Tests | hMPV % |
BC Tests | hMPV % |
|---|---|---|---|---|---|---|---|---|---|---|---|---|---|
| 35 | 2019-08-31 | 1069 | 0.2 | 74 | 0.0 | #N/A | #N/A | 264 | 0.4 | 577 | 0.2 | 124 | 0.0 |
| 36 | 2019-09-07 | 1424 | 0.8 | 76 | 0.0 | 338 | 0.3 | 322 | 0.0 | 498 | 0.4 | 164 | 4.9 |
| 37 | 2019-09-14 | 1851 | 0.3 | 87 | 0.0 | 445 | 0.2 | 424 | 0.0 | 723 | 0.0 | 160 | 2.5 |
| 38 | 2019-09-21 | 1959 | 1.4 | 89 | 0.0 | 452 | 0.7 | 450 | 0.9 | 792 | 0.4 | 160 | 11.3 |
| 39 | 2019-09-28 | 2147 | 0.3 | 121 | 0.0 | 548 | 0.2 | 482 | 0.0 | 796 | 0.3 | 178 | 1.1 |
Positive Enterovirus/Rhinovirus tests
Figure 7: Positive Enterovirus/Rhinovirus (entero/rhino) Tests (%) in Canada by Region by Week of Report
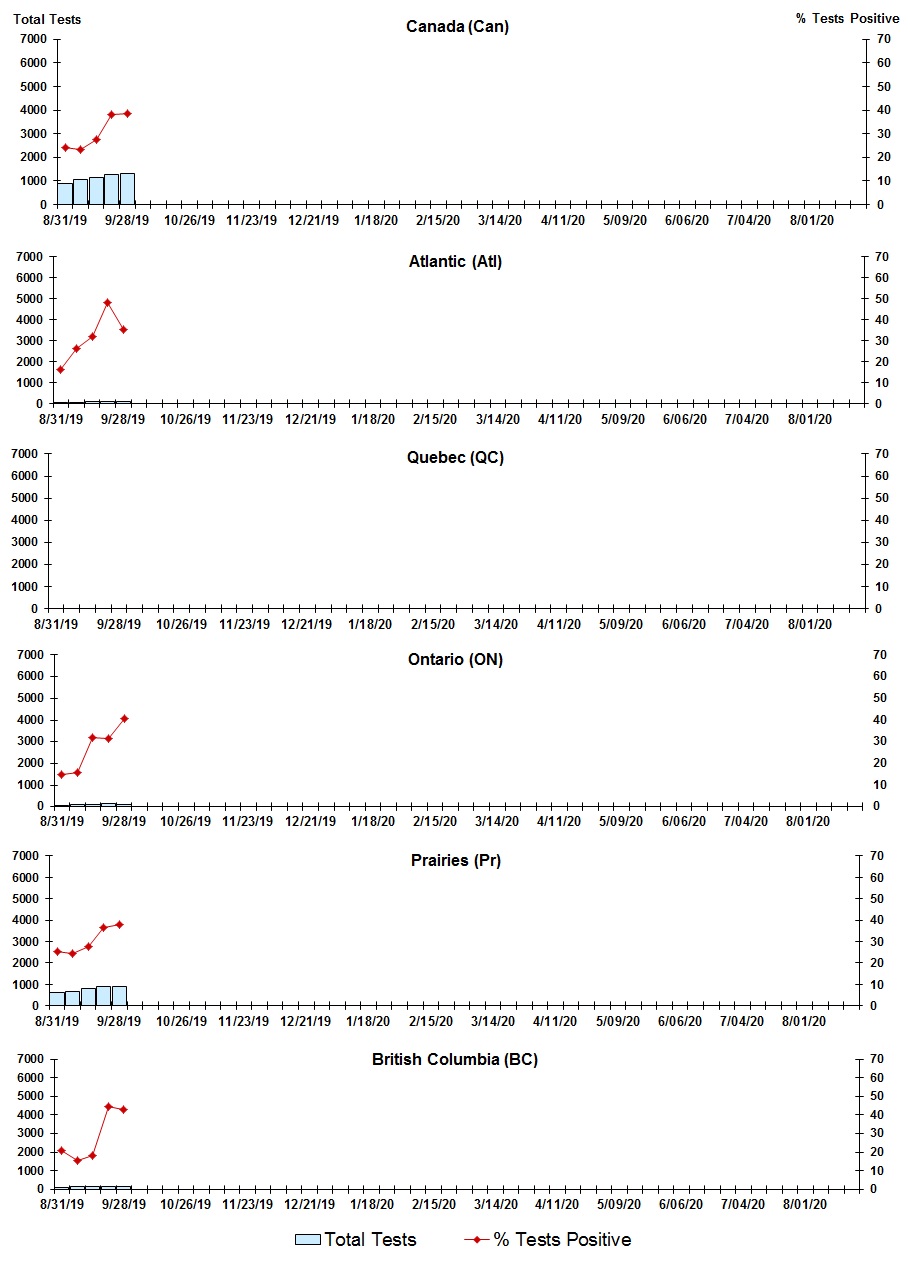
Figure 7: Positive Enterovirus/Rhinovirus (entero/rhino) Tests (%) in Canada by Region by Week of Report - Text description
| Week | Week End | Canada Tests | Entero/rhino % |
Atl Tests | Entero/rhino % |
QC Tests | Entero/rhino % |
ON Tests | Entero/rhino % |
Pr Tests | Entero/rhino % |
BC Tests | Entero/rhino % |
|---|---|---|---|---|---|---|---|---|---|---|---|---|---|
| 35 | 2019-08-31 | 907 | 24.4 | 74 | 16.2 | #N/A | #N/A | 54 | 14.8 | 633 | 25.1 | 116 | 20.7 |
| 36 | 2019-09-07 | 1047 | 23.3 | 76 | 26.3 | #N/A | #N/A | 107 | 15.9 | 683 | 24.6 | 155 | 15.5 |
| 37 | 2019-09-14 | 1139 | 27.7 | 87 | 32.2 | #N/A | #N/A | 106 | 32.1 | 787 | 27.8 | 147 | 18.4 |
| 38 | 2019-09-21 | 1284 | 38.2 | 89 | 48.3 | #N/A | #N/A | 127 | 31.5 | 893 | 36.7 | 159 | 44.7 |
| 39 | 2019-09-28 | 1313 | 38.4 | 121 | 35.5 | #N/A | #N/A | 111 | 40.5 | 894 | 37.9 | 165 | 43.0 |
Positive Coronovirus tests
Figure 8: Positive Coronavirus (coron) Tests (%) in Canada by Region by Week of Report
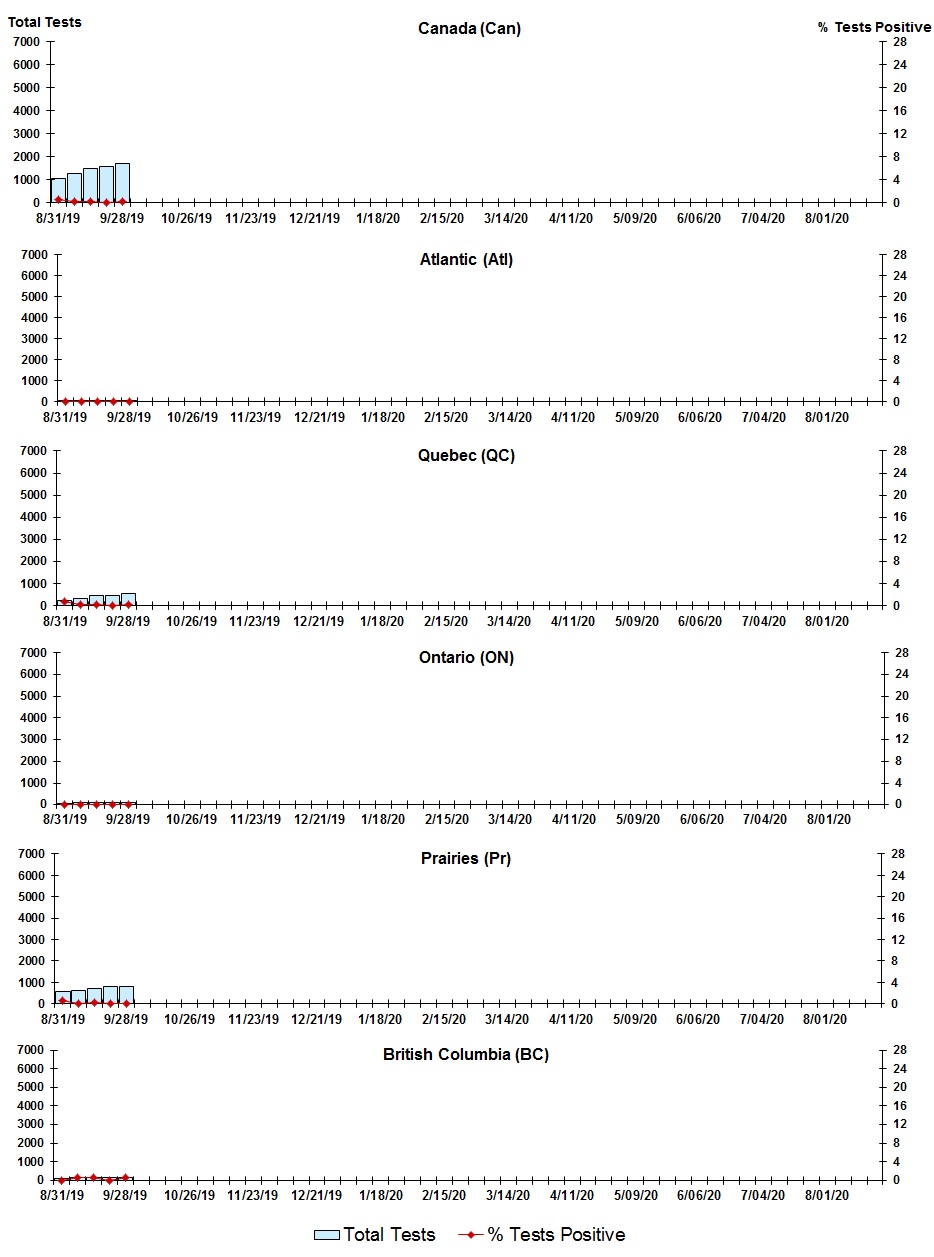
Figure 8: Positive Coronavirus (coron) Tests (%) in Canada by Region by Week of Report - Text description
| Week | Week End | Canada Tests | Coron % |
Atl Tests | Coron % |
QC Tests | Coron % |
ON Tests | Coron % |
Pr Tests | Coron % |
BC Tests | Coron % |
|---|---|---|---|---|---|---|---|---|---|---|---|---|---|
| 35 | 2019-08-31 | 1043 | 0.5 | 38 | 0.0 | 246 | 0.8 | 36 | 0.0 | 577 | 0.5 | 116 | 0.0 |
| 36 | 2019-09-07 | 1257 | 0.2 | 46 | 0.0 | 338 | 0.3 | 87 | 0.0 | 605 | 0.0 | 155 | 0.7 |
| 37 | 2019-09-14 | 1464 | 0.2 | 54 | 0.0 | 444 | 0.2 | 84 | 0.0 | 723 | 0.1 | 147 | 0.7 |
| 38 | 2019-09-21 | 1566 | 0.1 | 42 | 0.0 | 452 | 0.0 | 105 | 0.0 | 792 | 0.1 | 159 | 0.0 |
| 39 | 2019-09-28 | 1703 | 0.2 | 74 | 0.0 | 548 | 0.2 | 101 | 0.0 | 793 | 0.1 | 165 | 0.6 |