
Respiratory Virus Report, week 36 - ending September 11, 2021
Download in PDF format
(2.0 MB, 13 pages)
Organization: Public Health Agency of Canada
On this page
- Overall Summary
- List of abbreviations
- Respiratory virus detections
- Positive respiratory virus tests historical comparison
- Number of positive respiratory virus tests
- Positive influenza (Flu) tests
- Positive respiratory syncytial virus (RSV) tests
- Positive human parainfluenza virus (HPIV) tests
- Positive adenovirus (ADV) tests
- Positive human metapneumovirus (HMPV) tests
- Positive enterovirus/rhinovirus (EV/ RV) tests
- Positive human coronavirus (HCoV) tests
Overall Summary
September 5 to September 11, 2021 (week 36)
Respiratory virus detections continue to increase in Canada
- Enterovirus/rhinovirus (495 detections; 19.2% positive), respiratory syncytial virus (479 detections; 7.7% positive), and human parainfluenza virus (137 detections; 5.0% positive) are the most common seasonal respiratory viruses detected in Canada; activity of these viruses has fluctuated in recent weeks
- Activity of enterovirus/rhinovirus is slightly below expected levels
- Activity of respiratory syncytial virus is above expected levels; the majority of detections are found in Quebec
- Activity of human parainfluenza virus is above expected levels
- Detections of other respiratory viruses are low
- The number of tests performed for all viruses are above expected levels
- 32/34 sentinel laboratories reported surveillance data
Abbreviations:
- Flu
- Influenza
- A(H1)pdm09
- Influenza A(H1N1)pdm09
- A(H3)
- Influenza A(H3N2)
- A(UnS)
- Influenza A(Unsubtyped)
- RSV
- Respiratory syncytial virus
- HPIV
- Human parainfluenza virus
- HMPV
- Human metapneumovirus
- ADV
- Adenovirus
- EV/RV
- Enterovirus/Rhinovirus
- HCoV
- Human coronavirus
- Atl
- Atlantic Canada
- BC
- British Columbia
- Can
- Canada
- EORLA
- Eastern Ontario Regional Laboratory Association
- HSC
- Health Sciences Centre
- N.C.
- Data not collected
- N.R.
- Data not reported for current week
- ON
- Ontario
- PR
- Prairies
- P.H.O.L.
- Public Health Ontario Laboratory
- QC
- Quebec
- Terr
- Territories of Canada
- UHN
- University Health Network
The Respiratory Virus Detection Surveillance System collects data from select laboratories across Canada on the number of tests performed and the number of tests positive for influenza and other respiratory viruses. Data are reported on a weekly basis year-round to the Centre for Immunization and Respiratory Infectious Diseases (CIRID), Public Health Agency of Canada. These data are also summarized in the weekly FluWatch report.
In this Respiratory Virus Report, the number of detections of coronavirus reflects only seasonal human coronaviruses, not the novel pandemic coronavirus (SARS-CoV-2) that causes COVID-19. For information on COVID-19, see the Coronavirus disease (COVID-19): Outbreak update
Respiratory virus detections
Table 1: Respiratory virus detections for the week ending September 11, 2021 (surveillance week 2021-36)
| Reporting Laboratory | Flu Tested | A(H1)pdm09 Positive | A(H3) Positive | A(UnS) Positive | Total Flu A Positive | Total Flu B Positive | RSV Tested | RSV Positive | HPIV Tested | HPIV 1 Positive | HPIV 2 Positive | HPIV 3 Positive | HPIV 4 Positive | Other HPIV Positive | ADV Tested | ADV Positive | HMPV Tested | HMPV Positive | EV/RV Tested | EV/RV Positive | HCoV Tested | HCoV Positive |
|---|---|---|---|---|---|---|---|---|---|---|---|---|---|---|---|---|---|---|---|---|---|---|
| Newfoundland | 451 | 0 | 0 | 0 | 0 | 0 | 451 | 4 | 451 | 0 | 0 | 0 | 0 | 1 | 451 | 1 | 451 | 0 | 451 | 77 | N.C. | N.C. |
| Prince Edward Island | 58 | 0 | 0 | 0 | 0 | 0 | 58 | 0 | 58 | 0 | 0 | 12 | 0 | 0 | 58 | 3 | 58 | 0 | 58 | 20 | 58 | 0 |
| Nova Scotia | 41 | 0 | 0 | 0 | 0 | 0 | 41 | 0 | 36 | 0 | 2 | 3 | 0 | 0 | 36 | 0 | 36 | 0 | 36 | 4 | 36 | 0 |
| New Brunswick | 125 | 0 | 0 | 0 | 0 | 0 | 121 | 0 | 108 | 0 | 0 | 1 | 0 | 0 | 108 | 0 | 108 | 0 | 108 | 1 | 108 | 0 |
| Atlantic | 675 | 0 | 0 | 0 | 0 | 0 | 671 | 4 | 653 | 0 | 2 | 16 | 0 | 1 | 653 | 4 | 653 | 0 | 653 | 102 | 202 | 0 |
| Région Nord-Est | 463 | 0 | 0 | 0 | 0 | 0 | 127 | 39 | 0 | 0 | 0 | 0 | 0 | 0 | 0 | 0 | 0 | 0 | N.C. | N.C. | 0 | 0 |
| Québec-Chaudière-Appalaches | 29 | 0 | 0 | 0 | 0 | 0 | 62 | 22 | 25 | 0 | 0 | 3 | 0 | 0 | 25 | 1 | 25 | 0 | N.C. | N.C. | 25 | 0 |
| Centre-du-Québec | 41 | 0 | 0 | 0 | 0 | 0 | 42 | 12 | 12 | 0 | 0 | 1 | 0 | 0 | 12 | 0 | 12 | 0 | N.C. | N.C. | 12 | 0 |
| Montréal-Laval | 755 | 0 | 0 | 0 | 0 | 0 | 757 | 332 | 110 | 1 | 0 | 1 | 0 | 0 | 110 | 6 | 110 | 1 | N.C. | N.C. | 110 | 0 |
| Ouest du Québec | 45 | 0 | 0 | 0 | 0 | 0 | 45 | 10 | 2 | 0 | 0 | 0 | 0 | 0 | 0 | 0 | 2 | 0 | N.C. | N.C. | 2 | 0 |
| Montérégie | 36 | 0 | 0 | 0 | 0 | 0 | 36 | 11 | 0 | 0 | 0 | 0 | 0 | 0 | 0 | 0 | 0 | 0 | N.C. | N.C. | 0 | 0 |
| Province of Québec | 1369 | 0 | 0 | 0 | 0 | 0 | 1069 | 426 | 149 | 1 | 0 | 5 | 0 | 0 | 147 | 7 | 149 | 1 | N.C. | N.C. | 149 | 0 |
| P.H.O.L. - Ottawa | 271 | 0 | 0 | 0 | 0 | 0 | 271 | 29 | 271 | 0 | 0 | 0 | 0 | 59 | 271 | 10 | 271 | 0 | 271 | 99 | 271 | 6 |
| EORLA | 84 | 0 | 0 | 0 | 0 | 0 | 84 | 1 | 9 | 0 | 0 | 0 | 0 | 0 | 9 | 0 | 0 | 0 | 9 | 3 | 0 | 0 |
| P.H.O.L. - Kingston | 18 | 0 | 0 | 0 | 0 | 0 | 18 | 1 | 18 | 0 | 0 | 0 | 0 | 3 | 18 | 1 | 18 | 0 | 18 | 5 | 18 | 0 |
| UHN / Mount Sinai Hospital | 348 | 0 | 0 | 1 | 1 | 0 | 348 | 0 | 10 | 0 | 0 | 0 | 0 | 0 | 10 | 0 | 10 | 0 | 10 | 0 | 10 | 0 |
| P.H.O.L. - Toronto | 129 | 0 | 0 | 0 | 0 | 0 | 129 | 0 | 129 | 0 | 0 | 0 | 0 | 7 | 129 | 0 | 129 | 0 | 129 | 22 | 129 | 0 |
| Sick Kids Hospital - Toronto | N.R. | N.R. | N.R. | N.R. | N.R. | N.R. | N.R. | N.R. | N.R. | N.R. | N.R. | N.R. | N.R. | N.R. | N.R. | N.R. | N.R. | N.R. | N.R. | N.R. | N.R. | N.R. |
| Sunnybrook & Women's College HSC | N.R. | N.R. | N.R. | N.R. | N.R. | N.R. | N.R. | N.R. | N.R. | N.R. | N.R. | N.R. | N.R. | N.R. | N.R. | N.R. | N.R. | N.R. | N.R. | N.R. | N.R. | N.R. |
| P.H.O.L. - Sault Ste. Marie | 1 | 0 | 0 | 0 | 0 | 0 | 1 | 0 | 1 | 0 | 0 | 0 | 0 | 0 | 1 | 0 | 1 | 0 | 1 | 0 | 1 | 0 |
| P.H.O.L. - Timmins | 5 | 0 | 0 | 0 | 0 | 0 | 5 | 0 | 5 | 0 | 0 | 0 | 0 | 2 | 5 | 0 | 5 | 0 | 5 | 0 | 5 | 0 |
| St. Joseph's - London | 29 | 0 | 0 | 0 | 0 | 0 | 29 | 1 | 29 | 0 | 0 | 3 | 0 | 0 | 29 | 0 | 29 | 0 | 29 | 3 | 29 | 0 |
| P.H.O.L. - London | 39 | 0 | 0 | 0 | 0 | 0 | 39 | 0 | 39 | 0 | 0 | 0 | 0 | 0 | 39 | 0 | 39 | 0 | 39 | 6 | 39 | 0 |
| P.H.O.L. - Orillia | 11 | 0 | 0 | 0 | 0 | 0 | 11 | 1 | 11 | 0 | 0 | 0 | 0 | 0 | 11 | 0 | 11 | 0 | 11 | 3 | 11 | 0 |
| P.H.O.L. - Thunder Bay | 3 | 0 | 0 | 0 | 0 | 0 | 3 | 0 | 3 | 0 | 0 | 0 | 0 | 0 | 3 | 0 | 3 | 0 | 3 | 0 | 3 | 0 |
| P.H.O.L. - Sudbury | 9 | 0 | 0 | 0 | 0 | 0 | 9 | 0 | 9 | 0 | 0 | 0 | 0 | 0 | 9 | 0 | 9 | 0 | 9 | 1 | 9 | 0 |
| P.H.O.L. - Hamilton | 19 | 0 | 0 | 0 | 0 | 0 | 19 | 0 | 19 | 0 | 0 | 0 | 0 | 0 | 19 | 0 | 19 | 4 | 19 | 5 | 19 | 0 |
| P.H.O.L. - Peterborough | 9 | 0 | 0 | 0 | 0 | 0 | 9 | 0 | 9 | 0 | 0 | 0 | 0 | 0 | 9 | 0 | 9 | 0 | 9 | 2 | 9 | 0 |
| St. Joseph's - Hamilton | 218 | 0 | 0 | 0 | 0 | 0 | 212 | 4 | 212 | 0 | 0 | 16 | 0 | 0 | 212 | 2 | 212 | 0 | 212 | 19 | 0 | 0 |
| Province of Ontario | 1193 | 0 | 0 | 1 | 1 | 0 | 1187 | 37 | 774 | 0 | 0 | 19 | 0 | 71 | 774 | 13 | 765 | 4 | 774 | 168 | 553 | 6 |
| Province of Manitoba | 1291 | 0 | 0 | 0 | 0 | 0 | 1291 | 2 | 19 | 0 | 0 | 0 | 0 | 0 | 19 | 0 | 79 | 1 | 19 | 1 | 79 | 0 |
| Province of Saskatchewan | 68 | 0 | 0 | 0 | 0 | 0 | 68 | 1 | 73 | 0 | 0 | 1 | 1 | 0 | 73 | 2 | 73 | 0 | 73 | 15 | 73 | 0 |
| Province of Alberta | 1607 | 0 | 0 | 0 | 0 | 0 | 761 | 2 | 761 | 0 | 1 | 11 | 0 | 0 | 761 | 5 | 761 | 0 | 761 | 155 | 761 | 7 |
| Prairies | 2966 | 0 | 0 | 0 | 0 | 0 | 2120 | 5 | 853 | 0 | 1 | 12 | 1 | 0 | 853 | 7 | 913 | 1 | 853 | 171 | 913 | 7 |
| British Columbia | 930 | 0 | 0 | 0 | 0 | 0 | 930 | 5 | 308 | 0 | 0 | 7 | 0 | 1 | 308 | 3 | 308 | 0 | 302 | 54 | 298 | 0 |
| Yukon | 165 | 0 | 0 | 0 | 0 | 0 | 237 | 2 | N.C. | N.C. | N.C. | N.C. | N.C. | N.C. | N.C. | N.C. | N.C. | N.C. | N.C. | N.C. | N.C. | N.C. |
| Northwest Territories | 6 | 0 | 0 | 0 | 0 | 0 | 3 | 0 | 3 | 0 | 0 | 0 | 0 | 0 | 3 | 0 | 3 | 0 | 3 | 0 | 3 | 0 |
| Nunavut | 0 | 0 | 0 | 0 | 0 | 0 | 0 | 0 | 0 | 0 | 0 | 0 | 0 | 0 | 0 | 0 | 0 | 0 | 0 | 0 | 0 | 0 |
| Territories | 171 | 0 | 0 | 0 | 0 | 0 | 240 | 2 | 3 | 0 | 0 | 0 | 0 | 0 | 3 | 0 | 3 | 0 | 3 | 0 | 3 | 0 |
| CANADA | 7304 | 0 | 0 | 1 | 1 | 0 | 6217 | 479 | 2740 | 1 | 3 | 59 | 1 | 73 | 2738 | 34 | 2791 | 6 | 2585 | 495 | 2118 | 13 |
The data in the RVDSS report represent surveillance data available at the time of writing. Data missing from the current week are denoted by N.R. Data not collected by reporting lab denoted by N.C.
The reporting laboratory previously listed as CHEO - Ottawa is now listed as EORLA to better reflect data submitted by this provider.
Specimens from Yukon (YT), Northwest Territories (NT) and Nunavut (NU) are sent to reference laboratories in other provinces and reported results reflect specimens identified as originating from YT, NT or NU.
Results from British Columbia comprise of specimens from the following sites: BC Children's and Women's Hospital, Children's and Women's Hospital Laboratory, Fraser Health Medical Microbiology Laboratory, Island Health, Providence Health Care, Powell River Hospital, St. Paul's Hospital, Vancouver General Hospital, Victoria General Hospital, BCCDC Public Health Laboratory, Interior Health Authority sites and Northern Health Authority sites.
Delays in the reporting of data may cause data to change retrospectively.
Influenza co-detections may cause the sum of A(H1)pdm09, A(H3), and A(UnS) positive results to exceed the sum of Total Flu A Positive results.
Table 2: Cumulative respiratory virus detections from August 29, 2021 to September 11, 2021 (surveillance week 2021-35 to 2021-36)
| Reporting Laboratory | Flu Tested | A(H1)pdm09 Positive | A(H3) Positive | A(UnS) Positive | Total Flu A Positive | Total Flu B Positive | RSV Tested | RSV Positive | HPIV Tested | HPIV 1 Positive | HPIV 2 Positive | HPIV 3 Positive | HPIV 4 Positive | Other HPIV Positive | ADV Tested | ADV Positive | HMPV Tested | HMPV Positive | EV/RV Tested | EV/RV Positive | HCoV Tested | HCoV Positive |
|---|---|---|---|---|---|---|---|---|---|---|---|---|---|---|---|---|---|---|---|---|---|---|
| Newfoundland | 933 | 0 | 0 | 0 | 0 | 0 | 933 | 4 | 933 | 0 | 0 | 1 | 0 | 3 | 933 | 5 | 933 | 0 | 933 | 180 | N.C. | N.C. |
| Prince Edward Island | 111 | 0 | 0 | 0 | 0 | 0 | 111 | 0 | 111 | 0 | 0 | 14 | 0 | 0 | 111 | 5 | 111 | 0 | 111 | 38 | 111 | 0 |
| Nova Scotia | 87 | 0 | 0 | 0 | 0 | 0 | 87 | 0 | 74 | 0 | 2 | 6 | 0 | 0 | 74 | 0 | 74 | 0 | 74 | 6 | 74 | 0 |
| New Brunswick | 169 | 0 | 0 | 0 | 0 | 0 | 153 | 0 | 115 | 0 | 0 | 1 | 0 | 0 | 108 | 0 | 115 | 0 | 115 | 1 | 115 | 0 |
| Atlantic | 1300 | 0 | 0 | 0 | 0 | 0 | 1284 | 4 | 1233 | 0 | 2 | 22 | 0 | 3 | 1226 | 10 | 1233 | 0 | 1233 | 225 | 300 | 0 |
| Région Nord-Est | 666 | 0 | 0 | 0 | 0 | 0 | 153 | 47 | 0 | 0 | 0 | 0 | 0 | 0 | 0 | 0 | 0 | 0 | N.C. | N.C. | 0 | 0 |
| Québec-Chaudière-Appalaches | 58 | 0 | 0 | 0 | 0 | 0 | 112 | 29 | 53 | 0 | 0 | 3 | 0 | 0 | 53 | 1 | 53 | 0 | N.C. | N.C. | 53 | 0 |
| Centre-du-Québec | 51 | 0 | 0 | 0 | 0 | 0 | 53 | 15 | 23 | 0 | 0 | 6 | 0 | 0 | 23 | 0 | 23 | 0 | N.C. | N.C. | 23 | 0 |
| Montréal-Laval | 1316 | 0 | 0 | 1 | 1 | 0 | 1318 | 556 | 208 | 1 | 0 | 3 | 0 | 0 | 208 | 12 | 208 | 4 | N.C. | N.C. | 208 | 0 |
| Ouest du Québec | 69 | 0 | 0 | 0 | 0 | 0 | 69 | 20 | 3 | 0 | 0 | 0 | 0 | 0 | 0 | 0 | 3 | 0 | N.C. | N.C. | 3 | 0 |
| Montérégie | 57 | 0 | 0 | 0 | 0 | 0 | 57 | 22 | 0 | 0 | 0 | 0 | 0 | 0 | 0 | 0 | 0 | 0 | N.C. | N.C. | 0 | 0 |
| Province of Québec | 2217 | 0 | 0 | 1 | 1 | 0 | 1762 | 689 | 287 | 1 | 0 | 12 | 0 | 0 | 284 | 13 | 287 | 4 | N.C. | N.C. | 287 | 0 |
| P.H.O.L. - Ottawa | 569 | 0 | 0 | 0 | 0 | 0 | 569 | 43 | 569 | 0 | 0 | 0 | 0 | 130 | 569 | 20 | 569 | 2 | 569 | 228 | 569 | 16 |
| EORLA | 173 | 0 | 0 | 0 | 0 | 0 | 173 | 4 | 34 | 0 | 0 | 2 | 0 | 0 | 34 | 0 | 0 | 0 | 34 | 6 | 25 | 1 |
| P.H.O.L. - Kingston | 46 | 0 | 0 | 0 | 0 | 0 | 46 | 1 | 46 | 0 | 0 | 0 | 0 | 11 | 46 | 3 | 46 | 0 | 46 | 15 | 46 | 0 |
| UHN / Mount Sinai Hospital | 748 | 0 | 0 | 1 | 1 | 0 | 748 | 0 | 26 | 0 | 0 | 0 | 0 | 0 | 26 | 0 | 26 | 0 | 26 | 1 | 26 | 0 |
| P.H.O.L. - Toronto | 281 | 0 | 0 | 0 | 0 | 0 | 281 | 1 | 281 | 0 | 0 | 0 | 0 | 19 | 281 | 1 | 281 | 0 | 281 | 45 | 281 | 0 |
| Sick Kids Hospital - Toronto | 28 | 0 | 0 | 0 | 0 | 0 | 0 | 0 | 28 | 0 | 0 | 1 | 0 | 0 | 28 | 0 | 28 | 0 | 28 | 11 | 28 | 0 |
| Sunnybrook & Women's College HSC | 0 | 0 | 0 | 0 | 0 | 0 | 0 | 0 | 0 | 0 | 0 | 0 | 0 | 0 | 0 | 0 | 0 | 0 | 0 | 0 | 0 | 0 |
| P.H.O.L. - Sault Ste. Marie | 3 | 0 | 0 | 0 | 0 | 0 | 3 | 0 | 3 | 0 | 0 | 0 | 0 | 0 | 3 | 0 | 3 | 0 | 3 | 0 | 3 | 0 |
| P.H.O.L. - Timmins | 10 | 0 | 0 | 0 | 0 | 0 | 10 | 0 | 10 | 0 | 0 | 0 | 0 | 2 | 10 | 0 | 10 | 0 | 10 | 0 | 10 | 0 |
| St. Joseph's - London | 46 | 0 | 0 | 0 | 0 | 0 | 46 | 1 | 46 | 0 | 0 | 4 | 0 | 0 | 46 | 0 | 46 | 0 | 46 | 6 | 46 | 0 |
| P.H.O.L. - London | 64 | 0 | 0 | 0 | 0 | 0 | 64 | 0 | 64 | 0 | 0 | 0 | 0 | 1 | 64 | 0 | 64 | 0 | 64 | 9 | 64 | 0 |
| P.H.O.L. - Orillia | 26 | 0 | 0 | 0 | 0 | 0 | 26 | 1 | 26 | 0 | 0 | 0 | 0 | 0 | 26 | 0 | 26 | 0 | 26 | 8 | 26 | 0 |
| P.H.O.L. - Thunder Bay | 19 | 0 | 0 | 0 | 0 | 0 | 19 | 0 | 19 | 0 | 0 | 0 | 0 | 0 | 19 | 0 | 19 | 0 | 19 | 9 | 19 | 0 |
| P.H.O.L. - Sudbury | 17 | 0 | 0 | 0 | 0 | 0 | 17 | 0 | 17 | 0 | 0 | 0 | 0 | 0 | 17 | 0 | 17 | 0 | 17 | 2 | 17 | 0 |
| P.H.O.L. - Hamilton | 24 | 0 | 0 | 0 | 0 | 0 | 24 | 0 | 24 | 0 | 0 | 0 | 0 | 1 | 24 | 0 | 24 | 4 | 24 | 5 | 24 | 0 |
| P.H.O.L. - Peterborough | 16 | 0 | 0 | 0 | 0 | 0 | 16 | 0 | 16 | 0 | 0 | 0 | 0 | 1 | 16 | 0 | 16 | 0 | 16 | 3 | 16 | 0 |
| St. Joseph's - Hamilton | 430 | 0 | 0 | 0 | 0 | 0 | 424 | 5 | 424 | 0 | 0 | 41 | 0 | 0 | 424 | 2 | 424 | 1 | 424 | 48 | 0 | 0 |
| Province of Ontario | 2500 | 0 | 0 | 1 | 1 | 0 | 2466 | 56 | 1633 | 0 | 0 | 48 | 0 | 165 | 1633 | 26 | 1599 | 7 | 1633 | 396 | 1200 | 17 |
| Manitoba | 2464 | 0 | 0 | 0 | 0 | 0 | 2464 | 2 | 42 | 0 | 0 | 0 | 0 | 0 | 42 | 1 | 155 | 1 | 42 | 16 | 155 | 0 |
| Province of Saskatchewan | 122 | 0 | 0 | 0 | 0 | 0 | 122 | 1 | 142 | 0 | 0 | 1 | 1 | 0 | 142 | 2 | 142 | 0 | 142 | 34 | 142 | 0 |
| Province of Alberta | 3222 | 0 | 0 | 1 | 1 | 0 | 1402 | 3 | 1402 | 0 | 1 | 20 | 5 | 0 | 1402 | 8 | 1402 | 0 | 1402 | 280 | 1402 | 15 |
| Prairies | 5808 | 0 | 0 | 1 | 1 | 0 | 3988 | 6 | 1586 | 0 | 1 | 21 | 6 | 0 | 1586 | 11 | 1699 | 1 | 1586 | 330 | 1699 | 15 |
| British Columbia | 1955 | 0 | 0 | 1 | 1 | 0 | 1955 | 8 | 623 | 0 | 0 | 11 | 0 | 2 | 623 | 4 | 623 | 0 | 613 | 98 | 609 | 2 |
| Yukon | 361 | 0 | 0 | 0 | 0 | 0 | 433 | 2 | N.C. | N.C. | N.C. | N.C. | N.C. | N.C. | N.C. | N.C. | N.C. | N.C. | N.C. | N.C. | N.C. | N.C. |
| Northwest Territories | 13 | 0 | 0 | 0 | 0 | 0 | 9 | 0 | 9 | 0 | 0 | 0 | 0 | 0 | 9 | 1 | 9 | 0 | 9 | 2 | 9 | 0 |
| Nunavut | 2 | 0 | 0 | 0 | 0 | 0 | 2 | 0 | 2 | 0 | 0 | 0 | 0 | 0 | 2 | 0 | 2 | 0 | 2 | 0 | 2 | 0 |
| Territories | 376 | 0 | 0 | 0 | 0 | 0 | 444 | 2 | 11 | 0 | 0 | 0 | 0 | 0 | 11 | 1 | 11 | 0 | 11 | 2 | 11 | 0 |
| CANADA | 14156 | 0 | 0 | 4 | 4 | 0 | 11899 | 765 | 5373 | 1 | 3 | 114 | 6 | 170 | 5363 | 65 | 5452 | 12 | 5076 | 1051 | 4106 | 34 |
The data in the RVDSS report represent surveillance data available at the time of writing. Data not collected by reporting lab denoted by N.C.
Specimens from Yukon (YT), Northwest Territories (NT) and Nunavut (NU) are sent to reference laboratories in other provinces and reported results reflect specimens identified as originating from YT, NT or NU.
The reporting laboratory previously listed as CHEO - Ottawa is now listed as EORLA to better reflect data submitted by this provider.
Results from British Columbia comprise of specimens from the following sites: BC Children's and Women's Hospital, Children's and Women's Hospital Laboratory, Fraser Health Medical Microbiology Laboratory, Island Health, Providence Health Care, Powell River Hospital, St. Paul's Hospital, Vancouver General Hospital, Victoria General Hospital, BCCDC Public Health Laboratory, Interior Health Authority sites and Northern Health Authority sites.
Delays in the reporting of data may cause data to change retrospectively. Due to these delays, the sum of weekly report totals do not add up to cumulative totals.
Influenza co-detections may cause the sum of A(H1N1)pdm09, A(H3), and A(UnS) positive results to exceed the sum of Total Flu A Positive results.
Positive respiratory virus tests historical comparison
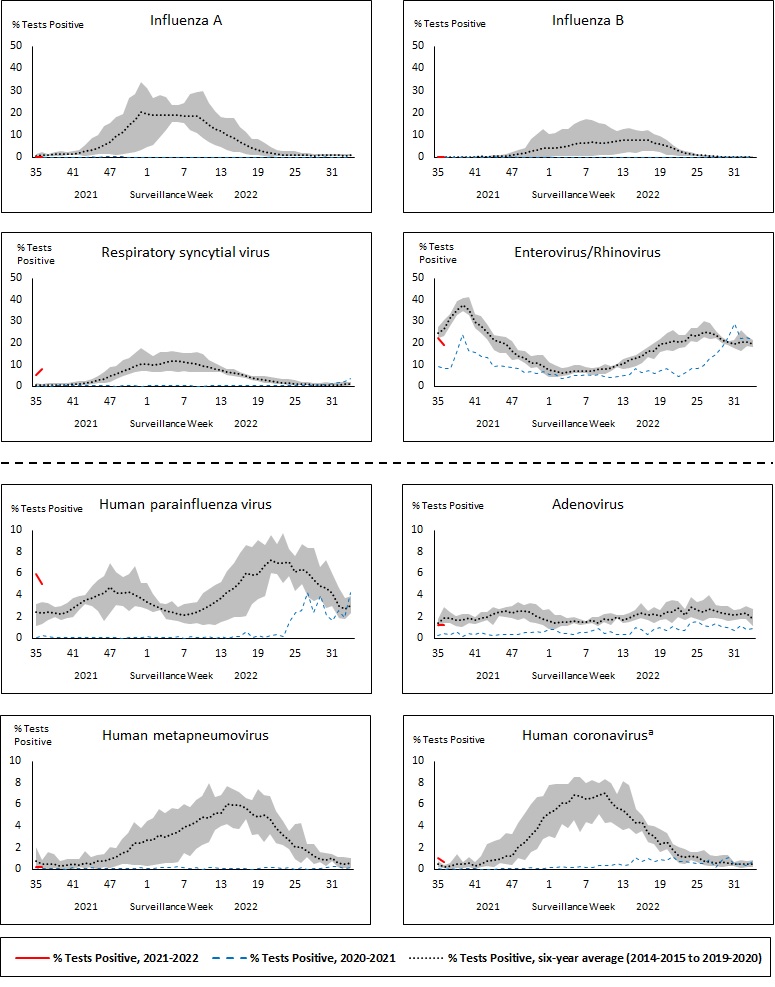
Shaded area represents the maximum and minimum % of respiratory virus tests positive reported by week from seasons 2014-2015 to 2019-2020
Note: Data from week 11 of the 2019-2020 season onwards is excluded from the historical comparison due to the COVID-19 pandemic
Note: % Tests Positive scale changes across the dashed line
a Human coronavirus excludes human coronaviruses SARS-CoV, MERS-CoV and SARS-CoV-2; Includes seasonal human coronaviruses HCoV-229E, HCoV-OC43, HCoV-NL63, HCoV-HKU1.
Figure 1: Positive respiratory virus tests (%) reported by participating laboratories in Canada by surveillance week compared to average and range from 2014-2015 to 2019-2020 season
| Week | Week end | 2021-2022 A% | 2020-2021 A% | Max A% Base | Min A% Base | Av A% Base | 2021-2022 B% | 2020-2021 B% | Max B% Base | Min B% Base | Av B% Base | 2021-2022 RSV% | 2020-2021 RSV% | Max RSV% Base | Min RSV% Base | Av RSV% Base | 2021-2022 HPIV% | 2020-2021 HPIV% | Max HPIV% Base | Min HPIV% Base | Av HPIV% Base | 2021-2022 ADV% | 2020-2021 ADV% | Max ADV% Base | Min ADV% Base | Av ADV% Base | 2021-2022 HMPV% | 2020-2021 HMPV% | Max HMPV% Base | Min HMPV% Base | Av HMPV% Base | 2021-2022 EV/RV% | 2020-2021 EV/RV% | Max EV/RV% Base | Min EV/RV% Base | Av EV/RV% Base | 2021-2022 HCoV% | 2020-2021 HCoV% | Max HCoV% Base | Min HCoV% Base | Av HCoV% Base |
|---|---|---|---|---|---|---|---|---|---|---|---|---|---|---|---|---|---|---|---|---|---|---|---|---|---|---|---|---|---|---|---|---|---|---|---|---|---|---|---|---|---|
| 35 | 2021-09-04 | 0.04 | 0.00 | 1.60 | 0.11 | 0.68 | 0.00 | 0.02 | 0.28 | 0.00 | 0.13 | 5.03 | 0.02 | 1.34 | 0.38 | 0.60 | 5.96 | 0.08 | 3.16 | 1.15 | 2.42 | 1.18 | 0.27 | 1.74 | 0.99 | 1.43 | 0.23 | 0.17 | 2.04 | 0.10 | 0.77 | 22.32 | 9.07 | 27.19 | 22.44 | 24.78 | 1.06 | 0.06 | 0.76 | 0.18 | 0.45 |
| 36 | 2021-09-11 | 0.01 | 0.00 | 2.11 | 0.23 | 0.98 | 0.00 | 0.00 | 0.55 | 0.00 | 0.15 | 7.70 | 0.04 | 1.09 | 0.22 | 0.57 | 5.00 | 0.20 | 3.31 | 1.35 | 2.32 | 1.24 | 0.40 | 2.85 | 1.42 | 1.87 | 0.21 | 0.06 | 0.84 | 0.10 | 0.48 | 19.15 | 8.13 | 30.69 | 23.30 | 26.31 | 0.61 | 0.00 | 0.38 | 0.12 | 0.22 |
Number of positive respiratory virus tests
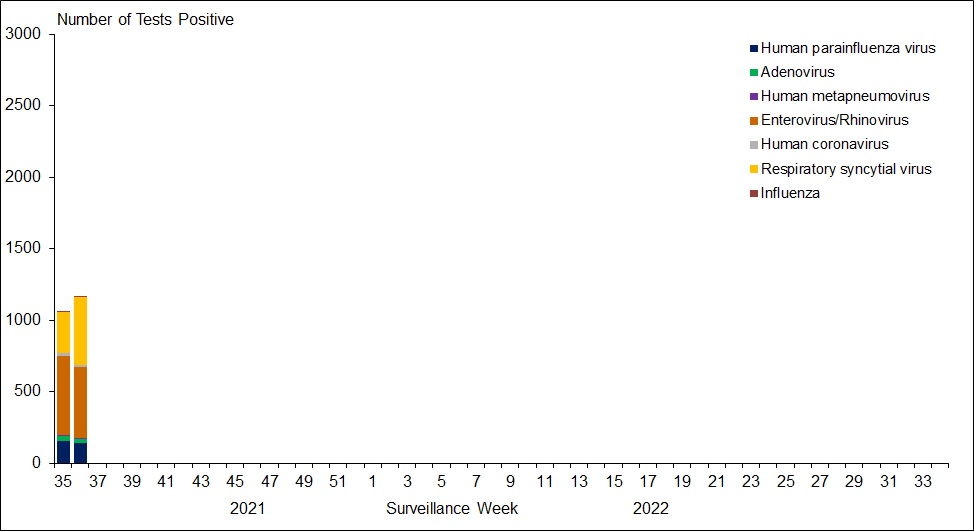
Figure 2: Number of positive respiratory virus tests reported by participating laboratories in Canada by surveillance week
| Week | ParaInfluenza | Adenovirus | Human metapneumovirus | Enterovirus/Rhinovirus | Coronavirus | Respiratory syncytial virus | Influenza |
|---|---|---|---|---|---|---|---|
| 35 | 157 | 31 | 6 | 556 | 21 | 286 | 3 |
| 36 | 137 | 34 | 6 | 495 | 13 | 479 | 1 |
Positive influenza (Flu) tests
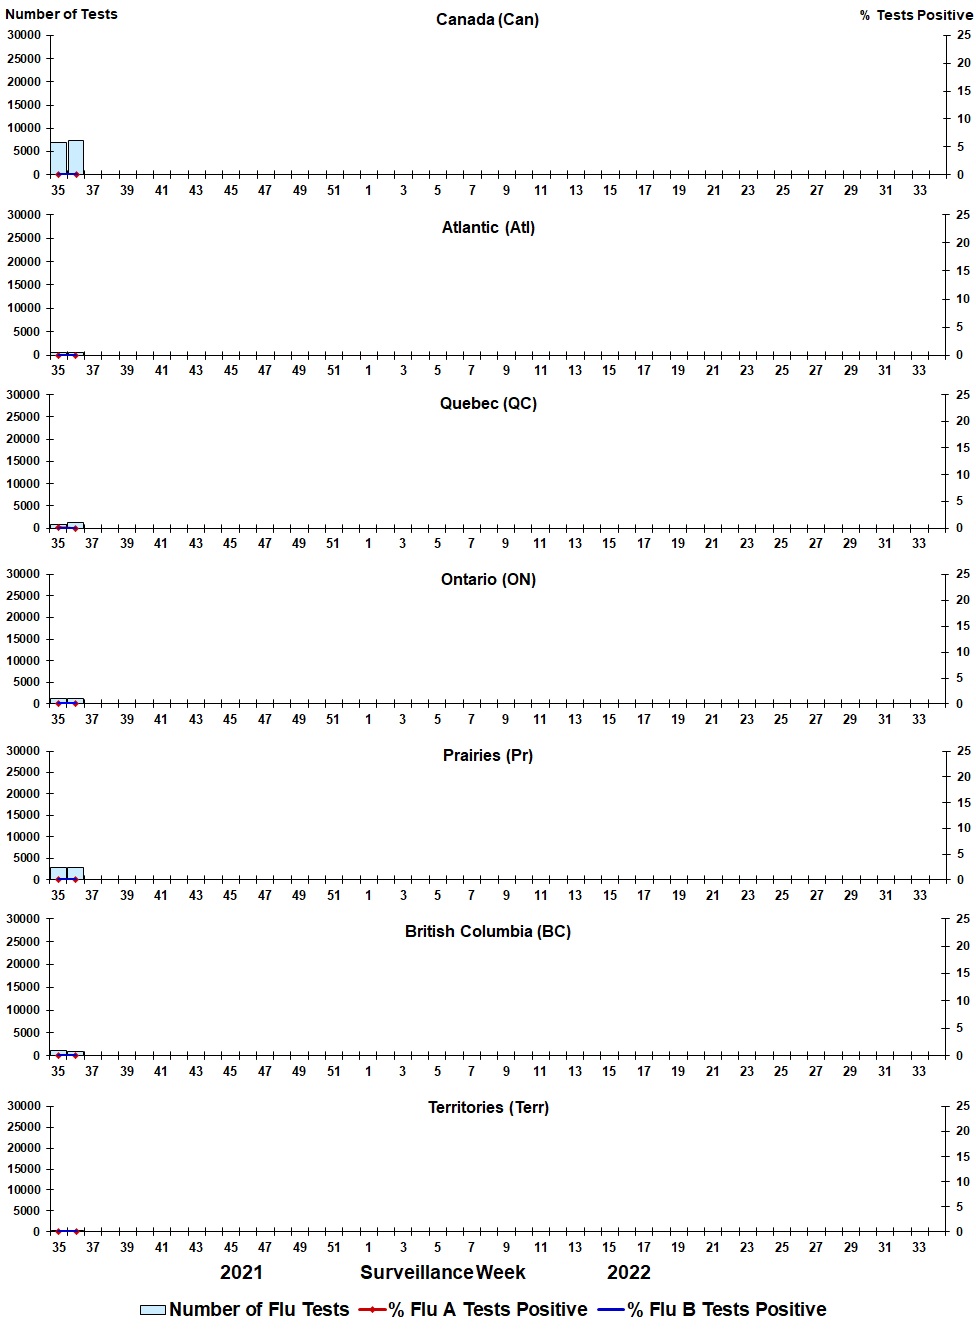
Figure 3: Positive influenza (Flu) tests (%) in Canada by region by surveillance week
| Week | Week end | Can Tests | Can A% | Can B% | Atl Tests | Atl A% | Atl B% | QC Tests | QC A% | QC B% | ON Tests | ON A% | ON B% | Pr Tests | Pr A% | Pr B% | BC Tests | BC A% | BC B% | Terr Tests | Terr A% | Terr B% |
|---|---|---|---|---|---|---|---|---|---|---|---|---|---|---|---|---|---|---|---|---|---|---|
| 35 | 2021-09-04 | 6852 | 0.04 | 0.00 | 625 | 0.00 | 0.00 | 848 | 0.12 | 0.00 | 1307 | 0.00 | 0.00 | 2842 | 0.04 | 0.00 | 1025 | 0.10 | 0.00 | 205 | 0.00 | 0.00 |
| 36 | 2021-09-11 | 7304 | 0.01 | 0.00 | 675 | 0.00 | 0.00 | 1369 | 0.00 | 0.00 | 1193 | 0.08 | 0.00 | 2966 | 0.00 | 0.00 | 930 | 0.00 | 0.00 | 171 | 0.00 | 0.00 |
Positive respiratory syncytial virus (RSV) tests
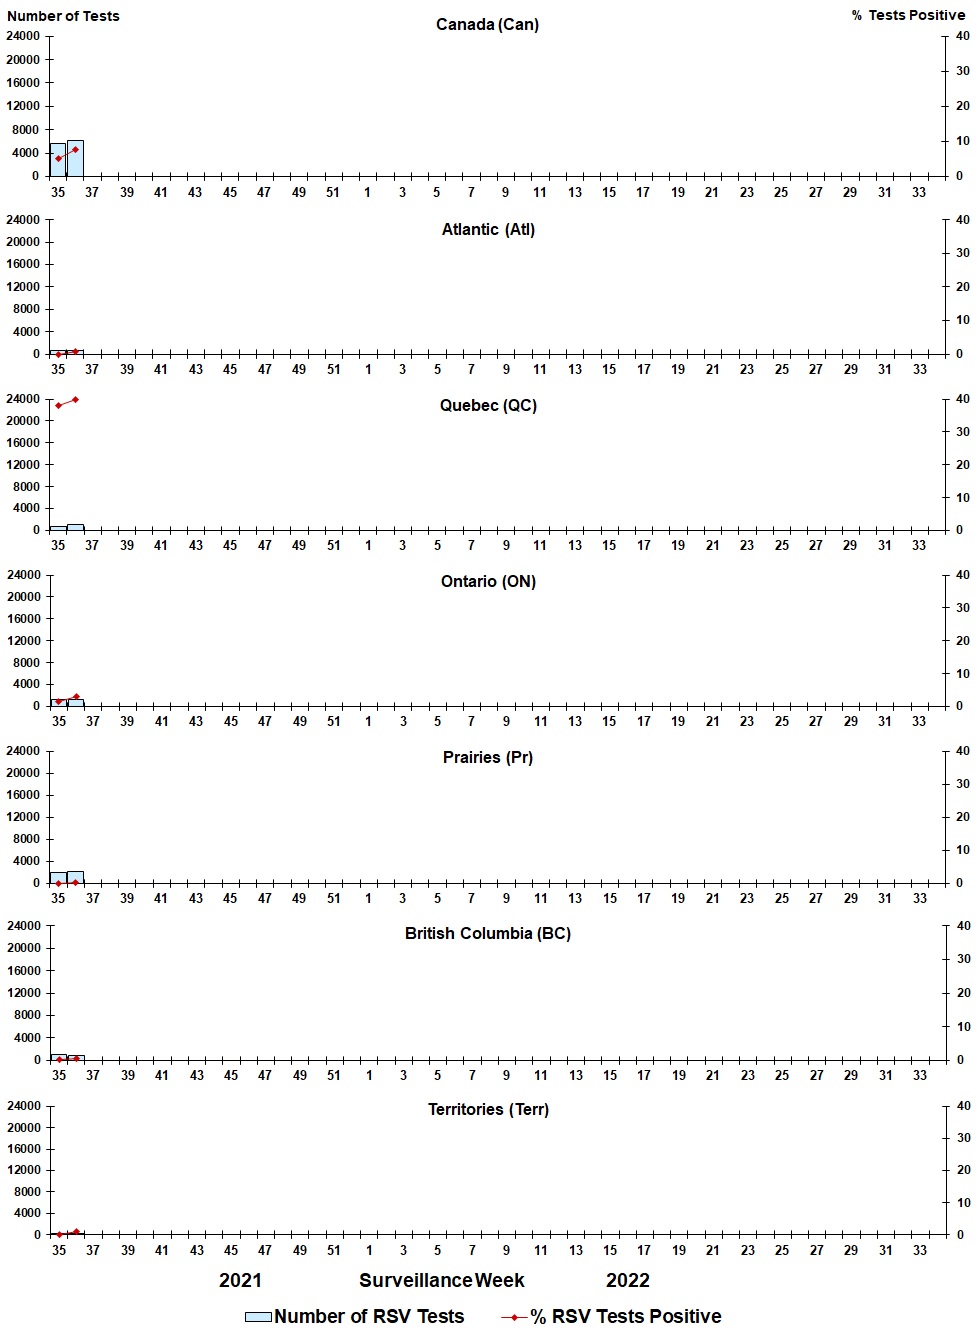
Figure 4: Positive respiratory syncytial virus (RSV) tests (%) in Canada by region by surveillance week
| Week | Week end | Can Tests | RSV% | Atl Tests | RSV% | QC Tests | RSV% | ON Tests | RSV% | Pr Tests | RSV% | BC Tests | RSV% | Terr Tests | RSV% |
|---|---|---|---|---|---|---|---|---|---|---|---|---|---|---|---|
| 35 | 2021-09-04 | 5682 | 5.03 | 613 | 0.00 | 693 | 37.95 | 1279 | 1.49 | 1868 | 0.05 | 1025 | 0.29 | 204 | 0.00 |
| 36 | 2021-09-11 | 6217 | 7.70 | 671 | 0.60 | 1069 | 39.85 | 1187 | 3.12 | 2120 | 0.24 | 930 | 0.54 | 240 | 0.83 |
Positive human parainfluenza virus (HPIV) tests
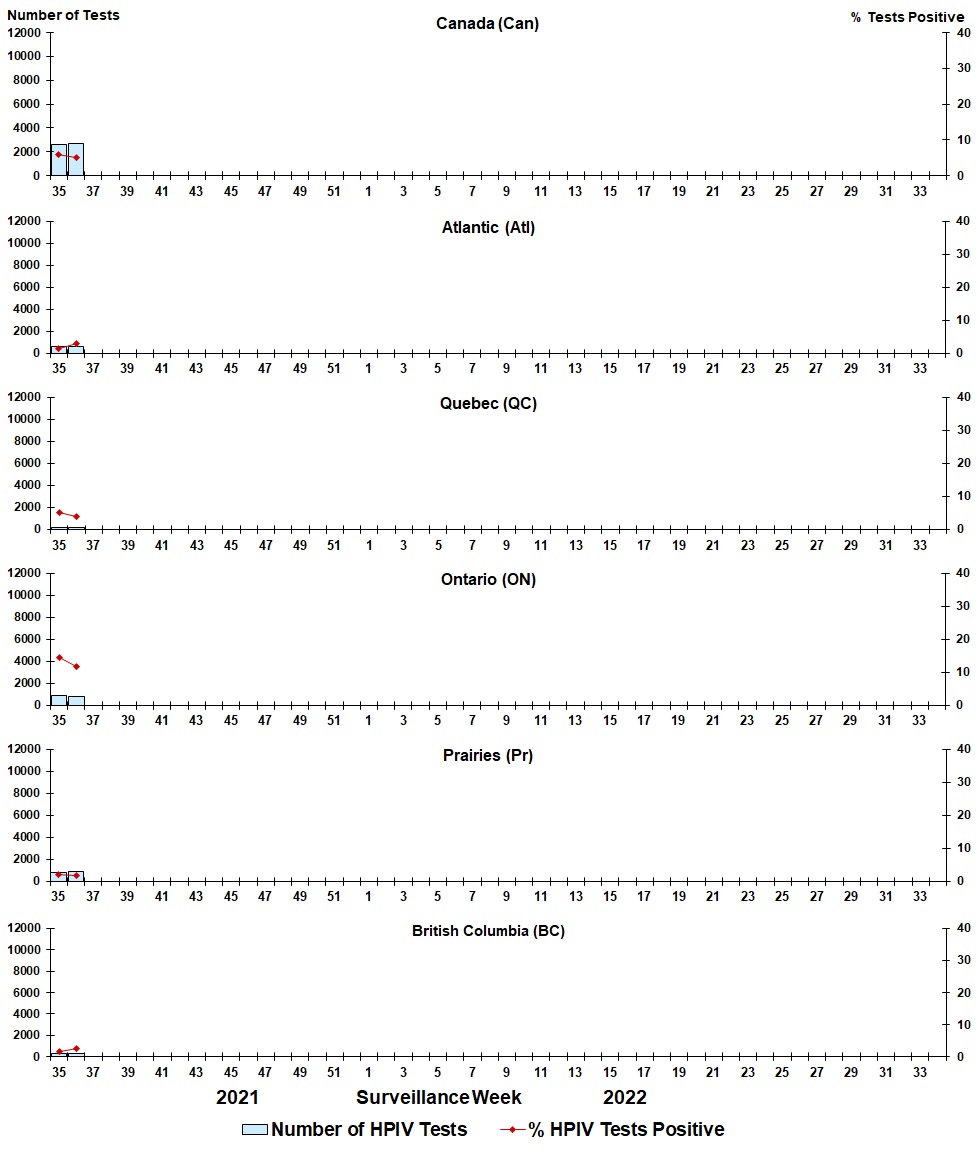
Figure 5: Positive human parainfluenza virus (HPIV) tests (%) in Canada by region by surveillance week
| Week | Week End | Can Tests | HPIV% | Atl Tests | HPIV% | QC Tests | HPIV% | ON Tests | HPIV% | Pr Tests | HPIV% | BC Tests | HPIV% |
|---|---|---|---|---|---|---|---|---|---|---|---|---|---|
| 35 | 2021-09-04 | 2633 | 5.96 | 580 | 1.38 | 138 | 5.07 | 859 | 14.32 | 733 | 1.91 | 315 | 1.59 |
| 36 | 2021-09-11 | 2740 | 5.00 | 653 | 2.91 | 149 | 4.03 | 774 | 11.63 | 853 | 1.64 | 306 | 2.61 |
Positive adenovirus (ADV) tests
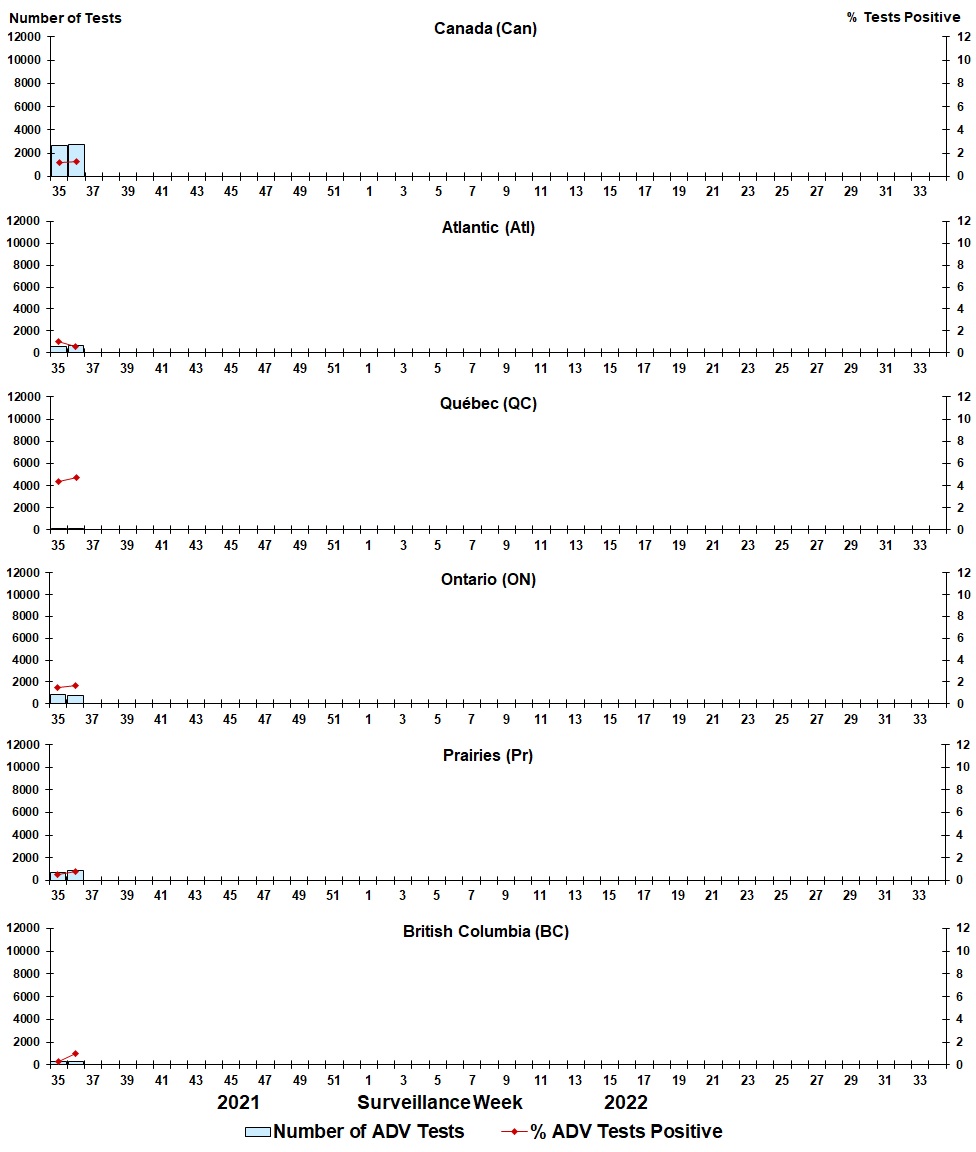
Figure 6: Positive adenovirus (ADV) tests (%) in Canada by region by surveillance week
| Week | Week End | Can Tests | ADV% | Atl Tests | ADV% | QC Tests | ADV% | ON Tests | ADV% | Pr Tests | ADV% | BC Tests | ADV% |
|---|---|---|---|---|---|---|---|---|---|---|---|---|---|
| 35 | 2021-09-04 | 2625 | 1.18 | 573 | 1.05 | 137 | 4.38 | 859 | 1.51 | 733 | 0.55 | 315 | 0.32 |
| 36 | 2021-09-11 | 2738 | 1.24 | 653 | 0.61 | 147 | 4.76 | 774 | 1.68 | 853 | 0.82 | 306 | 0.98 |
Positive human metapneumovirus (HMPV) tests
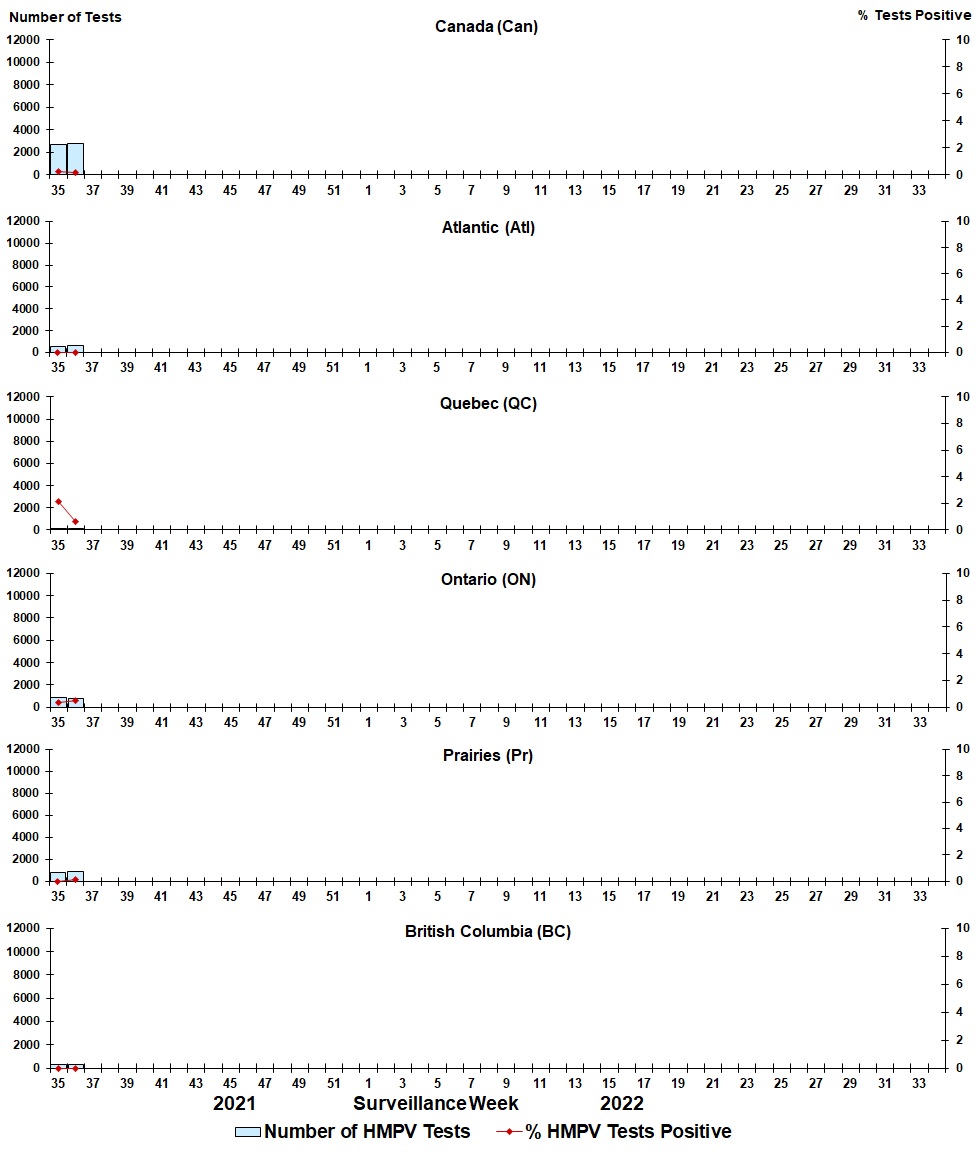
Figure 7: Positive human metapneumovirus (HMPV) tests (%) in Canada by region by surveillance week
| Week | Week End | Can Tests | HMPV% | Atl Tests | HMPV% | QC Tests | HMPV% | ON Tests | HMPV% | Pr Tests | HMPV% | BC Tests | HMPV% |
|---|---|---|---|---|---|---|---|---|---|---|---|---|---|
| 35 | 2021-09-04 | 2661 | 0.23 | 580 | 0.00 | 138 | 2.17 | 834 | 0.36 | 786 | 0.00 | 315 | 0.00 |
| 36 | 2021-09-11 | 2791 | 0.21 | 653 | 0.00 | 149 | 0.67 | 765 | 0.52 | 913 | 0.11 | 306 | 0.00 |
Positive enterovirus/rhinovirus (EV/RV) tests
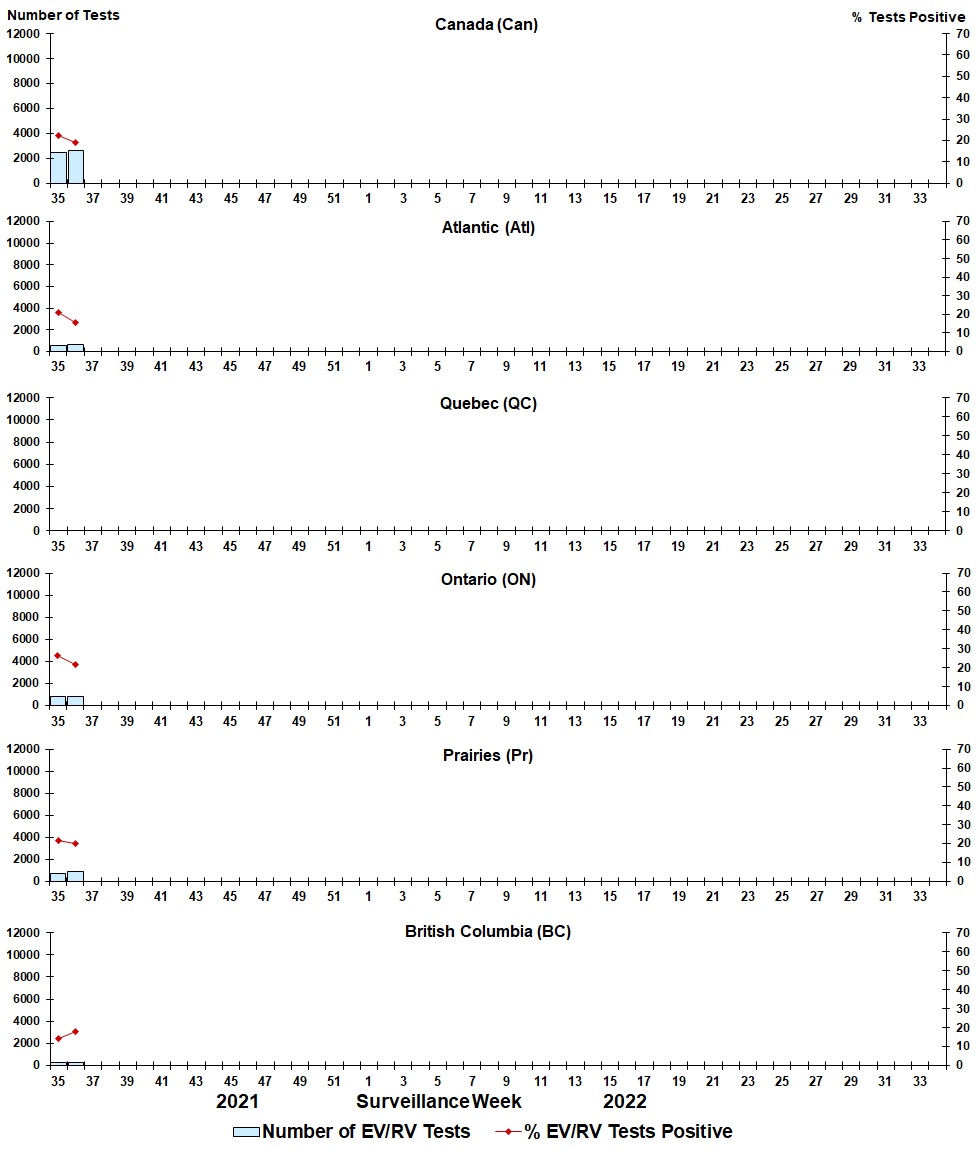
Figure 8: Positive enterovirus/rhinovirus (EV/RV) tests (%) in Canada by region by surveillance week
| Week | Week End | Can Tests | EV/RV% | Atl Tests | EV/RV% | QC Tests | EV/RV% | ON Tests | EV/RV% | Pr Tests | EV/RV% | BC Tests | EV/RV% |
|---|---|---|---|---|---|---|---|---|---|---|---|---|---|
| 35 | 2021-09-04 | 2491 | 22.32 | 580 | 21.21 | N.A. | N.A. | 859 | 26.54 | 733 | 21.69 | 311 | 14.15 |
| 36 | 2021-09-11 | 2585 | 19.15 | 653 | 15.62 | N.A. | N.A. | 774 | 21.71 | 853 | 20.05 | 300 | 18.00 |
Positive human coronavirus (HCoV) tests
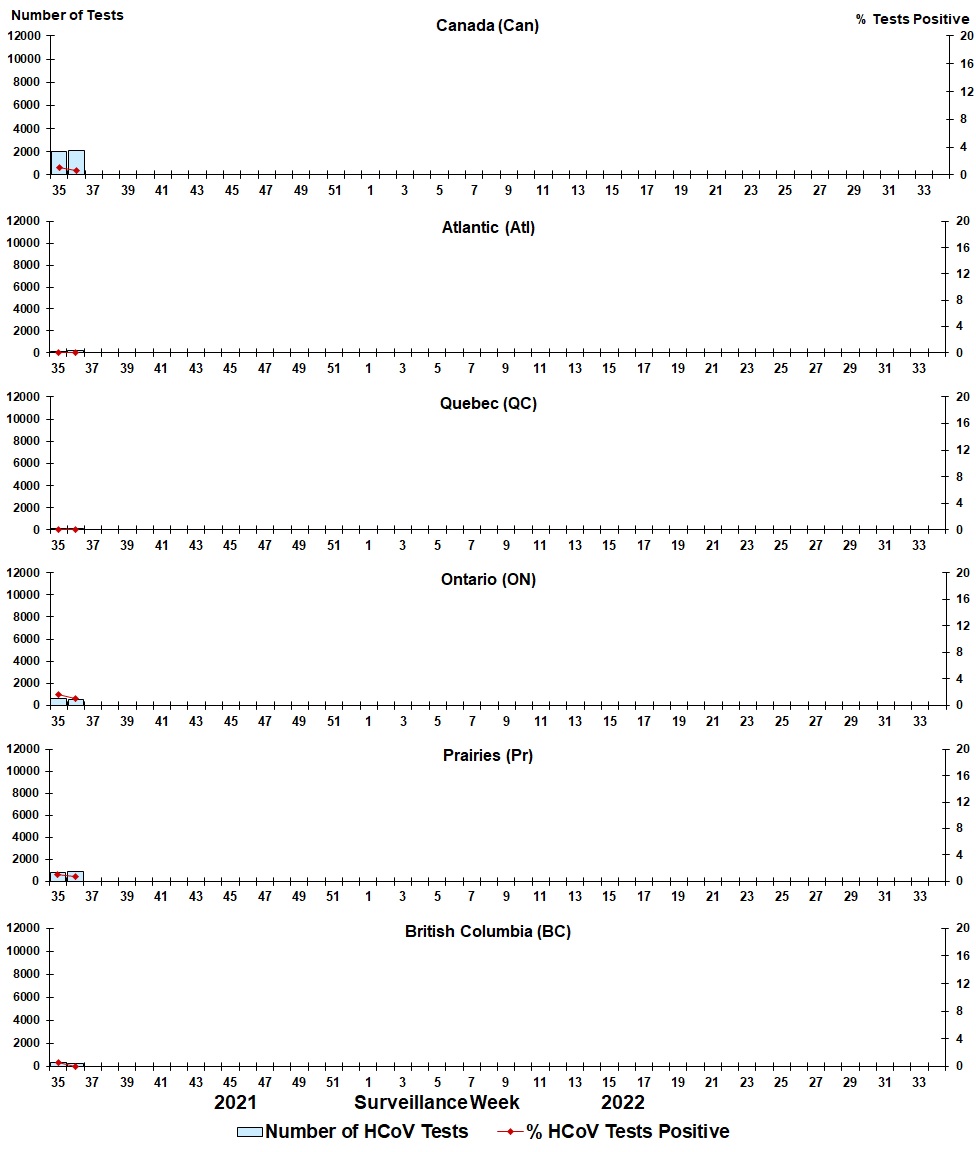
Figure 9: Positive human coronavirus (HCoV) tests (%) in Canada by region by surveillance week
| Week | Week End | Can Tests | HCoV% | Atl Tests | HCoV% | QC Tests | HCoV% | ON Tests | HCoV% | Pr Tests | HCoV% | BC Tests | HCoV% |
|---|---|---|---|---|---|---|---|---|---|---|---|---|---|
| 35 | 2021-09-04 | 1988 | 1.06 | 98 | 0.00 | 138 | 0.00 | 647 | 1.70 | 786 | 1.02 | 311 | 0.64 |
| 36 | 2021-09-11 | 2118 | 0.61 | 202 | 0.00 | 149 | 0.00 | 553 | 1.08 | 913 | 0.77 | 296 | 0.00 |