
Respiratory Virus Report, week 9 - ending March 6, 2021
Download the alternative format
(PDF format, 1.48 MB, 11 pages)
Organization: Public Health Agency of Canada
On this page
- List of abbreviations
- Respiratory Virus Detections/Isolations
- Number positive laboratory tests for other respiratory viruses
- Positive Influenza Tests
- Positive Respiratory syncytial virus (RSV) Tests
- Positive Parainfluenza (PIV) Tests
- Positive Adenovirus (adeno) Tests
- Positive human metapneumovirus (hMPV) Tests
- Positive Enterovirus/Rhinovirus (entero/rhino) Tests
- Positive Coronavirus (coron) Tests
List of abbreviations
- A(H1N1)pdm09
- Influenza A(H1N1)pdm09
- A(H3)
- Influenza A(H3N2)
- A (UnS)
- Influenza A (Unsubtyped)
- Adeno
- Adenovirus
- CHEO
- Children's Hospital of Eastern Ontario
- Coron
- Coronavirus
- Entero
- Enterovirus
- hMPV
- human metapneumovirus
- HSC
- Health Sciences Centre
- N.A
- Not Applicable
- P.H.L.
- Public Health Laboratory
- P.H.O.L.
- Public Health Ontario Laboratory
- PIV
- Parainfluenza
- Rhino
- Rhinovirus
- RSV
- Respiratory syncytial virus
- UHN
- University Health Network
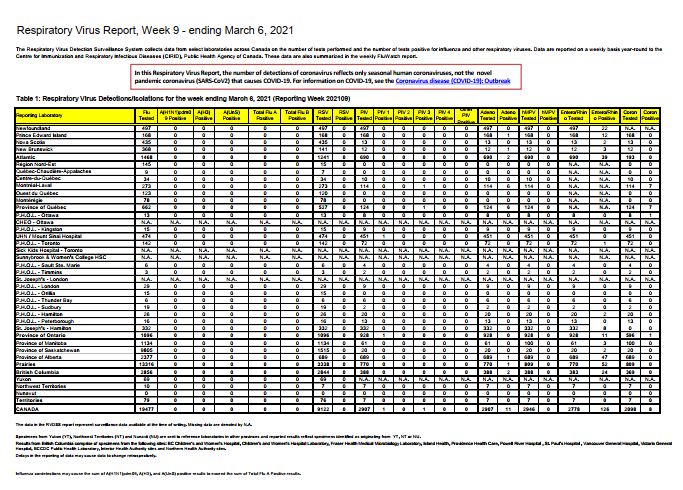
The Respiratory Virus Detection Surveillance System collects data from select laboratories across Canada on the number of tests performed and the number of tests positive for influenza and other respiratory viruses. Data are reported on a weekly basis year-round to the Centre for Immunization and Respiratory Infectious Diseases (CIRID), Public Health Agency of Canada. These data are also summarized in the weekly FluWatch report.
In this Respiratory Virus Report, the number of detections of coronavirus reflects only seasonal human coronaviruses, not the novel pandemic coronavirus (SARS-CoV2) that causes COVID-19. For information on COVID-19, see the Coronavirus disease (COVID-19): Outbreak update.
Respiratory Virus Detections/Isolations
Table 1: Respiratory Virus Detections/Isolations for the week ending March 6, 2021 (Reporting Week 202109)
| Reporting Laboratory | Flu Tested | A(H1N1)pdm09 Positive | A(H3) Positive | A(UnS) Positive | Total Flu A Positive | Total Flu B Positive | RSV Tested | RSV Positive | PIV Tested | PIV 1 Positive | PIV 2 Positive | PIV 3 Positive | PIV 4 Positive | Other PIV Positive | Adeno Tested | Adeno Positive | hMPV Tested | hMPV Positive | Entero/Rhino Tested | Entero/Rhino Positive | Coron Tested | Coron Positive |
|---|---|---|---|---|---|---|---|---|---|---|---|---|---|---|---|---|---|---|---|---|---|---|
| Newfoundland | 497 | 0 | 0 | 0 | 0 | 0 | 497 | 0 | 497 | 0 | 0 | 0 | 0 | 0 | 497 | 0 | 497 | 0 | 497 | 22 | N.A. | N.A. |
| Prince Edward Island | 168 | 0 | 0 | 0 | 0 | 0 | 168 | 0 | 168 | 0 | 0 | 0 | 0 | 0 | 168 | 1 | 168 | 0 | 168 | 12 | 168 | 0 |
| Nova Scotia | 435 | 0 | 0 | 0 | 0 | 0 | 435 | 0 | 13 | 0 | 0 | 0 | 0 | 0 | 13 | 0 | 13 | 0 | 13 | 2 | 13 | 0 |
| New Brunswick | 368 | 0 | 0 | 0 | 0 | 0 | 141 | 0 | 12 | 0 | 0 | 0 | 0 | 0 | 12 | 1 | 12 | 0 | 12 | 3 | 12 | 0 |
| Atlantic | 1468 | 0 | 0 | 0 | 0 | 0 | 1241 | 0 | 690 | 0 | 0 | 0 | 0 | 0 | 690 | 2 | 690 | 0 | 690 | 39 | 193 | 0 |
| Région Nord-Est | 145 | 0 | 0 | 0 | 0 | 0 | 15 | 0 | 0 | 0 | 0 | 0 | 0 | 0 | 0 | 0 | 0 | 0 | N.A. | N.A. | 0 | 0 |
| Québec-Chaudière-Appalaches | 9 | 0 | 0 | 0 | 0 | 0 | 7 | 0 | 0 | 0 | 0 | 0 | 0 | 0 | 0 | 0 | 0 | 0 | N.A. | N.A. | 0 | 0 |
| Centre-du-Québec | 34 | 0 | 0 | 0 | 0 | 0 | 34 | 0 | 10 | 0 | 0 | 0 | 0 | 0 | 10 | 0 | 10 | 0 | N.A. | N.A. | 10 | 0 |
| Montréal-Laval | 273 | 0 | 0 | 0 | 0 | 0 | 273 | 0 | 114 | 0 | 0 | 1 | 0 | 0 | 114 | 6 | 114 | 0 | N.A. | N.A. | 114 | 7 |
| Ouest du Québec | 123 | 0 | 0 | 0 | 0 | 0 | 120 | 0 | 0 | 0 | 0 | 0 | 0 | 0 | 0 | 0 | 0 | 0 | N.A. | N.A. | 0 | 0 |
| Montérégie | 78 | 0 | 0 | 0 | 0 | 0 | 78 | 0 | 0 | 0 | 0 | 0 | 0 | 0 | 0 | 0 | 0 | 0 | N.A. | N.A. | 0 | 0 |
| Province of Québec | 662 | 0 | 0 | 0 | 0 | 0 | 527 | 0 | 124 | 0 | 0 | 1 | 0 | 0 | 124 | 6 | 124 | 0 | N.A. | N.A. | 124 | 7 |
| P.H.O.L. - Ottawa | 13 | 0 | 0 | 0 | 0 | 0 | 13 | 0 | 8 | 0 | 0 | 0 | 0 | 0 | 8 | 0 | 8 | 0 | 8 | 0 | 8 | 1 |
| CHEO - Ottawa | N.A. | N.A. | N.A. | N.A. | N.A. | N.A. | N.A. | N.A. | N.A. | N.A. | N.A. | N.A. | N.A. | N.A. | N.A. | N.A. | N.A. | N.A. | N.A. | N.A. | N.A. | N.A. |
| P.H.O.L. - Kingston | 15 | 0 | 0 | 0 | 0 | 0 | 15 | 0 | 9 | 0 | 0 | 0 | 0 | 0 | 9 | 0 | 9 | 0 | 9 | 0 | 9 | 0 |
| UHN / Mount Sinai Hospital | 474 | 0 | 0 | 0 | 0 | 0 | 474 | 0 | 451 | 1 | 0 | 0 | 0 | 0 | 451 | 0 | 451 | 0 | 451 | 0 | 451 | 0 |
| P.H.O.L. - Toronto | 142 | 0 | 0 | 0 | 0 | 0 | 142 | 0 | 72 | 0 | 0 | 0 | 0 | 0 | 72 | 0 | 72 | 0 | 72 | 1 | 72 | 0 |
| Sick Kids Hospital - Toronto | N.A. | N.A. | N.A. | N.A. | N.A. | N.A. | N.A. | N.A. | N.A. | N.A. | N.A. | N.A. | N.A. | N.A. | N.A. | N.A. | N.A. | N.A. | N.A. | N.A. | N.A. | N.A. |
| Sunnybrook & Women's College HSC | N.A. | N.A. | N.A. | N.A. | N.A. | N.A. | N.A. | N.A. | N.A. | N.A. | N.A. | N.A. | N.A. | N.A. | N.A. | N.A. | N.A. | N.A. | N.A. | N.A. | N.A. | N.A. |
| P.H.O.L. - Sault Ste. Marie | 6 | 0 | 0 | 0 | 0 | 0 | 6 | 0 | 4 | 0 | 0 | 0 | 0 | 0 | 4 | 0 | 4 | 0 | 4 | 0 | 4 | 0 |
| P.H.O.L. - Timmins | 3 | 0 | 0 | 0 | 0 | 0 | 3 | 0 | 2 | 0 | 0 | 0 | 0 | 0 | 2 | 0 | 2 | 0 | 2 | 0 | 2 | 0 |
| St. Joseph's - London | N.A. | N.A. | N.A. | N.A. | N.A. | N.A. | N.A. | N.A. | N.A. | N.A. | N.A. | N.A. | N.A. | N.A. | N.A. | N.A. | N.A. | N.A. | N.A. | N.A. | N.A. | N.A. |
| P.H.O.L. - London | 29 | 0 | 0 | 0 | 0 | 0 | 29 | 0 | 9 | 0 | 0 | 0 | 0 | 0 | 9 | 0 | 9 | 0 | 9 | 0 | 9 | 0 |
| P.H.O.L. - Orillia | 15 | 0 | 0 | 0 | 0 | 0 | 15 | 0 | 0 | 0 | 0 | 0 | 0 | 0 | 0 | 0 | 0 | 0 | 0 | 0 | 0 | 0 |
| P.H.O.L. - Thunder Bay | 6 | 0 | 0 | 0 | 0 | 0 | 6 | 0 | 6 | 0 | 0 | 0 | 0 | 0 | 6 | 0 | 6 | 0 | 6 | 0 | 6 | 0 |
| P.H.O.L. - Sudbury | 19 | 0 | 0 | 0 | 0 | 0 | 19 | 0 | 2 | 0 | 0 | 0 | 0 | 0 | 2 | 0 | 2 | 0 | 2 | 0 | 2 | 0 |
| P.H.O.L. - Hamilton | 26 | 0 | 0 | 0 | 0 | 0 | 26 | 0 | 20 | 0 | 0 | 0 | 0 | 0 | 20 | 0 | 20 | 0 | 20 | 2 | 20 | 0 |
| P.H.O.L. - Peterborough | 16 | 0 | 0 | 0 | 0 | 0 | 16 | 0 | 13 | 0 | 0 | 0 | 0 | 0 | 13 | 0 | 13 | 0 | 13 | 0 | 13 | 0 |
| St. Joseph's - Hamilton | 332 | 0 | 0 | 0 | 0 | 0 | 332 | 0 | 332 | 0 | 0 | 0 | 0 | 0 | 332 | 0 | 332 | 0 | 332 | 8 | 0 | 0 |
| Province of Ontario | 1096 | 0 | 0 | 0 | 0 | 0 | 1096 | 0 | 928 | 1 | 0 | 0 | 0 | 0 | 928 | 0 | 928 | 0 | 928 | 11 | 596 | 1 |
| Province of Manitoba | 1134 | 0 | 0 | 0 | 0 | 0 | 1134 | 0 | 61 | 0 | 0 | 0 | 0 | 0 | 61 | 0 | 100 | 0 | 61 | 3 | 100 | 0 |
| Province of Saskatchewan | 9805 | 0 | 0 | 0 | 0 | 0 | 1515 | 0 | 20 | 0 | 0 | 0 | 0 | 0 | 20 | 0 | 20 | 0 | 20 | 2 | 20 | 0 |
| Province of Alberta | 2377 | 0 | 0 | 0 | 0 | 0 | 689 | 0 | 689 | 0 | 0 | 0 | 0 | 0 | 689 | 1 | 689 | 0 | 689 | 47 | 689 | 0 |
| Prairies | 13316 | 0 | 0 | 0 | 0 | 0 | 3338 | 0 | 770 | 0 | 0 | 0 | 0 | 0 | 770 | 1 | 809 | 0 | 770 | 52 | 809 | 0 |
| British Columbia | 2856 | 0 | 0 | 0 | 0 | 0 | 2844 | 0 | 388 | 0 | 0 | 0 | 0 | 0 | 388 | 2 | 388 | 0 | 383 | 24 | 369 | 0 |
| Yukon | 69 | 0 | 0 | 0 | 0 | 0 | 69 | 0 | N.A. | N.A. | N.A. | N.A. | N.A. | N.A. | N.A. | N.A. | N.A. | N.A. | N.A. | N.A. | N.A. | N.A. |
| Northwest Territories | 10 | 0 | 0 | 0 | 0 | 0 | 7 | 0 | 7 | 0 | 0 | 0 | 0 | 0 | 7 | 0 | 7 | 0 | 7 | 0 | 7 | 0 |
| Nunavut | 0 | 0 | 0 | 0 | 0 | 0 | 0 | 0 | 0 | 0 | 0 | 0 | 0 | 0 | 0 | 0 | 0 | 0 | 0 | 0 | 0 | 0 |
| Territories | 79 | 0 | 0 | 0 | 0 | 0 | 76 | 0 | 7 | 0 | 0 | 0 | 0 | 0 | 7 | 0 | 7 | 0 | 7 | 0 | 7 | 0 |
| CANADA | 19477 | 0 | 0 | 0 | 0 | 0 | 9122 | 0 | 2907 | 1 | 0 | 1 | 0 | 0 | 2907 | 11 | 2946 | 0 | 2778 | 126 | 2098 | 8 |
The data in the RVDSS report represent surveillance data available at the time of writing. Missing data are denoted by N.A.
Specimens from Yukon (YT), Northwest Territories (NT) and Nunavit (NU) are sent to reference laboratories in other provinces and reported results reflect specimens identified as originating from YT, NT or NU.
Results from British Columbia comprise of specimens from the following sites: BC Children's and Women's Hospital, Children's and Women's Hospital Laboratory, Fraser Health Medical Microbiology Laboratory, Island Health, Providence Health Care, Powell River Hospital, St. Paul's Hospital, Vancouver General Hospital, Victoria General Hospital, BCCDC Public Health Laboratory, Interior Health Authority sites and Northern Health Authority sites.
Delays in the reporting of data may cause data to change retrospectively.
Influenza co-detections may cause the sum of A(H1N1)pdm09, A(H3), and A(UnS) positive results to exceed the sum of Total Flu A Positive results.
Table 2: Respiratory Virus Detections/Isolations for the period August 23, 2020 - March 6, 2021 (Reporting Weeks 202035-202109)
| Reporting Laboratory | Flu Tested | A(H1N1)pdm09 Positive | A(H3) Positive | A(UnS) Positive | Total Flu A Positive | Total Flu B Positive | RSV Tested | RSV Positive | PIV Tested | PIV 1 Positive | PIV 2 Positive | PIV 3 Positive | PIV 4 Positive | Other PIV Positive | Adeno Tested | Adeno Positive | hMPV Tested | hMPV Positive | Entero/Rhino Tested | Entero/Rhino Positive | Coron Tested | Coron Positive |
|---|---|---|---|---|---|---|---|---|---|---|---|---|---|---|---|---|---|---|---|---|---|---|
| Newfoundland | 8358 | 0 | 0 | 0 | 0 | 0 | 8358 | 10 | 8358 | 1 | 0 | 1 | 0 | 0 | 8369 | 40 | 8237 | 2 | 8358 | 1938 | N.A. | N.A. |
| Prince Edward Island | 2264 | 0 | 0 | 0 | 0 | 0 | 2264 | 3 | 2260 | 2 | 0 | 0 | 0 | 0 | 2260 | 29 | 2260 | 0 | 2260 | 252 | 2260 | 0 |
| Nova Scotia | 2475 | 0 | 0 | 0 | 0 | 0 | 2478 | 0 | 386 | 0 | 0 | 0 | 0 | 0 | 386 | 7 | 386 | 0 | 386 | 59 | 386 | 0 |
| New Brunswick | 48809 | 0 | 0 | 0 | 0 | 1 | 16782 | 0 | 550 | 0 | 0 | 0 | 0 | 0 | 541 | 8 | 541 | 0 | 541 | 48 | 496 | 0 |
| Atlantic | 61906 | 0 | 0 | 0 | 0 | 1 | 29882 | 13 | 11554 | 3 | 0 | 1 | 0 | 0 | 11556 | 84 | 11424 | 2 | 11545 | 2297 | 3142 | 0 |
| Région Nord-Est | 2700 | 0 | 0 | 0 | 0 | 0 | 818 | 1 | 0 | 0 | 0 | 0 | 0 | 0 | 0 | 0 | 0 | 0 | N.A. | N.A. | 0 | 0 |
| Québec-Chaudière-Appalaches | 645 | 0 | 0 | 1 | 1 | 0 | 703 | 0 | 422 | 0 | 0 | 0 | 0 | 0 | 424 | 24 | 419 | 0 | N.A. | N.A. | 402 | 6 |
| Centre-du-Québec | 678 | 0 | 0 | 0 | 0 | 0 | 687 | 1 | 221 | 0 | 0 | 0 | 0 | 0 | 219 | 16 | 221 | 0 | N.A. | N.A. | 218 | 0 |
| Montréal-Laval | 5256 | 0 | 0 | 0 | 0 | 0 | 4300 | 4 | 2944 | 0 | 0 | 1 | 0 | 0 | 2998 | 109 | 2929 | 0 | N.A. | N.A. | 2929 | 16 |
| Ouest du Québec | 1049 | 0 | 0 | 0 | 0 | 0 | 992 | 0 | 0 | 0 | 0 | 0 | 0 | 0 | 0 | 0 | 0 | 0 | N.A. | N.A. | 0 | 0 |
| Montérégie | 133 | 0 | 0 | 0 | 0 | 0 | 133 | 0 | 0 | 0 | 0 | 0 | 0 | 0 | 0 | 0 | 0 | 0 | N.A. | N.A. | 0 | 0 |
| Province of Québec | 10461 | 0 | 0 | 1 | 1 | 0 | 7633 | 6 | 3587 | 0 | 0 | 1 | 0 | 0 | 3641 | 149 | 3569 | 0 | N.A. | N.A. | 3549 | 22 |
| P.H.O.L. - Ottawa | 418 | 0 | 0 | 0 | 0 | 0 | 418 | 1 | 359 | 0 | 0 | 0 | 0 | 0 | 359 | 0 | 358 | 0 | 359 | 20 | 358 | 1 |
| CHEO - Ottawa | 3772 | 0 | 0 | 1 | 1 | 1 | 3369 | 4 | 563 | 0 | 0 | 0 | 0 | 0 | 563 | 10 | 563 | 1 | 563 | 62 | 563 | 0 |
| P.H.O.L. - Kingston | 712 | 0 | 0 | 1 | 1 | 0 | 712 | 0 | 474 | 0 | 0 | 0 | 0 | 0 | 474 | 3 | 468 | 0 | 474 | 102 | 468 | 0 |
| UHN / Mount Sinai Hospital | 8555 | 2 | 0 | 1 | 3 | 1 | 8486 | 6 | 8096 | 3 | 2 | 3 | 8 | 0 | 6470 | 8 | 8056 | 8 | 7853 | 86 | 5892 | 5 |
| P.H.O.L. - Toronto | 4726 | 0 | 0 | 0 | 0 | 0 | 4723 | 2 | 4199 | 0 | 0 | 0 | 0 | 2 | 4200 | 11 | 4198 | 0 | 4199 | 144 | 4198 | 4 |
| Sick Kids Hospital - Toronto | 854 | 0 | 0 | 0 | 0 | 0 | 0 | 0 | 854 | 0 | 0 | 0 | 0 | 0 | 854 | 12 | 854 | 0 | 854 | 88 | 854 | 0 |
| Sunnybrook & Women's College HSC | 0 | 0 | 0 | 0 | 0 | 0 | 0 | 0 | 0 | 0 | 0 | 0 | 0 | 0 | 0 | 0 | 0 | 0 | 0 | 0 | 0 | 0 |
| P.H.O.L. - Sault Ste. Marie | 118 | 0 | 0 | 2 | 2 | 0 | 116 | 0 | 87 | 0 | 0 | 0 | 0 | 0 | 87 | 0 | 87 | 0 | 87 | 6 | 87 | 0 |
| P.H.O.L. - Timmins | 585 | 0 | 0 | 0 | 0 | 0 | 585 | 0 | 149 | 0 | 0 | 0 | 0 | 0 | 149 | 0 | 148 | 0 | 149 | 30 | 148 | 0 |
| St. Joseph's - London | 218 | 0 | 0 | 0 | 0 | 0 | 218 | 0 | 55 | 0 | 0 | 0 | 0 | 0 | 55 | 0 | 55 | 0 | 91 | 8 | 36 | 0 |
| P.H.O.L. - London | 1654 | 1 | 0 | 5 | 6 | 2 | 1644 | 0 | 1199 | 0 | 0 | 0 | 0 | 2 | 1199 | 2 | 1194 | 0 | 1199 | 124 | 1194 | 3 |
| P.H.O.L. - Orillia | 336 | 0 | 0 | 1 | 1 | 0 | 334 | 0 | 189 | 0 | 0 | 0 | 0 | 0 | 189 | 1 | 189 | 0 | 189 | 12 | 189 | 0 |
| P.H.O.L. - Thunder Bay | 365 | 0 | 0 | 0 | 0 | 0 | 365 | 0 | 353 | 0 | 0 | 0 | 0 | 0 | 354 | 2 | 353 | 0 | 353 | 132 | 353 | 0 |
| P.H.O.L. - Sudbury | 409 | 0 | 0 | 0 | 0 | 0 | 407 | 0 | 318 | 0 | 0 | 0 | 0 | 0 | 318 | 2 | 318 | 0 | 318 | 28 | 318 | 0 |
| P.H.O.L. - Hamilton | 1340 | 0 | 0 | 0 | 0 | 0 | 1289 | 1 | 1092 | 0 | 0 | 0 | 0 | 0 | 1092 | 2 | 1092 | 0 | 1092 | 95 | 1092 | 0 |
| P.H.O.L. - Peterborough | 397 | 0 | 0 | 1 | 1 | 0 | 351 | 0 | 264 | 0 | 0 | 0 | 0 | 0 | 264 | 0 | 264 | 0 | 264 | 20 | 264 | 0 |
| St. Joseph's - Hamilton | 7371 | 0 | 0 | 0 | 0 | 0 | 7371 | 1 | 7371 | 0 | 0 | 0 | 0 | 0 | 7371 | 18 | 7371 | 0 | 7371 | 395 | 0 | 0 |
| Province of Ontario | 31830 | 3 | 0 | 12 | 15 | 4 | 30388 | 15 | 25622 | 3 | 2 | 3 | 8 | 4 | 23998 | 71 | 25568 | 9 | 25415 | 1352 | 16014 | 13 |
| Manitoba | 35553 | 0 | 0 | 0 | 0 | 1 | 35543 | 68 | 2520 | 0 | 1 | 1 | 0 | 0 | 2520 | 17 | 2516 | 1 | 2520 | 127 | 2516 | 3 |
| Province of Saskatchewan | 48320 | 0 | 0 | 0 | 0 | 0 | 7875 | 3 | 1481 | 0 | 0 | 1 | 1 | 0 | 1481 | 10 | 1481 | 0 | 1481 | 151 | 1481 | 2 |
| Province of Alberta | 99484 | 4 | 0 | 6 | 10 | 0 | 70525 | 0 | 70525 | 2 | 18 | 2 | 5 | 0 | 70525 | 123 | 70525 | 11 | 70525 | 5899 | 70525 | 20 |
| Prairies | 183357 | 4 | 0 | 6 | 10 | 1 | 113943 | 71 | 74526 | 2 | 19 | 4 | 6 | 0 | 74526 | 150 | 74522 | 12 | 74526 | 6177 | 74522 | 25 |
| British Columbia | 60479 | 3 | 8 | 0 | 9 | 8 | 60321 | 5 | 12968 | 1 | 4 | 0 | 7 | 0 | 13517 | 66 | 13362 | 54 | 13194 | 1173 | 9251 | 18 |
| Yukon | 4349 | 0 | 0 | 8 | 8 | 7 | 4291 | 4 | N.A. | N.A. | N.A. | N.A. | N.A. | N.A. | N.A. | N.A. | N.A. | N.A. | N.A. | N.A. | N.A. | N.A. |
| Northwest Territories | 1083 | 0 | 0 | 0 | 0 | 0 | 1054 | 0 | 1054 | 0 | 0 | 0 | 1 | 0 | 1054 | 9 | 1054 | 1 | 1054 | 314 | 1054 | 0 |
| Nunavut | 1095 | 0 | 0 | 0 | 0 | 0 | 1083 | 0 | 1083 | 3 | 1 | 0 | 0 | 0 | 1083 | 25 | 1083 | 5 | 1083 | 280 | 183 | 0 |
| Territories | 6527 | 0 | 0 | 8 | 8 | 7 | 6428 | 4 | 2137 | 3 | 1 | 0 | 1 | 0 | 2137 | 34 | 2137 | 6 | 2137 | 594 | 1237 | 0 |
| CANADA | 354560 | 10 | 8 | 27 | 43 | 21 | 248595 | 114 | 130394 | 12 | 26 | 9 | 22 | 4 | 129375 | 554 | 130582 | 83 | 126817 | 11593 | 107715 | 78 |
The data in the RVDSS report represent surveillance data available at the time of writing. Missing data are denoted by N.A.
Specimens from YT, NT and NU are sent to reference laboratories in other provinces and reported results reflect specimens identified as originating from YT, NT or NU.
Results from British Columbia comprise of specimens from the following sites: BC Children's and Women's Hospital, Children's and Women's Hospital Laboratory, Fraser Health Medical Microbiology Laboratory, Island Health, Providence Health Care, Powell River Hospital , St. Paul's Hospital, Vancouver General Hospital, Victoria General Hospital, BCCDC Public Health Laboratory, Interior Health Authority sites and Northern Health Authority sites.
Delays in the reporting of data may cause data to change retrospectively.
Due to reporting delays, the sum of weekly report totals do not add up to cumulative totals.
Influenza co-detections may cause the sum of A(H1N1)pdm09, A(H3), and A(UnS) positive results to exceed the sum of Total Flu A Positive results.
Number positive laboratory tests for other respiratory viruses
Figure 1: Number positive laboratory tests for other respiratory viruses by report week, Canada, 2020-21
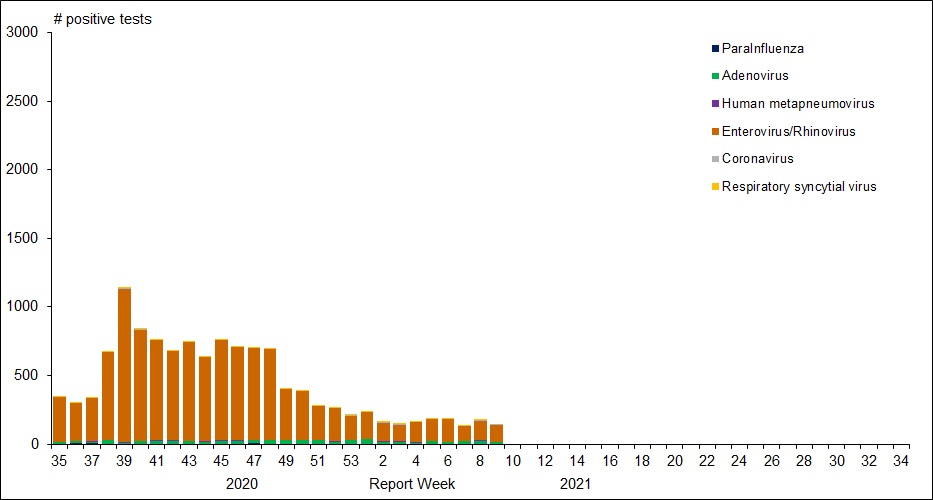
Figure 1: Number positive laboratory tests for other respiratory viruses by report week, Canada, 2020-21 - Text description
| Week | ParaInfluenza | Adenovirus | Human metapneumovirus | Enterovirus/Rhinovirus | Coronavirus | Respiratory syncytial virus |
|---|---|---|---|---|---|---|
| 35 | 3 | 10 | 6 | 319 | 2 | 1 |
| 36 | 7 | 13 | 2 | 277 | 0 | 2 |
| 37 | 5 | 13 | 2 | 311 | 2 | 1 |
| 38 | 3 | 24 | 1 | 643 | 0 | 6 |
| 39 | 1 | 9 | 2 | 1119 | 2 | 3 |
| 40 | 1 | 22 | 0 | 806 | 4 | 5 |
| 41 | 3 | 18 | 9 | 717 | 1 | 7 |
| 42 | 3 | 23 | 3 | 643 | 0 | 5 |
| 43 | 4 | 21 | 1 | 715 | 0 | 6 |
| 44 | 2 | 14 | 9 | 606 | 0 | 5 |
| 45 | 1 | 25 | 1 | 723 | 2 | 4 |
| 46 | 3 | 23 | 3 | 673 | 2 | 7 |
| 47 | 5 | 25 | 2 | 666 | 3 | 4 |
| 48 | 2 | 27 | 2 | 658 | 1 | 4 |
| 49 | 0 | 29 | 2 | 365 | 2 | 6 |
| 50 | 3 | 27 | 1 | 349 | 4 | 7 |
| 51 | 2 | 25 | 2 | 241 | 2 | 6 |
| 52 | 1 | 16 | 4 | 233 | 2 | 1 |
| 53 | 4 | 27 | 2 | 169 | 3 | 3 |
| 1 | 3 | 30 | 1 | 193 | 5 | 6 |
| 2 | 2 | 15 | 4 | 128 | 8 | 5 |
| 3 | 2 | 15 | 4 | 120 | 4 | 4 |
| 4 | 2 | 9 | 5 | 142 | 3 | 3 |
| 5 | 3 | 17 | 6 | 155 | 5 | 6 |
| 6 | 0 | 15 | 4 | 162 | 3 | 2 |
| 7 | 4 | 17 | 1 | 110 | 3 | 4 |
| 8 | 2 | 22 | 3 | 139 | 7 | 1 |
| 9 | 2 | 11 | 0 | 126 | 8 | 0 |
Positive Influenza tests
Figure 2: Positive Influenza Tests (%) in Canada by Region by Week of Report
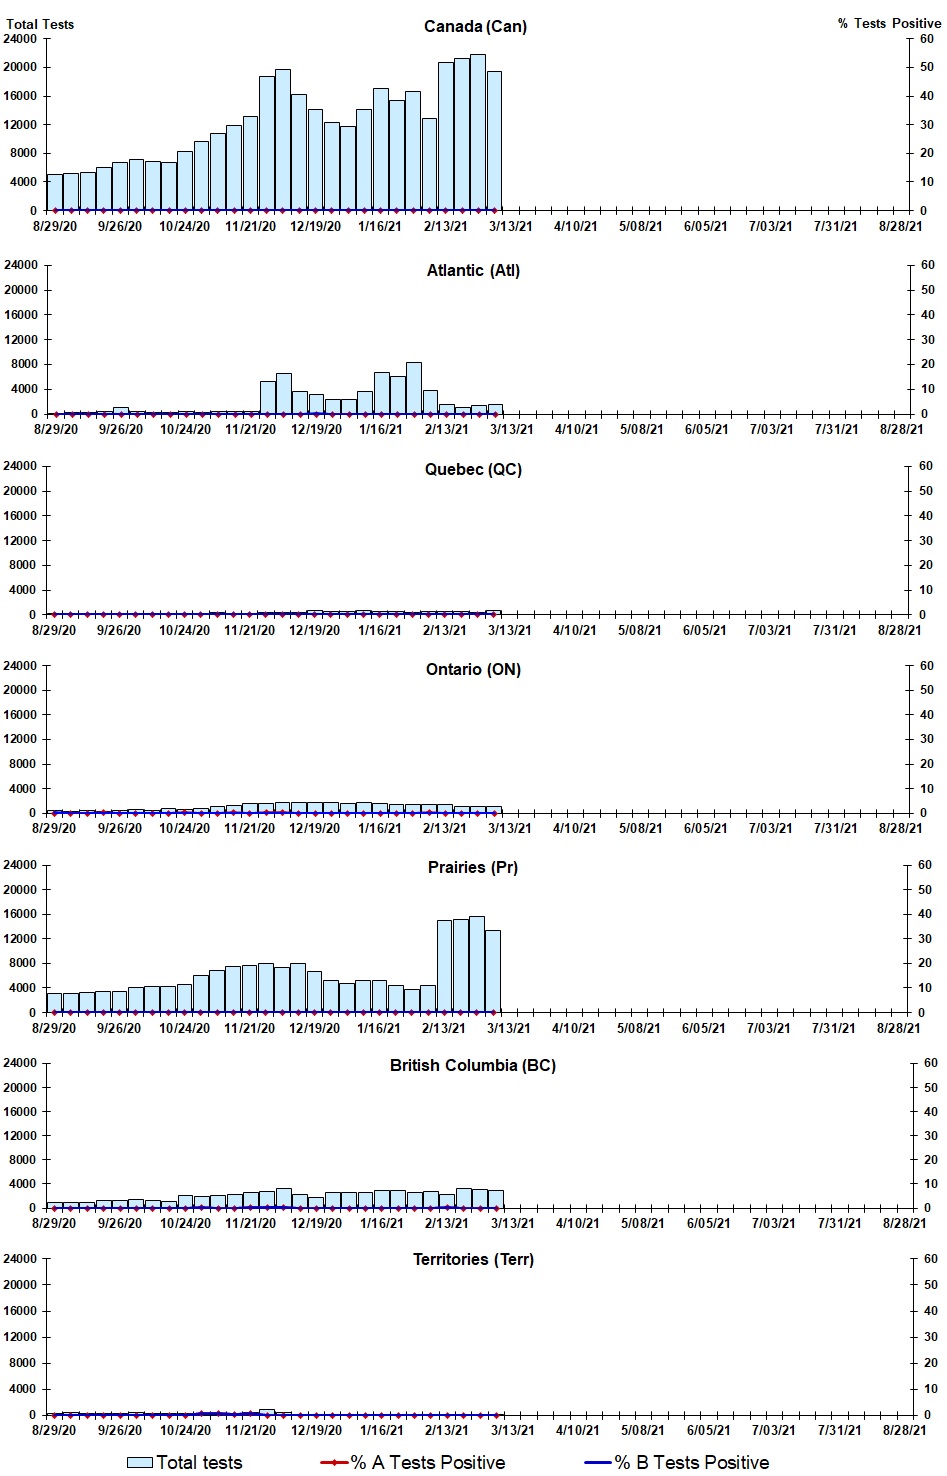
Figure 2 : Positive Influenza Tests (%) in Canada by Region by Week of Report - Text description
| Week | Week End | Can Tests | Can A% | Can B% | Atl Tests | Atl A% | Atl B% | QC Tests | QC A% | QC B% | ON Tests | ON A% | ON B% | Pr Tests | Pr A% | Pr B% | BC Tests | BC A% | BC B% | Terr Tests | Terr A% | Terr B% |
|---|---|---|---|---|---|---|---|---|---|---|---|---|---|---|---|---|---|---|---|---|---|---|
| 35 | 2020-08-29 | 4962 | 0.0 | 0.0 | 151 | 0.0 | 0.0 | 104 | 0.0 | 0.0 | 400 | 0.0 | 0.3 | 3032 | 0.0 | 0.0 | 947 | 0.0 | 0.0 | 328 | 0.0 | 0.0 |
| 36 | 2020-09-05 | 5176 | 0.0 | 0.0 | 169 | 0.0 | 0.0 | 133 | 0.0 | 0.0 | 349 | 0.0 | 0.0 | 3163 | 0.0 | 0.0 | 974 | 0.0 | 0.0 | 388 | 0.0 | 0.0 |
| 37 | 2020-09-12 | 5308 | 0.0 | 0.0 | 232 | 0.0 | 0.0 | 160 | 0.0 | 0.0 | 413 | 0.0 | 0.0 | 3267 | 0.0 | 0.0 | 917 | 0.0 | 0.0 | 319 | 0.0 | 0.0 |
| 38 | 2020-09-19 | 5996 | 0.0 | 0.0 | 465 | 0.0 | 0.0 | 182 | 0.0 | 0.0 | 337 | 0.3 | 0.0 | 3499 | 0.0 | 0.0 | 1217 | 0.0 | 0.0 | 296 | 0.0 | 0.0 |
| 39 | 2020-09-26 | 6670 | 0.0 | 0.0 | 1021 | 0.0 | 0.0 | 227 | 0.0 | 0.0 | 459 | 0.0 | 0.0 | 3488 | 0.0 | 0.0 | 1201 | 0.0 | 0.0 | 274 | 0.0 | 0.0 |
| 40 | 2020-10-03 | 7093 | 0.0 | 0.0 | 411 | 0.0 | 0.0 | 262 | 0.0 | 0.0 | 552 | 0.0 | 0.0 | 4024 | 0.0 | 0.0 | 1378 | 0.0 | 0.0 | 466 | 0.0 | 0.0 |
| 41 | 2020-10-10 | 6783 | 0.0 | 0.0 | 246 | 0.0 | 0.0 | 227 | 0.0 | 0.0 | 449 | 0.0 | 0.0 | 4186 | 0.0 | 0.0 | 1338 | 0.0 | 0.0 | 337 | 0.0 | 0.0 |
| 42 | 2020-10-17 | 6730 | 0.0 | 0.0 | 254 | 0.0 | 0.0 | 221 | 0.0 | 0.0 | 680 | 0.0 | 0.0 | 4193 | 0.0 | 0.0 | 1158 | 0.0 | 0.0 | 224 | 0.0 | 0.0 |
| 43 | 2020-10-24 | 8188 | 0.0 | 0.0 | 346 | 0.0 | 0.0 | 232 | 0.0 | 0.0 | 644 | 0.2 | 0.0 | 4602 | 0.0 | 0.0 | 2054 | 0.0 | 0.0 | 310 | 0.0 | 0.0 |
| 44 | 2020-10-31 | 9585 | 0.0 | 0.0 | 274 | 0.0 | 0.0 | 272 | 0.0 | 0.0 | 787 | 0.0 | 0.0 | 6072 | 0.0 | 0.0 | 1897 | 0.1 | 0.1 | 283 | 0.7 | 0.7 |
| 45 | 2020-11-07 | 10706 | 0.0 | 0.0 | 391 | 0.0 | 0.0 | 303 | 0.0 | 0.0 | 1000 | 0.1 | 0.1 | 6768 | 0.0 | 0.0 | 2071 | 0.0 | 0.0 | 173 | 0.6 | 0.6 |
| 46 | 2020-11-14 | 11918 | 0.0 | 0.0 | 465 | 0.0 | 0.0 | 266 | 0.0 | 0.0 | 1159 | 0.2 | 0.0 | 7515 | 0.0 | 0.0 | 2294 | 0.0 | 0.0 | 219 | 0.5 | 0.5 |
| 47 | 2020-11-21 | 12971 | 0.0 | 0.0 | 451 | 0.0 | 0.0 | 293 | 0.0 | 0.0 | 1502 | 0.0 | 0.1 | 7731 | 0.0 | 0.0 | 2658 | 0.0 | 0.0 | 336 | 0.9 | 0.9 |
| 48 | 2020-11-28 | 17810 | 0.0 | 0.0 | 5192 | 0.0 | 0.0 | 322 | 0.3 | 0.0 | 1601 | 0.3 | 0.1 | 7975 | 0.0 | 0.0 | 1872 | 0.1 | 0.1 | 848 | 0.1 | 0.0 |
| 49 | 2020-12-05 | 18436 | 0.0 | 0.0 | 6476 | 0.0 | 0.0 | 443 | 0.0 | 0.0 | 1730 | 0.2 | 0.0 | 7334 | 0.0 | 0.0 | 2159 | 0.1 | 0.1 | 294 | 0.0 | 0.0 |
| 50 | 2020-12-12 | 15894 | 0.0 | 0.0 | 3616 | 0.0 | 0.0 | 378 | 0.0 | 0.0 | 1749 | 0.1 | 0.0 | 8036 | 0.0 | 0.0 | 2022 | 0.0 | 0.0 | 93 | 0.0 | 0.0 |
| 51 | 2020-12-19 | 13682 | 0.0 | 0.0 | 3218 | 0.0 | 0.0 | 634 | 0.0 | 0.0 | 1683 | 0.0 | 0.0 | 6634 | 0.0 | 0.0 | 1470 | 0.0 | 0.0 | 43 | 0.0 | 0.0 |
| 52 | 2020-12-26 | 12108 | 0.0 | 0.0 | 2273 | 0.0 | 0.0 | 540 | 0.0 | 0.0 | 1659 | 0.0 | 0.0 | 5193 | 0.0 | 0.0 | 2420 | 0.0 | 0.0 | 23 | 0.0 | 0.0 |
| 53 | 2021-01-02 | 11519 | 0.02 | 0.0 | 2357 | 0.0 | 0.0 | 496 | 0.0 | 0.0 | 1522 | 0.0 | 0.0 | 4660 | 0.04 | 0.0 | 2456 | 0.0 | 0.0 | 28 | 0.0 | 0.0 |
| 1 | 2021-01-09 | 13817 | 0.0 | 0.0 | 3667 | 0.0 | 0.0 | 705 | 0.0 | 0.0 | 1658 | 0.0 | 0.0 | 5197 | 0.0 | 0.0 | 2541 | 0.0 | 0.0 | 49 | 0.0 | 0.0 |
| 2 | 2021-01-16 | 16687 | 0.0 | 0.0 | 6694 | 0.0 | 0.0 | 552 | 0.0 | 0.0 | 1557 | 0.0 | 0.0 | 5156 | 0.1 | 0.0 | 2650 | 0.0 | 0.0 | 78 | 0.0 | 0.0 |
| 3 | 2021-01-23 | 15216 | 0.0 | 0.0 | 5992 | 0.0 | 0.0 | 517 | 0.0 | 0.0 | 1491 | 0.0 | 0.0 | 4454 | 0.0 | 0.0 | 2730 | 0.0 | 0.0 | 32 | 0.0 | 0.0 |
| 4 | 2021-01-30 | 16623 | 0.00 | 0.00 | 8310 | 0.00 | 0.00 | 418 | 0.00 | 0.00 | 1493 | 0.00 | 0.00 | 3679 | 0.00 | 0.00 | 2687 | 0.00 | 0.00 | 36 | 0 | 0 |
| 5 | 2021-02-06 | 12912 | 0.02 | 0.00 | 3731 | 0.00 | 0.00 | 468 | 0.00 | 0.00 | 1409 | 0.14 | 0.00 | 4447 | 0.00 | 0.00 | 2780 | 0.00 | 0.00 | 77 | 0 | 0 |
| 6 | 2021-02-13 | 20715 | 0.01 | 0.00 | 1529 | 0.07 | 0.00 | 493 | 0.00 | 0.00 | 1375 | 0.00 | 0.00 | 15007 | 0.01 | 0.00 | 2197 | 0.05 | 0.05 | 114 | 0 | 0 |
| 7 | 2021-02-20 | 21258 | 0.00 | 0.00 | 1090 | 0.00 | 0.00 | 530 | 0.00 | 0.00 | 1135 | 0.00 | 0.00 | 15087 | 0.01 | 0.00 | 3301 | 0.00 | 0.03 | 115 | 0 | 0 |
| 8 | 2021-02-27 | 21868 | 0.00 | 0.00 | 1417 | 0.00 | 0.00 | 421 | 0.00 | 0.00 | 1180 | 0.00 | 0.00 | 15639 | 0.00 | 0.00 | 3129 | 0.00 | 0.00 | 82 | 0 | 0 |
| 9 | 2021-03-06 | 19477 | 0.00 | 0.00 | 1468 | 0.00 | 0.00 | 662 | 0.00 | 0.00 | 1096 | 0.00 | 0.00 | 13316 | 0.00 | 0.00 | 2856 | 0.00 | 0.00 | 79 | 0 | 0 |
Positive Respiratory syncytial virus (RSV) Tests
Figure 3: Positive Respiratory syncytial virus (RSV) Tests (%) in Canada by Region by Week of Report
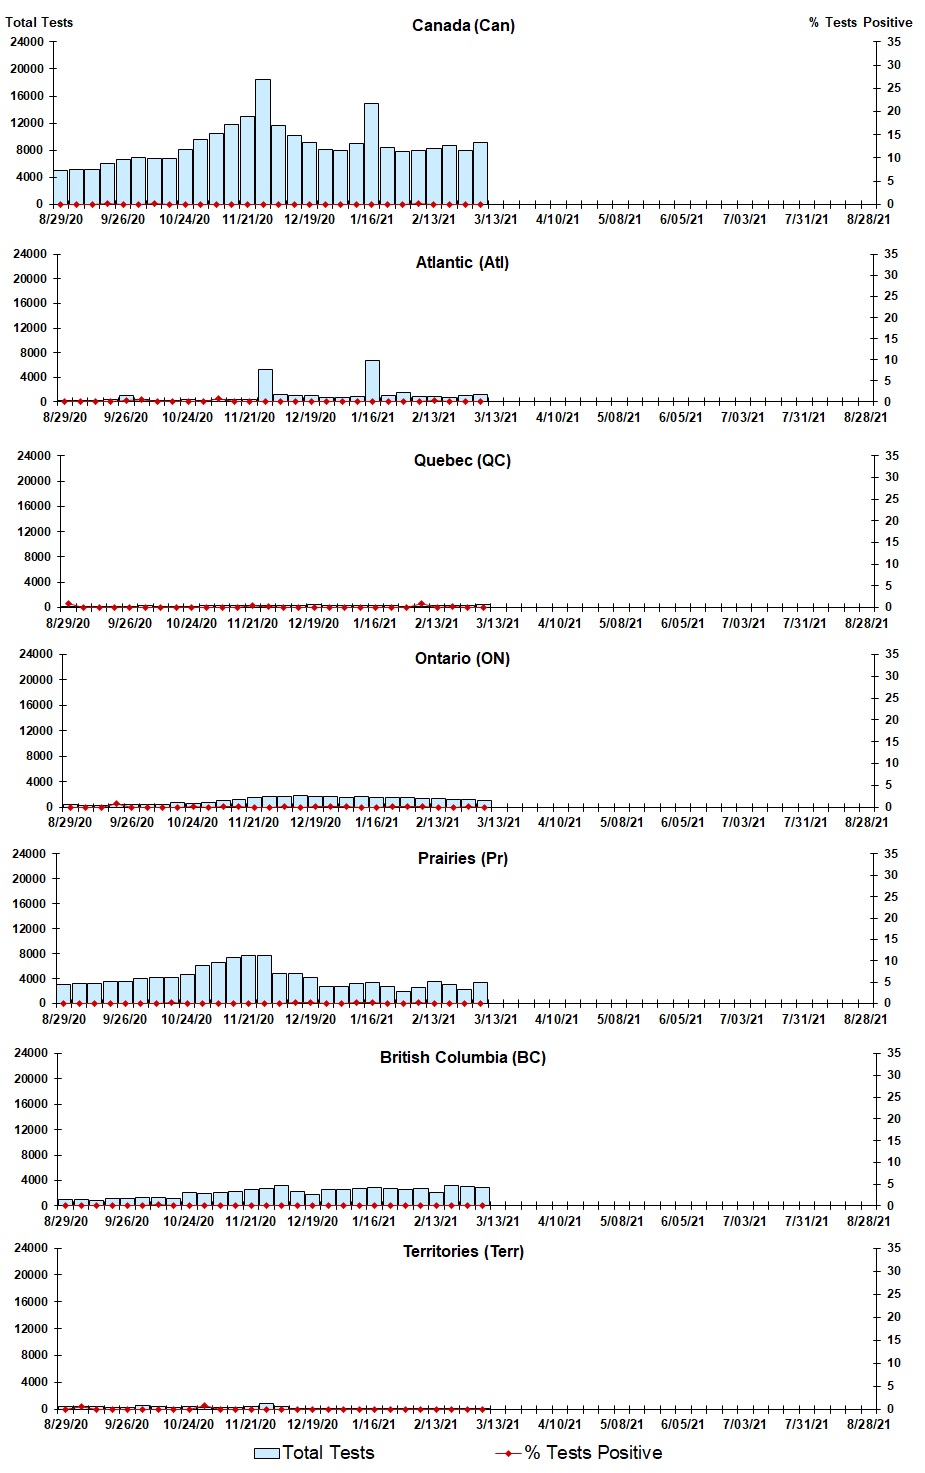
Figure 3: Positive Respiratory syncytial virus (RSV) Tests (%) in Canada by Region by Week of Report - Text description
| Week | Week End | Can Tests | RSV% | Atl Tests | RSV% | QC Tests | RSV% | ON Tests | RSV% | Pr Tests | RSV% | BC Tests | RSV% | Terr Tests | RSV% |
|---|---|---|---|---|---|---|---|---|---|---|---|---|---|---|---|
| 35 | 2020-08-29 | 4947 | 0.0 | 151 | 0.0 | 100 | 1.0 | 396 | 0.0 | 3030 | 0.0 | 947 | 0.0 | 323 | 0.0 |
| 36 | 2020-09-05 | 5069 | 0.0 | 169 | 0.0 | 139 | 0.0 | 271 | 0.0 | 3162 | 0.0 | 974 | 0.0 | 354 | 0.6 |
| 37 | 2020-09-12 | 5155 | 0.0 | 232 | 0.0 | 157 | 0.0 | 288 | 0.0 | 3267 | 0.0 | 917 | 0.0 | 294 | 0.0 |
| 38 | 2020-09-19 | 6084 | 0.1 | 465 | 0.0 | 182 | 0.0 | 337 | 0.9 | 3498 | 0.1 | 1217 | 0.0 | 385 | 0.0 |
| 39 | 2020-09-26 | 6582 | 0.1 | 1021 | 0.3 | 226 | 0.0 | 375 | 0.0 | 3488 | 0.0 | 1201 | 0.0 | 271 | 0.0 |
| 40 | 2020-10-03 | 7002 | 0.1 | 411 | 0.5 | 263 | 0.0 | 432 | 0.0 | 4023 | 0.1 | 1378 | 0.0 | 495 | 0.0 |
| 41 | 2020-10-10 | 6775 | 0.1 | 246 | 0.0 | 228 | 0.0 | 442 | 0.0 | 4183 | 0.1 | 1338 | 0.2 | 338 | 0.0 |
| 42 | 2020-10-17 | 6701 | 0.1 | 254 | 0.0 | 215 | 0.0 | 659 | 0.0 | 4193 | 0.1 | 1158 | 0.0 | 222 | 0.0 |
| 43 | 2020-10-24 | 8162 | 0.1 | 346 | 0.0 | 225 | 0.0 | 630 | 0.2 | 4601 | 0.1 | 2054 | 0.0 | 306 | 0.0 |
| 44 | 2020-10-31 | 9548 | 0.1 | 275 | 0.0 | 252 | 0.0 | 785 | 0.0 | 6070 | 0.1 | 1897 | 0.0 | 269 | 0.7 |
| 45 | 2020-11-07 | 10493 | 0.0 | 391 | 0.8 | 280 | 0.0 | 965 | 0.1 | 6619 | 0.0 | 2071 | 0.0 | 167 | 0.0 |
| 46 | 2020-11-14 | 11763 | 0.1 | 465 | 0.0 | 242 | 0.0 | 1155 | 0.2 | 7390 | 0.1 | 2292 | 0.0 | 219 | 0.0 |
| 47 | 2020-11-21 | 12922 | 0.0 | 451 | 0.0 | 267 | 0.4 | 1499 | 0.0 | 7711 | 0.0 | 2658 | 0.0 | 336 | 0.0 |
| 48 | 2020-11-28 | 17429 | 0.0 | 5193 | 0.0 | 291 | 0.3 | 1591 | 0.0 | 7702 | 0.0 | 1872 | 0.1 | 780 | 0.0 |
| 49 | 2020-12-05 | 10513 | 0.1 | 1223 | 0.0 | 324 | 0.0 | 1728 | 0.1 | 4790 | 0.1 | 2159 | 0.0 | 289 | 0.0 |
| 50 | 2020-12-12 | 9901 | 0.1 | 1016 | 0.0 | 268 | 0.0 | 1748 | 0.0 | 4755 | 0.1 | 2021 | 0.1 | 93 | 0.0 |
| 51 | 2020-12-19 | 8802 | 0.1 | 1003 | 0.0 | 492 | 0.0 | 1682 | 0.1 | 4115 | 0.1 | 1470 | 0.0 | 40 | 0.0 |
| 52 | 2020-12-26 | 7960 | 0.01 | 769 | 0.0 | 302 | 0.0 | 1659 | 0.06 | 2789 | 0.0 | 2420 | 0.0 | 21 | 0.0 |
| 53 | 2021-01-02 | 7789 | 0.04 | 783 | 0.13 | 312 | 0.0 | 1522 | 0.07 | 2691 | 0.04 | 2456 | 0.0 | 25 | 0.0 |
| 1 | 2021-01-09 | 8705 | 0.1 | 842 | 0.0 | 392 | 0.0 | 1633 | 0.0 | 3249 | 0.2 | 2541 | 0.0 | 48 | 0.0 |
| 2 | 2021-01-16 | 14584 | 0.0 | 6694 | 0.0 | 322 | 0.0 | 1509 | 0.0 | 3352 | 0.1 | 2631 | 0.0 | 76 | 0.0 |
| 3 | 2021-01-23 | 8191 | 0.1 | 1075 | 0.1 | 254 | 0.0 | 1491 | 0.1 | 2674 | 0.1 | 2668 | 0.0 | 29 | 0.0 |
| 4 | 2021-01-30 | 7866 | 0.04 | 1512 | 0 | 209 | 0 | 1465 | 0.07 | 1973 | 0.1 | 2676 | 0 | 31 | 0 |
| 5 | 2021-02-06 | 7924 | 0.08 | 903 | 0 | 207 | 0.97 | 1385 | 0.07 | 2587 | 0.12 | 2771 | 0 | 71 | 0 |
| 6 | 2021-02-13 | 8241 | 0.02 | 853 | 0.23 | 268 | 0 | 1330 | 0 | 3504 | 0 | 2176 | 0 | 110 | 0 |
| 7 | 2021-02-20 | 8621 | 0.05 | 782 | 0 | 330 | 0.3 | 1135 | 0 | 2980 | 0.1 | 3285 | 0 | 109 | 0 |
| 8 | 2021-02-27 | 8004 | 0.01 | 1116 | 0 | 359 | 0 | 1180 | 0.08 | 2205 | 0 | 3123 | 0 | 21 | 0 |
| 9 | 2021-03-06 | 9122 | 0 | 1241 | 0 | 527 | 0 | 1096 | 0 | 3338 | 0 | 2844 | 0 | 76 | 0 |
Positive Parainfluenza (PIV) Tests
Figure 4: Positive Parainfluenza (PIV) Tests (%) in Canada by Region by Week of Report
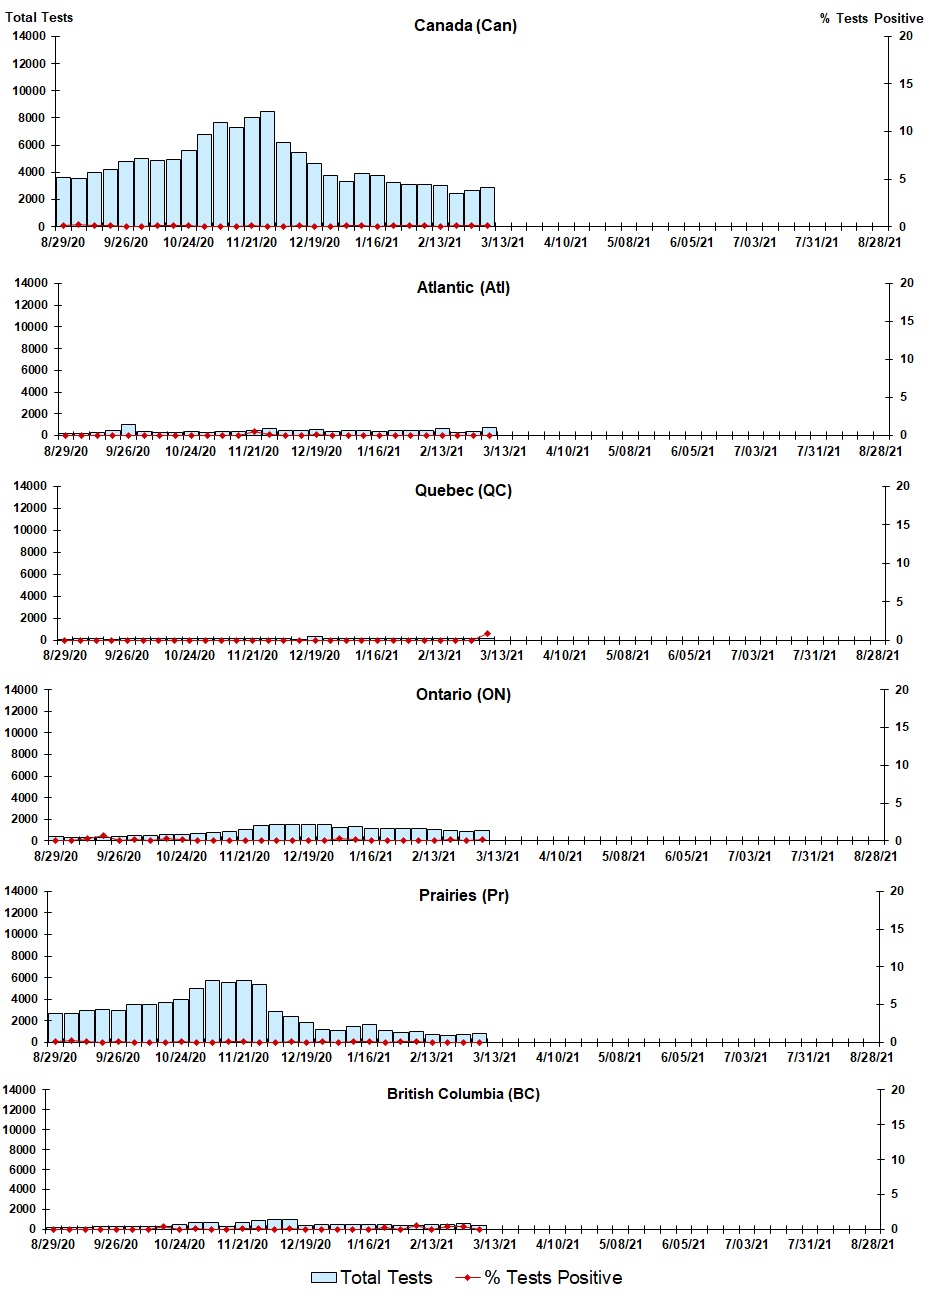
Figure 4: Positive Parainfluenza (PIV) Tests (%) in Canada by Region by Week of Report - Text description
| Week | Week End | Canada Tests | PIV% | Atl Tests | PIV% | QC Tests | PIV% | ON Tests | PIV% | Pr Tests | PIV% | BC Tests | PIV% |
|---|---|---|---|---|---|---|---|---|---|---|---|---|---|
| 35 | 2020-08-29 | 3608 | 0.1 | 154 | 0.0 | 81 | 0.0 | 356 | 0.0 | 2672 | 0.1 | 193 | 0.0 |
| 36 | 2020-09-05 | 3541 | 0.2 | 156 | 0.0 | 110 | 0.0 | 300 | 0.0 | 2617 | 0.2 | 207 | 0.0 |
| 37 | 2020-09-12 | 3968 | 0.1 | 232 | 0.0 | 110 | 0.0 | 300 | 0.3 | 2960 | 0.1 | 210 | 0.0 |
| 38 | 2020-09-19 | 4155 | 0.1 | 467 | 0.0 | 55 | 0.0 | 289 | 0.7 | 3022 | 0.0 | 250 | 0.0 |
| 39 | 2020-09-26 | 4778 | 0.0 | 999 | 0.0 | 151 | 0.0 | 393 | 0.0 | 2922 | 0.0 | 261 | 0.0 |
| 40 | 2020-10-03 | 4994 | 0.0 | 391 | 0.0 | 136 | 0.0 | 432 | 0.2 | 3470 | 0.0 | 279 | 0.0 |
| 41 | 2020-10-10 | 4814 | 0.1 | 250 | 0.0 | 130 | 0.0 | 442 | 0.0 | 3527 | 0.0 | 288 | 0.0 |
| 42 | 2020-10-17 | 4883 | 0.1 | 226 | 0.0 | 112 | 0.0 | 565 | 0.4 | 3662 | 0.0 | 243 | 0.4 |
| 43 | 2020-10-24 | 5596 | 0.1 | 330 | 0.0 | 137 | 0.0 | 509 | 0.2 | 3970 | 0.1 | 520 | 0.0 |
| 44 | 2020-10-31 | 6759 | 0.0 | 241 | 0.0 | 141 | 0.0 | 680 | 0.0 | 4967 | 0.0 | 667 | 0.2 |
| 45 | 2020-11-07 | 7644 | 0.0 | 341 | 0.0 | 134 | 0.0 | 755 | 0.0 | 5711 | 0.0 | 663 | 0.0 |
| 46 | 2020-11-14 | 7232 | 0.0 | 402 | 0.0 | 117 | 0.0 | 857 | 0.0 | 5575 | 0.1 | 232 | 0.0 |
| 47 | 2020-11-21 | 7977 | 0.1 | 413 | 0.5 | 105 | 0.0 | 1002 | 0.0 | 5691 | 0.0 | 681 | 0.2 |
| 48 | 2020-11-28 | 8446 | 0.0 | 617 | 0.2 | 134 | 0.0 | 1337 | 0.0 | 5370 | 0.0 | 888 | 0.1 |
| 49 | 2020-12-05 | 6018 | 0.0 | 453 | 0.0 | 127 | 0.0 | 1503 | 0.0 | 2892 | 0.0 | 897 | 0.0 |
| 50 | 2020-12-12 | 5400 | 0.1 | 413 | 0.0 | 86 | 0.0 | 1502 | 0.1 | 2411 | 0.0 | 934 | 0.1 |
| 51 | 2020-12-19 | 4594 | 0.0 | 569 | 0.2 | 322 | 0.0 | 1437 | 0.1 | 1873 | 0.0 | 353 | 0.0 |
| 52 | 2020-12-26 | 3717 | 0.03 | 403 | 0.0 | 105 | 0.0 | 1468 | 0.0 | 1220 | 0.08 | 500 | 0.0 |
| 53 | 2021-01-02 | 3317 | 0.12 | 426 | 0.0 | 142 | 0.0 | 1203 | 0.33 | 1059 | 0.0 | 462 | 0.0 |
| 1 | 2021-01-09 | 3875 | 0.1 | 456 | 0.0 | 140 | 0.0 | 1273 | 0.2 | 1461 | 0.1 | 497 | 0.0 |
| 2 | 2021-01-16 | 3735 | 0.1 | 388 | 0.0 | 109 | 0.0 | 1091 | 0.0 | 1615 | 0.1 | 456 | 0.0 |
| 3 | 2021-01-23 | 3235 | 0.1 | 455 | 0.0 | 119 | 0.0 | 1102 | 0.1 | 1039 | 0.0 | 491 | 0.2 |
| 4 | 2021-01-30 | 3115 | 0.06 | 466 | 0 | 126 | 0 | 1147 | 0.09 | 922 | 0.11 | 423 | 0 |
| 5 | 2021-02-06 | 3081 | 0.1 | 417 | 0 | 112 | 0 | 1137 | 0 | 999 | 0.1 | 402 | 0.5 |
| 6 | 2021-02-13 | 3039 | 0 | 608 | 0 | 119 | 0 | 1058 | 0 | 755 | 0 | 463 | 0 |
| 7 | 2021-02-20 | 2451 | 0.16 | 228 | 0 | 161 | 0 | 928 | 0.22 | 663 | 0 | 464 | 0.43 |
| 8 | 2021-02-27 | 2655 | 0.08 | 363 | 0 | 142 | 0 | 867 | 0 | 711 | 0 | 553 | 0.36 |
| 9 | 2021-03-06 | 2907 | 0.07 | 690 | 0 | 124 | 0.81 | 928 | 0.11 | 770 | 0 | 388 | 0 |
Positive Adenovirus (adeno) Tests
Figure 5: Positive Adenovirus (adeno) Tests (%) in Canada by Region by Week of Report
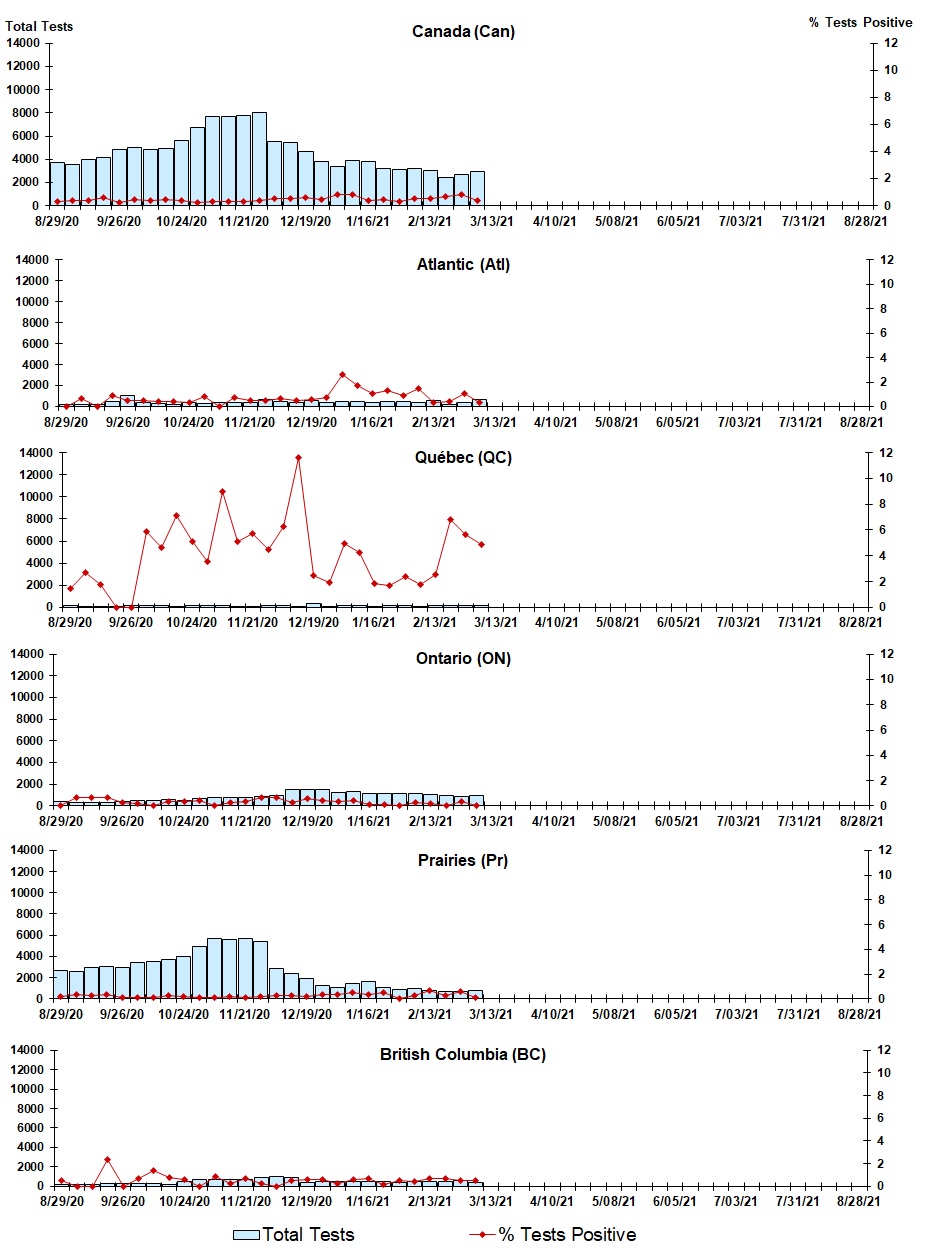
Figure 5: Positive Adenovirus (adeno) Tests (%) in Canada by Region by Week of Report - Text description
| Week | Week End | Can Tests | Adeno% | Atl Tests | Adeno% | QC Tests | Adeno% | ON Tests | Adeno% | Pr Tests | Adeno% | BC Tests | Adeno% |
|---|---|---|---|---|---|---|---|---|---|---|---|---|---|
| 35 | 2020-08-29 | 3650 | 0.3 | 154 | 0.0 | 135 | 1.5 | 344 | 0.0 | 2672 | 0.2 | 193 | 0.5 |
| 36 | 2020-09-05 | 3526 | 0.4 | 156 | 0.6 | 110 | 2.7 | 285 | 0.4 | 2617 | 0.3 | 207 | 0.0 |
| 37 | 2020-09-12 | 3949 | 0.3 | 223 | 0.0 | 112 | 1.8 | 288 | 0.4 | 2960 | 0.3 | 210 | 0.0 |
| 38 | 2020-09-19 | 4138 | 0.6 | 467 | 0.9 | 53 | 0.0 | 274 | 0.7 | 3022 | 0.4 | 250 | 2.4 |
| 39 | 2020-09-26 | 4760 | 0.2 | 999 | 0.5 | 151 | 0.0 | 375 | 0.3 | 2922 | 0.1 | 261 | 0.0 |
| 40 | 2020-10-03 | 4980 | 0.4 | 391 | 0.5 | 136 | 5.9 | 418 | 0.2 | 3470 | 0.1 | 279 | 0.7 |
| 41 | 2020-10-10 | 4805 | 0.4 | 250 | 0.4 | 130 | 4.6 | 433 | 0.0 | 3527 | 0.1 | 288 | 1.4 |
| 42 | 2020-10-17 | 4866 | 0.5 | 226 | 0.4 | 112 | 7.1 | 548 | 0.4 | 3662 | 0.3 | 243 | 0.8 |
| 43 | 2020-10-24 | 5576 | 0.4 | 330 | 0.3 | 137 | 5.1 | 489 | 0.4 | 3970 | 0.2 | 520 | 0.6 |
| 44 | 2020-10-31 | 6738 | 0.2 | 241 | 0.8 | 141 | 3.6 | 659 | 0.3 | 4967 | 0.1 | 667 | 0.0 |
| 45 | 2020-11-07 | 7627 | 0.3 | 341 | 0.0 | 134 | 9.0 | 738 | 0.0 | 5711 | 0.1 | 663 | 0.9 |
| 46 | 2020-11-14 | 7606 | 0.3 | 402 | 0.8 | 117 | 5.1 | 765 | 0.3 | 5575 | 0.2 | 698 | 0.3 |
| 47 | 2020-11-21 | 7711 | 0.3 | 413 | 0.5 | 105 | 5.7 | 736 | 0.4 | 5691 | 0.1 | 681 | 0.7 |
| 48 | 2020-11-28 | 7946 | 0.3 | 619 | 0.5 | 134 | 4.5 | 835 | 0.6 | 5370 | 0.2 | 888 | 0.2 |
| 49 | 2020-12-05 | 5424 | 0.5 | 453 | 0.7 | 127 | 6.3 | 909 | 0.6 | 2892 | 0.2 | 897 | 0.0 |
| 50 | 2020-12-12 | 5400 | 0.5 | 413 | 0.5 | 86 | 11.6 | 1502 | 0.2 | 2411 | 0.3 | 934 | 0.5 |
| 51 | 2020-12-19 | 4595 | 0.5 | 570 | 0.5 | 322 | 2.5 | 1437 | 0.5 | 1873 | 0.2 | 353 | 0.6 |
| 52 | 2020-12-26 | 3717 | 0.43 | 403 | 0.74 | 105 | 1.9 | 1468 | 0.27 | 1220 | 0.33 | 500 | 0.6 |
| 53 | 2021-01-02 | 3317 | 0.81 | 426 | 2.58 | 142 | 4.93 | 1203 | 0.33 | 1059 | 0.38 | 462 | 0.22 |
| 1 | 2021-01-09 | 3876 | 0.8 | 457 | 1.8 | 140 | 4.3 | 1273 | 0.3 | 1461 | 0.5 | 497 | 0.6 |
| 2 | 2021-01-16 | 3735 | 0.4 | 388 | 1.0 | 109 | 1.8 | 1091 | 0.1 | 1615 | 0.3 | 456 | 0.7 |
| 3 | 2021-01-23 | 3235 | 0.5 | 455 | 1.3 | 119 | 1.7 | 1102 | 0.1 | 1039 | 0.5 | 491 | 0.2 |
| 4 | 2021-01-30 | 3115 | 0.29 | 466 | 0.86 | 126 | 2.38 | 1147 | 0 | 922 | 0 | 423 | 0.47 |
| 5 | 2021-02-06 | 3164 | 0.54 | 417 | 1.44 | 112 | 1.79 | 1137 | 0.26 | 999 | 0.3 | 485 | 0.41 |
| 6 | 2021-02-13 | 3039 | 0.49 | 608 | 0.33 | 119 | 2.52 | 1058 | 0.19 | 755 | 0.66 | 463 | 0.65 |
| 7 | 2021-02-20 | 2456 | 0.69 | 233 | 0.43 | 161 | 6.83 | 928 | 0 | 663 | 0.3 | 464 | 0.65 |
| 8 | 2021-02-27 | 2657 | 0.83 | 365 | 1.1 | 142 | 5.63 | 867 | 0.35 | 711 | 0.56 | 553 | 0.54 |
| 9 | 2021-03-06 | 2907 | 0.38 | 690 | 0.29 | 124 | 4.84 | 928 | 0 | 770 | 0.13 | 388 | 0.52 |
Positive human metapneumovirus (hMPV) Tests
Figure 6: Positive human metapneumovirus (hMPV) Tests (%) in Canada by Region by Week of Report
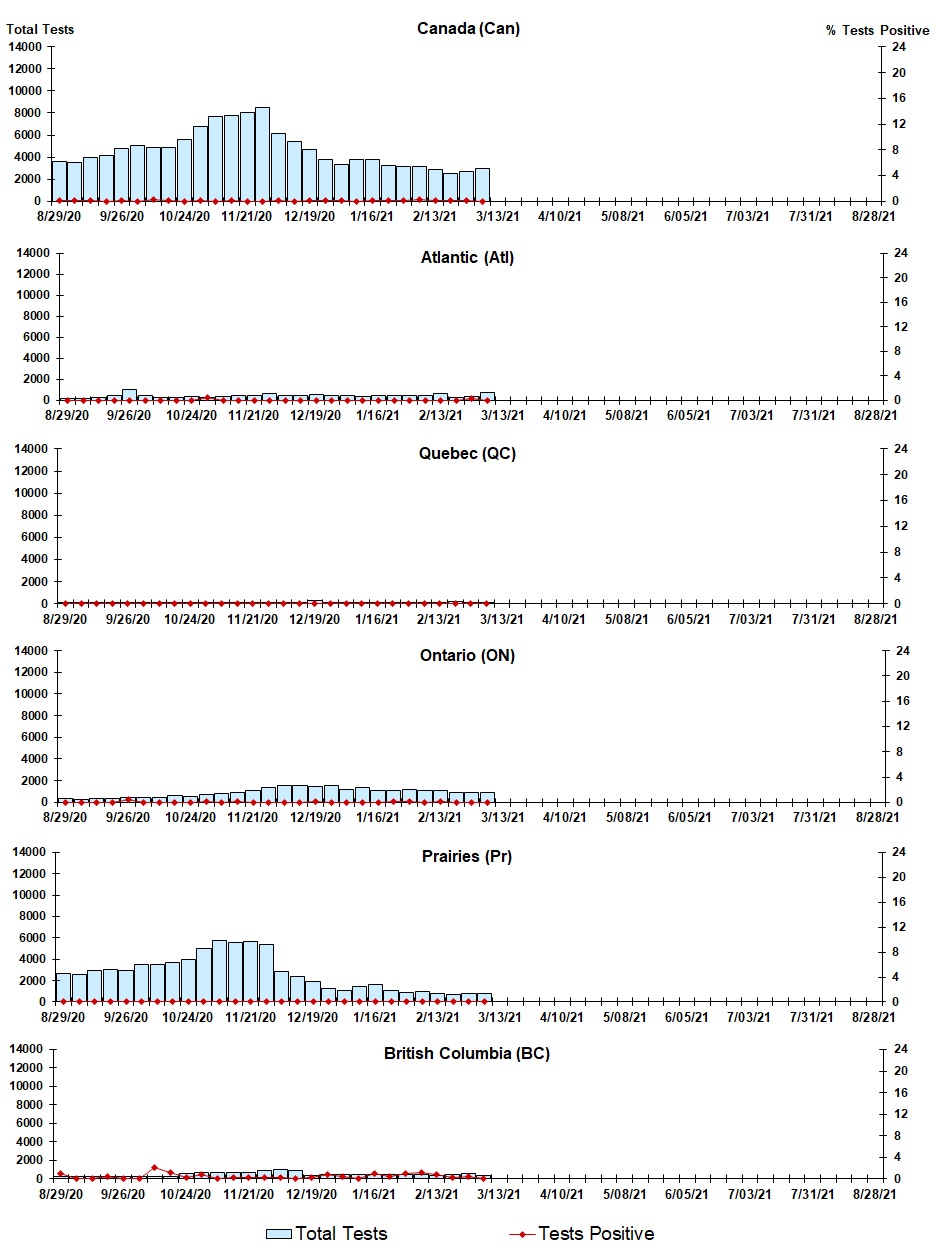
Figure 6: Positive human metapneumovirus (hMPV) Tests (%) in Canada by Region by Week of Report - Text description
| Week | Week End | Can Tests | hMPV% | Atl Tests | hMPV% | QC Tests | hMPV% | ON Tests | hMPV% | Pr Tests | hMPV% | BC Tests | hMPV% |
|---|---|---|---|---|---|---|---|---|---|---|---|---|---|
| 35 | 2020-08-29 | 3586 | 0.2 | 154 | 0.0 | 80 | 0.0 | 344 | 0.0 | 2663 | 0.0 | 193 | 1.0 |
| 36 | 2020-09-05 | 3514 | 0.1 | 156 | 0.0 | 108 | 0.0 | 281 | 0.0 | 2611 | 0.0 | 207 | 0.0 |
| 37 | 2020-09-12 | 3944 | 0.1 | 223 | 0.0 | 110 | 0.0 | 287 | 0.0 | 2958 | 0.1 | 210 | 0.0 |
| 38 | 2020-09-19 | 4142 | 0.0 | 467 | 0.0 | 50 | 0.0 | 289 | 0.0 | 3014 | 0.0 | 250 | 0.4 |
| 39 | 2020-09-26 | 4768 | 0.0 | 999 | 0.0 | 150 | 0.0 | 392 | 0.5 | 2914 | 0.0 | 261 | 0.0 |
| 40 | 2020-10-03 | 4984 | 0.0 | 391 | 0.0 | 135 | 0.0 | 431 | 0.0 | 3462 | 0.0 | 279 | 0.0 |
| 41 | 2020-10-10 | 4806 | 0.2 | 250 | 0.0 | 130 | 0.0 | 442 | 0.0 | 3519 | 0.1 | 288 | 2.1 |
| 42 | 2020-10-17 | 4878 | 0.1 | 226 | 0.0 | 112 | 0.0 | 564 | 0.0 | 3658 | 0.0 | 243 | 1.2 |
| 43 | 2020-10-24 | 5585 | 0.0 | 330 | 0.0 | 137 | 0.0 | 508 | 0.0 | 3960 | 0.0 | 520 | 0.2 |
| 44 | 2020-10-31 | 6750 | 0.1 | 241 | 0.4 | 139 | 0.0 | 680 | 0.2 | 4960 | 0.0 | 667 | 0.8 |
| 45 | 2020-11-07 | 7640 | 0.0 | 341 | 0.0 | 133 | 0.0 | 755 | 0.0 | 5708 | 0.0 | 663 | 0.0 |
| 46 | 2020-11-14 | 7693 | 0.0 | 402 | 0.0 | 117 | 0.0 | 857 | 0.1 | 5570 | 0.0 | 698 | 0.1 |
| 47 | 2020-11-21 | 7976 | 0.0 | 413 | 0.0 | 105 | 0.0 | 1002 | 0.0 | 5690 | 0.0 | 681 | 0.2 |
| 48 | 2020-11-28 | 8445 | 0.0 | 617 | 0.0 | 134 | 0.0 | 1337 | 0.0 | 5369 | 0.0 | 888 | 0.2 |
| 49 | 2020-12-05 | 6015 | 0.0 | 453 | 0.0 | 127 | 0.0 | 1503 | 0.0 | 2889 | 0.0 | 897 | 0.2 |
| 50 | 2020-12-12 | 5395 | 0.0 | 413 | 0.0 | 86 | 0.0 | 1502 | 0.0 | 2406 | 0.0 | 934 | 0.0 |
| 51 | 2020-12-19 | 4586 | 0.0 | 569 | 0.0 | 322 | 0.0 | 1434 | 0.1 | 1868 | 0.0 | 353 | 0.3 |
| 52 | 2020-12-26 | 3713 | 0.11 | 403 | 0.0 | 105 | 0.0 | 1468 | 0.0 | 1216 | 0.0 | 500 | 0.8 |
| 53 | 2021-01-02 | 3313 | 0.06 | 426 | 0.0 | 142 | 0.0 | 1202 | 0.0 | 1056 | 0.0 | 462 | 0.43 |
| 1 | 2021-01-09 | 3707 | 0.0 | 335 | 0.0 | 140 | 0.0 | 1273 | 0.0 | 1460 | 0.1 | 451 | 0.0 |
| 2 | 2021-01-16 | 3731 | 0.1 | 388 | 0.0 | 107 | 0.0 | 1091 | 0.0 | 1613 | 0.0 | 456 | 0.9 |
| 3 | 2021-01-23 | 3233 | 0.1 | 455 | 0.0 | 118 | 0.0 | 1102 | 0.2 | 1038 | 0.0 | 491 | 0.4 |
| 4 | 2021-01-30 | 3107 | 0.16 | 466 | 0.00 | 126 | 0 | 1146 | 0.09 | 915 | 0 | 423 | 0.95 |
| 5 | 2021-02-06 | 3157 | 0.19 | 417 | 0.00 | 112 | 0 | 1136 | 0 | 992 | 0 | 486 | 1.23 |
| 6 | 2021-02-13 | 2917 | 0.14 | 608 | 0.00 | 118 | 0 | 1058 | 0.09 | 747 | 0 | 350 | 0.86 |
| 7 | 2021-02-20 | 2494 | 0.04 | 228 | 0.00 | 161 | 0 | 928 | 0 | 706 | 0 | 464 | 0.22 |
| 8 | 2021-02-27 | 2694 | 0.11 | 363 | 0.28 | 141 | 0 | 867 | 0 | 751 | 0 | 553 | 0.36 |
| 9 | 2021-03-06 | 2946 | 0 | 690 | 0.00 | 124 | 0 | 928 | 0 | 809 | 0 | 388 | 0 |
Positive Enterovirus/Rhinovirus (entero/rhino) Tests
Figure 7: Positive Enterovirus/Rhinovirus (entero/rhino) Tests (%) in Canada by Region by Week of Report
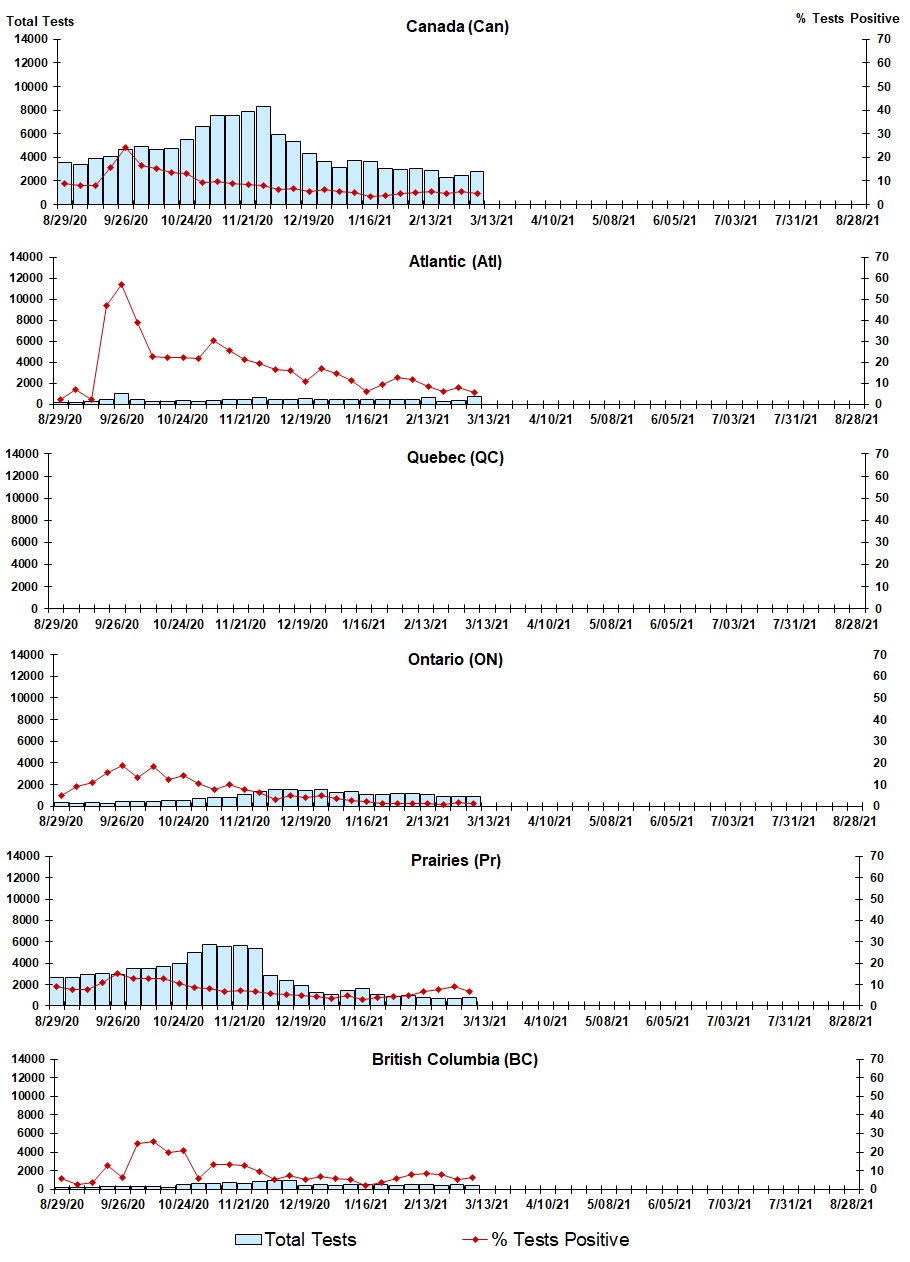
Figure 7: Positive Enterovirus/Rhinovirus (entero/rhino) Tests (%) in Canada by Region by Week of Report - Text description
| Week | Week End | Canada Tests | Entero/rhino% | Atl Tests | Entero/rhino% | QC Tests | Entero/rhino% | ON Tests | Entero/rhino% | Pr Tests | Entero/rhino% | BC Tests | Entero/rhino% |
|---|---|---|---|---|---|---|---|---|---|---|---|---|---|
| 35 | 2020-08-29 | 3515 | 9.1 | 154 | 2.0 | N.A. | N.A. | 344 | 4.7 | 2672 | 9.1 | 193 | 5.7 |
| 36 | 2020-09-05 | 3415 | 8.1 | 156 | 7.1 | N.A. | N.A. | 284 | 9.2 | 2617 | 7.5 | 207 | 2.4 |
| 37 | 2020-09-12 | 3837 | 8.1 | 223 | 2.2 | N.A. | N.A. | 288 | 11.8 | 2960 | 7.6 | 210 | 3.3 |
| 38 | 2020-09-19 | 4085 | 15.7 | 467 | 46.9 | N.A. | N.A. | 274 | 16.4 | 3022 | 10.8 | 250 | 12.8 |
| 39 | 2020-09-26 | 4609 | 24.3 | 999 | 56.9 | N.A. | N.A. | 375 | 20.0 | 2922 | 15.0 | 261 | 6.5 |
| 40 | 2020-10-03 | 4844 | 16.6 | 391 | 39.1 | N.A. | N.A. | 418 | 13.2 | 3470 | 12.9 | 279 | 24.7 |
| 41 | 2020-10-10 | 4675 | 15.3 | 250 | 22.8 | N.A. | N.A. | 433 | 17.1 | 3527 | 12.8 | 288 | 25.7 |
| 42 | 2020-10-17 | 4734 | 13.6 | 226 | 22.1 | N.A. | N.A. | 548 | 12.0 | 3662 | 12.7 | 223 | 19.7 |
| 43 | 2020-10-24 | 5441 | 13.1 | 330 | 22.4 | N.A. | N.A. | 509 | 14.5 | 3970 | 10.5 | 502 | 20.7 |
| 44 | 2020-10-31 | 6580 | 9.2 | 241 | 21.6 | N.A. | N.A. | 659 | 10.5 | 4967 | 8.5 | 650 | 5.7 |
| 45 | 2020-11-07 | 7492 | 9.7 | 341 | 30.2 | N.A. | N.A. | 752 | 7.3 | 5711 | 8.0 | 648 | 13.4 |
| 46 | 2020-11-14 | 7483 | 9.0 | 402 | 25.6 | N.A. | N.A. | 765 | 10.1 | 5575 | 6.9 | 692 | 13.3 |
| 47 | 2020-11-21 | 7875 | 8.5 | 413 | 21.3 | N.A. | N.A. | 1024 | 7.8 | 5691 | 7.1 | 662 | 12.8 |
| 48 | 2020-11-28 | 8294 | 7.9 | 617 | 19.3 | N.A. | N.A. | 1337 | 6.5 | 5370 | 6.7 | 870 | 9.3 |
| 49 | 2020-12-05 | 5891 | 6.2 | 453 | 16.6 | N.A. | N.A. | 1503 | 3.1 | 2892 | 5.6 | 897 | 5.2 |
| 50 | 2020-12-12 | 5292 | 6.6 | 413 | 16.2 | N.A. | N.A. | 1502 | 5.1 | 2411 | 5.4 | 912 | 7.1 |
| 51 | 2020-12-19 | 4263 | 5.7 | 569 | 10.9 | N.A. | N.A. | 1437 | 3.9 | 1873 | 4.8 | 344 | 4.9 |
| 52 | 2020-12-26 | 3600 | 6.47 | 403 | 17.12 | N.A. | N.A. | 1468 | 4.63 | 1220 | 4.43 | 488 | 6.76 |
| 53 | 2021-01-02 | 3159 | 5.35 | 426 | 14.55 | N.A. | N.A. | 1203 | 3.24 | 1059 | 3.49 | 446 | 5.83 |
| 1 | 2021-01-09 | 3715 | 5.2 | 456 | 11.4 | N.A. | N.A. | 1273 | 2.6 | 1461 | 4.8 | 477 | 5.0 |
| 2 | 2021-01-16 | 3621 | 3.5 | 388 | 6.2 | N.A. | N.A. | 1091 | 2.2 | 1615 | 3.2 | 451 | 2.0 |
| 3 | 2021-01-23 | 3100 | 3.9 | 455 | 9.2 | N.A. | N.A. | 1102 | 1.3 | 1039 | 4.1 | 475 | 3.6 |
| 4 | 2021-01-30 | 2985 | 4.76 | 466 | 12.45 | N.A. | N.A. | 1147 | 1.48 | 922 | 4.23 | 419 | 5.49 |
| 5 | 2021-02-06 | 3050 | 5.08 | 417 | 11.75 | N.A. | N.A. | 1137 | 1.23 | 999 | 4.9 | 483 | 7.87 |
| 6 | 2021-02-13 | 2914 | 5.56 | 608 | 8.39 | N.D. | N.D. | 1058 | 1.13 | 755 | 6.75 | 457 | 8.32 |
| 7 | 2021-02-20 | 2275 | 4.84 | 228 | 6.14 | N.D. | N.D. | 928 | 0.86 | 663 | 7.69 | 449 | 8.02 |
| 8 | 2021-02-27 | 2506 | 5.55 | 363 | 7.71 | N.D. | N.D. | 867 | 1.85 | 711 | 9 | 546 | 5.31 |
| 9 | 2021-03-06 | 2778 | 4.54 | 690 | 5.65 | N.D. | N.D. | 928 | 1.19 | 770 | 6.75 | 383 | 6.27 |
Positive Coronavirus (coron) Tests
Figure 8: Positive Coronavirus (coron) Tests (%) in Canada by Region by Week of Report
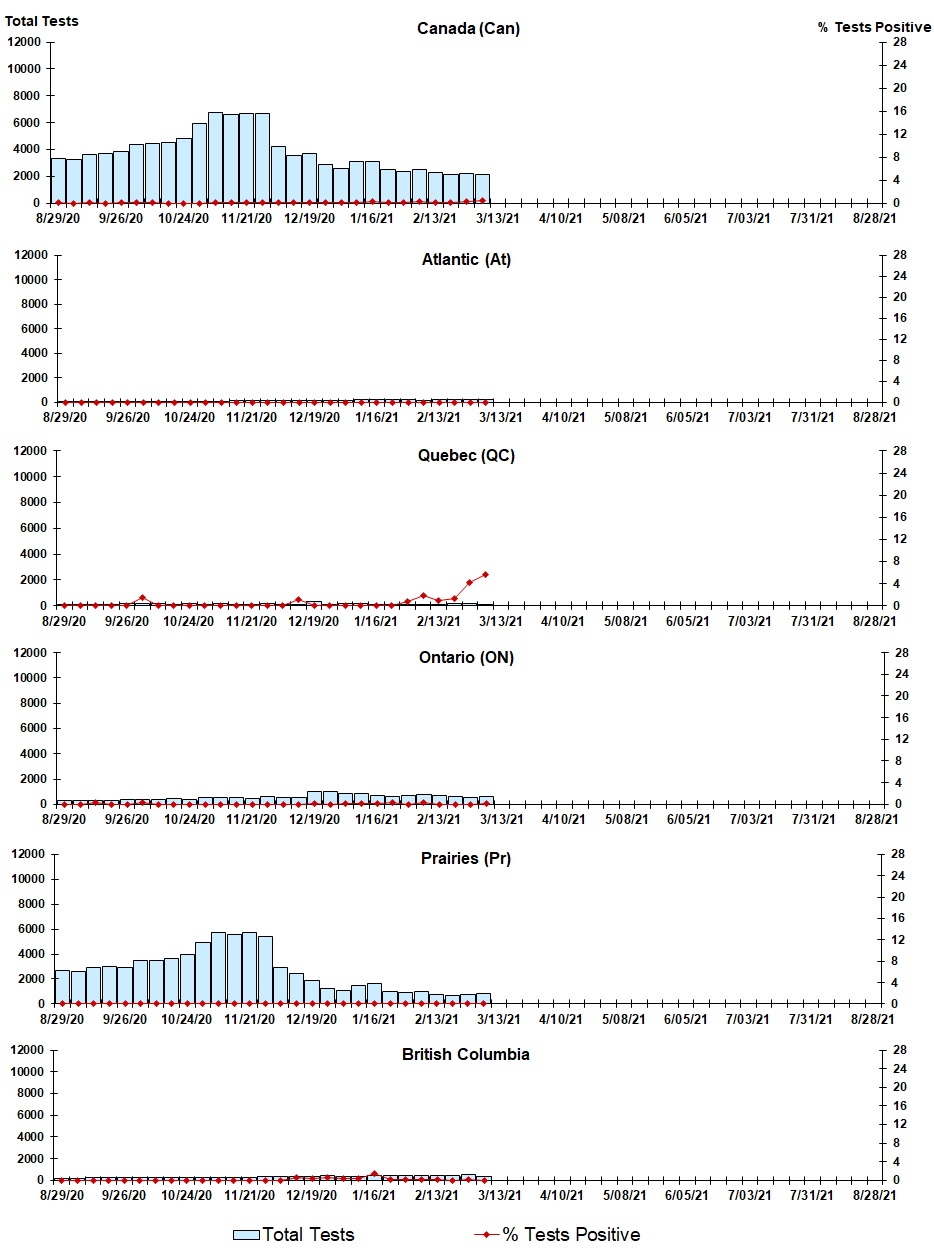
Figure 8: Positive Coronavirus (coron) Tests (%) in Canada by Region by Week of Report - Text description
| Week | Week End | Canada Tests | Coron% | Atl Tests | Coron% | QC Tests | Coron% | ON Tests | Coron% | Pr Tests | Coron% | BC Tests | Coron% |
|---|---|---|---|---|---|---|---|---|---|---|---|---|---|
| 35 | 2020-08-29 | 3295 | 0.1 | 29 | 0.0 | 80 | 0.0 | 280 | 0.0 | 2663 | 0.1 | 193 | 0.0 |
| 36 | 2020-09-05 | 3226 | 0.0 | 8 | 0.0 | 108 | 0.0 | 246 | 0.0 | 2611 | 0.0 | 207 | 0.0 |
| 37 | 2020-09-12 | 3610 | 0.1 | 26 | 0.0 | 110 | 0.0 | 236 | 0.4 | 2958 | 0.0 | 210 | 0.0 |
| 38 | 2020-09-19 | 3680 | 0.0 | 20 | 0.0 | 50 | 0.0 | 274 | 0.0 | 3014 | 0.0 | 250 | 0.0 |
| 39 | 2020-09-26 | 3771 | 0.1 | 20 | 0.0 | 150 | 0.0 | 374 | 0.0 | 2914 | 0.1 | 261 | 0.0 |
| 40 | 2020-10-03 | 4341 | 0.1 | 17 | 0.0 | 135 | 1.5 | 357 | 0.3 | 3462 | 0.0 | 279 | 0.0 |
| 41 | 2020-10-10 | 4390 | 0.0 | 40 | 0.0 | 130 | 0.0 | 352 | 0.0 | 3519 | 0.0 | 288 | 0.0 |
| 42 | 2020-10-17 | 4476 | 0.0 | 32 | 0.0 | 112 | 0.0 | 411 | 0.0 | 3658 | 0.0 | 223 | 0.0 |
| 43 | 2020-10-24 | 4805 | 0.0 | 51 | 0.0 | 137 | 0.0 | 370 | 0.0 | 3960 | 0.0 | 232 | 0.0 |
| 44 | 2020-10-31 | 5913 | 0.0 | 61 | 0.0 | 122 | 0.0 | 480 | 0.0 | 4960 | 0.0 | 268 | 0.0 |
| 45 | 2020-11-07 | 6701 | 0.0 | 74 | 0.0 | 130 | 0.0 | 512 | 0.0 | 5708 | 0.0 | 248 | 0.0 |
| 46 | 2020-11-14 | 6574 | 0.0 | 129 | 0.0 | 117 | 0.0 | 477 | 0.0 | 5570 | 0.0 | 234 | 0.0 |
| 47 | 2020-11-21 | 6649 | 0.1 | 116 | 0.0 | 105 | 0.0 | 411 | 0.0 | 5690 | 0.1 | 293 | 0.0 |
| 48 | 2020-11-28 | 6604 | 0.0 | 145 | 0.0 | 134 | 0.0 | 548 | 0.0 | 5369 | 0.0 | 358 | 0.0 |
| 49 | 2020-12-05 | 4045 | 0.1 | 135 | 0.0 | 127 | 0.0 | 503 | 0.0 | 2889 | 0.1 | 265 | 0.0 |
| 50 | 2020-12-12 | 3495 | 0.1 | 127 | 0.0 | 86 | 1.2 | 486 | 0.0 | 2406 | 0.0 | 339 | 0.6 |
| 51 | 2020-12-19 | 3661 | 0.1 | 99 | 0.0 | 322 | 0.0 | 989 | 0.1 | 1868 | 0.0 | 344 | 0.3 |
| 52 | 2020-12-26 | 2843 | 0.07 | 129 | 0.0 | 105 | 0.0 | 971 | 0.0 | 1216 | 0.0 | 401 | 0.5 |
| 53 | 2021-01-02 | 2526 | 0.12 | 129 | 0.0 | 142 | 0.0 | 824 | 0.24 | 1056 | 0.0 | 350 | 0.29 |
| 1 | 2021-01-09 | 3011 | 0.2 | 215 | 0.0 | 140 | 0.0 | 829 | 0.2 | 1460 | 0.1 | 319 | 0.3 |
| 2 | 2021-01-16 | 3089 | 0.3 | 180 | 0.0 | 107 | 0.0 | 696 | 0.1 | 1613 | 0.1 | 417 | 1.4 |
| 3 | 2021-01-23 | 2524 | 0.2 | 234 | 0.0 | 118 | 0.0 | 639 | 0.3 | 1038 | 0.1 | 470 | 0.2 |
| 4 | 2021-01-30 | 2387 | 0.13 | 179 | 0 | 126 | 0.79 | 719 | 0 | 915 | 0.11 | 417 | 0.24 |
| 5 | 2021-02-06 | 2508 | 0.2 | 165 | 0 | 112 | 1.79 | 746 | 0.27 | 992 | 0 | 480 | 0.21 |
| 6 | 2021-02-13 | 2265 | 0.13 | 191 | 0 | 118 | 0.85 | 725 | 0 | 747 | 0.13 | 450 | 0.22 |
| 7 | 2021-02-20 | 2157 | 0.14 | 198 | 0 | 161 | 1.24 | 636 | 0 | 706 | 0.14 | 449 | 0 |
| 8 | 2021-02-27 | 2211 | 0.32 | 200 | 0 | 141 | 4.26 | 566 | 0 | 751 | 0 | 534 | 0.19 |
| 9 | 2021-03-06 | 2098 | 0.38 | 193 | 0 | 124 | 5.65 | 596 | 0.17 | 809 | 0 | 369 | 0 |