
Respiratory Virus Report, Week 2 - ending January 14, 2023
Download in PDF format
(1.95 MB, 13 pages)
Organization: Public Health Agency of Canada
Please note that the Respiratory Virus Detection Surveillance System (RVDSS) is a sentinel laboratory surveillance system that does not capture all respiratory virus testing performed in Canada; differences may exist between the data presented in this report and provincial/territorial epidemiological reports. SARS-CoV-2 laboratory data is included in this report to facilitate the comparison of positivity with other respiratory viruses. Interpretation should be made with caution as testing practices differ among viruses.
For additional SARS-CoV-2 surveillance information, please refer to the COVID-19 epidemiology update.
Overall Summary
In week 2 (week ending January 14, 2023) in Canada, participating RVDSS laboratories reported 9,575 detections of SARS-CoV-2 from 71,421 tests (13.4% positive). Among non-SARS-CoV-2 respiratory viruses, where test volumes are lower (range of 9,117 to 34,515 tests), activity of all viruses is stable or decreasing.
- Activity of influenza continues to decrease sharply and is now below the epidemic threshold. Influenza A accounts for nearly all influenza detections in Canada (779 detections; 2.3% positive).
- Activity of RSV is following seasonal trends at the national level. Compared to pre-pandemic seasons, RSV activity is near average levels typical of this time of year (2,671 detections; 9.2% positive).
- Activity of all other non-SARS-CoV-2 respiratory viruses is near expected levels typical of this time of year.
- 33/35 sentinel laboratories reported surveillance data.
On this page
- List of abbreviations
- Respiratory virus detections
- Positive respiratory virus tests historical comparison
- Positive severe acute respiratory syndrome coronavirus 2 (SARS-CoV-2) tests
- Positive influenza (Flu) tests
- Positive respiratory syncytial virus (RSV) tests
- Positive human parainfluenza virus (HPIV) tests
- Positive adenovirus (ADV) tests
- Positive human metapneumovirus (HMPV) tests
- Positive enterovirus/rhinovirus (EV/ RV) tests
- Positive human coronavirus (HCoV) tests
Abbreviations:
- ADV
- Adenovirus
- Atl
- Atlantic Canada
- BC
- British Columbia
- Can
- Canada
- EORLA
- Eastern Ontario Regional Laboratory Association
- EV/RV
- Enterovirus/Rhinovirus
- Flu
- Influenza
- Flu A(H1)pdm09
- Influenza A(H1N1)pdm09
- Flu A(H3)
- Influenza A(H3N2)
- Flu A(UnS)
- Influenza A(Unsubtyped)
- HCoV
- Human coronavirus 229E/OC43/NL63/HKU1
- HMPV
- Human metapneumovirus
- HPIV
- Human parainfluenza virus
- HSC
- Health Sciences Centre
- N.C.
- Data not collected
- N.R.
- Data not reported for current week
- ON
- Ontario
- PR
- Prairies
- P.H.O.L.
- Public Health Ontario Laboratory
- QC
- Quebec
- RSV
- Respiratory syncytial virus
- RVDSS
- Respiratory Virus Detection Surveillance System
- SARS-CoV-2
- Severe acute respiratory syndrome coronavirus 2
- Terr
- Territories of Canada
- UHN
- University Health Network
Respiratory virus detections
Table 1: Respiratory virus detections for the week ending January 14, 2023 (surveillance week 2023-02)
| Reporting Laboratory | SARS-CoV-2 Tested | SARS-CoV-2 Positive | Flu Tested | A(H1)pdm09 Positive | A(H3) Positive | A(UnS) Positive | Total Flu A Positive | Total Flu B Positive | RSV Tested | RSV Positive | HPIV Tested | HPIV 1 Positive | HPIV 2 Positive | HPIV 3 Positive | HPIV 4 Positive | Other HPIV Positive | ADV Tested | ADV Positive | HMPV Tested | HMPV Positive | EV/RV Tested | EV/RV Positive | HCoV Tested | HCoV Positive |
|---|---|---|---|---|---|---|---|---|---|---|---|---|---|---|---|---|---|---|---|---|---|---|---|---|
| Newfoundland | 724 | 100 | 374 | 0 | 0 | 19 | 19 | 0 | 374 | 8 | 374 | 0 | 1 | 10 | 0 | 0 | 374 | 6 | 374 | 5 | 374 | 14 | 374 | 39 |
| Prince Edward Island | 903 | 162 | 200 | 0 | 0 | 10 | 10 | 0 | 200 | 30 | 20 | 0 | 0 | 3 | 0 | 0 | 20 | 1 | 20 | 0 | 20 | 4 | 20 | 2 |
| Nova Scotia | 3796 | 938 | 1574 | 0 | 0 | 38 | 38 | 0 | 1574 | 138 | 33 | 0 | 0 | 1 | 0 | 0 | 33 | 1 | 33 | 0 | 33 | 2 | 33 | 1 |
| New Brunswick | 4207 | 444 | 2143 | 0 | 8 | 31 | 39 | 1 | 1930 | 126 | 99 | 0 | 0 | 5 | 0 | 0 | 99 | 10 | 99 | 11 | 99 | 15 | 99 | 10 |
| Atlantic | 9630 | 1644 | 4291 | 0 | 8 | 98 | 106 | 1 | 4078 | 302 | 526 | 0 | 1 | 19 | 0 | 0 | 526 | 18 | 526 | 16 | 526 | 35 | 526 | 52 |
| Région Nord-Est | 2628 | 314 | 1718 | 0 | 0 | 112 | 112 | 1 | 559 | 45 | 30 | 0 | 0 | 1 | 0 | 0 | 30 | 3 | 30 | 0 | N.C. | N.C. | 30 | 2 |
| Québec-Chaudière-Appalaches | 5348 | 555 | 1018 | 0 | 0 | 49 | 49 | 0 | 965 | 53 | 165 | 0 | 1 | 1 | 0 | 0 | 174 | 14 | 165 | 12 | N.C. | N.C. | 165 | 3 |
| Centre-du-Québec | 3849 | 509 | 521 | 0 | 0 | 17 | 17 | 0 | 414 | 19 | 25 | 1 | 0 | 1 | 1 | 0 | 25 | 5 | 25 | 2 | N.C. | N.C. | 25 | 2 |
| Montréal-Laval | 4123 | 566 | 3787 | 0 | 1 | 97 | 98 | 6 | 1557 | 45 | 565 | 0 | 0 | 9 | 0 | 0 | 565 | 24 | 568 | 6 | N.C. | N.C. | 565 | 21 |
| Ouest du Québec | 3211 | 382 | 1021 | 0 | 0 | 18 | 18 | 1 | 989 | 63 | 20 | 0 | 0 | 3 | 0 | 0 | 20 | 4 | 20 | 1 | N.C. | N.C. | 21 | 0 |
| Montérégie | 3376 | 398 | 757 | 0 | 0 | 12 | 12 | 0 | 731 | 27 | 5 | 0 | 0 | 0 | 0 | 0 | 5 | 0 | 5 | 0 | N.C. | N.C. | 5 | 0 |
| Province of Québec | 22535 | 2724 | 8822 | 0 | 1 | 305 | 306 | 8 | 5215 | 252 | 810 | 1 | 1 | 15 | 1 | 0 | 819 | 50 | 813 | 21 | N.C. | N.C. | 811 | 28 |
| P.H.O.L. - Ottawa | 812 | 208 | 249 | 1 | 0 | 1 | 2 | 0 | 249 | 32 | 140 | 0 | 0 | 0 | 0 | 4 | 140 | 0 | 140 | 8 | 140 | 5 | 140 | 10 |
| EORLA | 1877 | 146 | 508 | 0 | 0 | 14 | 14 | 0 | 508 | 41 | 30 | 1 | 0 | 1 | 0 | 0 | 30 | 3 | 30 | 1 | 30 | 5 | 30 | 1 |
| P.H.O.L. - Kingston | 733 | 179 | 133 | 0 | 0 | 0 | 0 | 0 | 133 | 20 | 82 | 0 | 0 | 0 | 0 | 2 | 82 | 1 | 82 | 0 | 82 | 2 | 82 | 5 |
| UHN / Mount Sinai Hospital | 2737 | 266 | 700 | 1 | 0 | 6 | 7 | 0 | 700 | 14 | 68 | 0 | 0 | 0 | 0 | 0 | 68 | 0 | 68 | 0 | 68 | 4 | 68 | 2 |
| P.H.O.L. - Toronto | 1172 | 283 | 1205 | 5 | 24 | 3 | 18 | 0 | 1205 | 129 | 1011 | 0 | 0 | 0 | 0 | 37 | 1011 | 12 | 1011 | 26 | 1011 | 66 | 1011 | 73 |
| Sick Kids Hospital - Toronto | N.R. | N.R. | N.R. | N.R. | N.R. | N.R. | N.R. | N.R. | N.R. | N.R. | N.R. | N.R. | N.R. | N.R. | N.R. | N.R. | N.R. | N.R. | N.R. | N.R. | N.R. | N.R. | N.R. | N.R. |
| Shared Hospital Laboratory | 2436 | 233 | 2436 | 6 | 22 | 2 | 30 | 3 | 2436 | 93 | 2432 | 0 | 0 | 0 | 0 | 36 | 2432 | 24 | 2450 | 27 | 2450 | 48 | 2450 | 35 |
| P.H.O.L. - Sault Ste. Marie | 20 | 3 | 20 | 0 | 4 | 2 | 4 | 0 | 20 | 0 | 16 | 0 | 0 | 0 | 0 | 3 | 16 | 0 | 16 | 1 | 16 | 0 | 16 | 3 |
| P.H.O.L. - Timmins | 200 | 15 | 55 | 0 | 1 | 0 | 1 | 0 | 55 | 14 | 52 | 0 | 0 | 0 | 0 | 0 | 52 | 2 | 52 | 1 | 52 | 2 | 52 | 6 |
| St. Joseph's - London | 3462 | 449 | 908 | 0 | 0 | 5 | 5 | 3 | 908 | 71 | 85 | 0 | 0 | 0 | 0 | 5 | 85 | 2 | 85 | 0 | 85 | 7 | 85 | 3 |
| P.H.O.L. - London | 969 | 252 | 523 | 0 | 1 | 0 | 1 | 2 | 523 | 68 | 368 | 0 | 0 | 0 | 0 | 17 | 368 | 7 | 368 | 3 | 368 | 8 | 368 | 16 |
| P.H.O.L. - Orillia | 6 | 0 | 64 | 2 | 2 | 0 | 4 | 0 | 64 | 9 | 62 | 0 | 0 | 0 | 0 | 2 | 62 | 2 | 62 | 9 | 62 | 5 | 62 | 2 |
| P.H.O.L. - Thunder Bay | 285 | 75 | 74 | 0 | 0 | 0 | 0 | 0 | 74 | 12 | 60 | 0 | 0 | 0 | 0 | 6 | 60 | 1 | 60 | 3 | 60 | 0 | 60 | 1 |
| P.H.O.L. - Sudbury | 79 | 16 | 67 | 0 | 1 | 2 | 2 | 0 | 67 | 11 | 49 | 0 | 0 | 0 | 0 | 1 | 49 | 0 | 49 | 4 | 49 | 2 | 49 | 3 |
| P.H.O.L. - Hamilton | 882 | 310 | 504 | 0 | 4 | 2 | 6 | 0 | 504 | 37 | 257 | 0 | 0 | 0 | 0 | 11 | 257 | 4 | 257 | 5 | 257 | 32 | 257 | 6 |
| P.H.O.L. - Peterborough | 197 | 45 | 51 | 0 | 1 | 0 | 1 | 0 | 51 | 10 | 31 | 0 | 0 | 0 | 0 | 0 | 31 | 0 | 31 | 2 | 31 | 2 | 31 | 3 |
| St. Joseph's - Hamilton | 3208 | 474 | 1659 | 0 | 0 | 25 | 25 | 0 | 1659 | 108 | 1659 | 0 | 0 | 47 | 0 | 0 | 1659 | 14 | 1659 | 25 | 1659 | 70 | 0 | 0 |
| Sault Area Hospital | 377 | 42 | 377 | 0 | 4 | 1 | 5 | 0 | 377 | 7 | 44 | 3 | 0 | 5 | 1 | 0 | 44 | 0 | 44 | 1 | 44 | 4 | 44 | 6 |
| Province of Ontario | 19452 | 2996 | 9533 | 15 | 64 | 63 | 125 | 8 | 9533 | 676 | 6446 | 4 | 0 | 53 | 1 | 124 | 6446 | 72 | 6464 | 116 | 6464 | 262 | 4805 | 175 |
| Manitoba | 1834 | 208 | 1499 | 1 | 3 | 25 | 29 | 0 | 1499 | 131 | 127 | 0 | 0 | 2 | 0 | 0 | 127 | 3 | 157 | 9 | 127 | 9 | 157 | 20 |
| Saskatchewan | 5352 | 271 | 1382 | 0 | 0 | 21 | 21 | 0 | 1100 | 159 | 545 | 3 | 0 | 19 | 0 | 0 | 545 | 20 | 545 | 31 | 545 | 29 | 545 | 18 |
| Alberta | 6645 | 971 | 4385 | 24 | 23 | 41 | 88 | 1 | 3902 | 605 | 1559 | 6 | 2 | 32 | 5 | 0 | 1557 | 15 | 1553 | 58 | 1538 | 67 | 1559 | 22 |
| Prairies | 13831 | 1450 | 7266 | 25 | 26 | 87 | 138 | 1 | 6501 | 895 | 2231 | 9 | 2 | 53 | 5 | 0 | 2229 | 38 | 2255 | 98 | 2210 | 105 | 2261 | 60 |
| British Columbia | 5692 | 736 | 4491 | 7 | 16 | 0 | 99 | 1 | 3640 | 543 | 746 | 0 | 1 | 38 | 13 | 0 | 746 | 23 | 746 | 22 | 714 | 53 | 714 | 55 |
| Yukon | 128 | 7 | 45 | 0 | 1 | 0 | 5 | 0 | 45 | 1 | N.C. | N.C. | N.C. | N.C. | N.C. | N.C. | N.C. | N.C. | N.C. | N.C. | N.C. | N.C. | N.C. | N.C. |
| Northwest Territories | N.R. | N.R. | N.R. | N.R. | N.R. | N.R. | N.R. | N.R. | N.R. | N.R. | N.C. | N.C. | N.C. | N.C. | N.C. | N.C. | N.C. | N.C. | N.C. | N.C. | 0 | 0 | N.C. | N.C. |
| Nunavut | 153 | 18 | 67 | 0 | 0 | 0 | 0 | 0 | 67 | 2 | N.C. | N.C. | N.C. | N.C. | N.C. | N.C. | N.C. | N.C. | N.C. | N.C. | N.C. | N.C. | N.C. | N.C. |
| Territories | 281 | 25 | 112 | 0 | 1 | 0 | 5 | 0 | 112 | 3 | N.C. | N.C. | N.C. | N.C. | N.C. | N.C. | N.C. | N.C. | N.C. | N.C. | 0 | 0 | N.C. | N.C. |
| CANADA | 71421 | 9575 | 34515 | 47 | 116 | 553 | 779 | 19 | 29079 | 2671 | 10759 | 14 | 5 | 178 | 20 | 124 | 10766 | 201 | 10804 | 273 | 9914 | 455 | 9117 | 370 |
The data in the RVDSS report represent surveillance data available at the time of writing. Data missing from the current week are denoted by N.R. Data not collected by reporting lab denoted by N.C.
Some specimens from Yukon (YT) are sent to reference laboratories in British Columbia and reported results reflect specimens identified as originating from YT.
Results from British Columbia comprise of specimens from the following sites: Children's and Women's Hospital Laboratory, Fraser Health Medical Microbiology Laboratory, Island Health, Providence Health Care, Vancouver Coastal Health sites, Victoria General Hospital, BCCDC Public Health Laboratory, Interior Health Authority sites and Northern Health Authority sites.
Due to different testing protocols of laboratories across Canada, influenza A subtype detection counts may not be included in total influenza A detection counts. Total influenza A and B positive counts are used to calculate percentage of tests positive.
Delays in the reporting of data may cause data to change retrospectively.
Table 2: Cumulative respiratory virus detections from August 28, 2022 to January 14, 2023 (surveillance weeks 2022-35 to 2023-02)
| Reporting Laboratory | SARS-CoV-2 Tested | SARS-CoV-2 Positive | Flu Tested | A(H1)pdm09 Positive | A(H3) Positive | A(UnS) Positive | Total Flu A Positive | Total Flu B Positive | RSV Tested | RSV Positive | HPIV Tested | HPIV 1 Positive | HPIV 2 Positive | HPIV 3 Positive | HPIV 4 Positive | Other HPIV Positive | ADV Tested | ADV Positive | HMPV Tested | HMPV Positive | EV/RV Tested | EV/RV Positive | HCoV Tested | HCoV Positive |
|---|---|---|---|---|---|---|---|---|---|---|---|---|---|---|---|---|---|---|---|---|---|---|---|---|
| Newfoundland | 11810 | 2481 | 6657 | 1 | 246 | 661 | 908 | 0 | 6657 | 232 | 6657 | 4 | 29 | 48 | 16 | 0 | 6657 | 135 | 6657 | 244 | 6657 | 540 | 6657 | 233 |
| Prince Edward Island | 23723 | 5921 | 2049 | 1 | 117 | 234 | 352 | 0 | 2049 | 147 | 946 | 15 | 25 | 72 | 6 | 0 | 946 | 56 | 946 | 11 | 946 | 301 | 946 | 24 |
| Nova Scotia | 91895 | 18279 | 23006 | 0 | 4 | 3571 | 3575 | 1 | 23005 | 1716 | 806 | 4 | 16 | 21 | 2 | 0 | 805 | 34 | 795 | 2 | 805 | 161 | 805 | 19 |
| New Brunswick | 79543 | 11398 | 28460 | 2 | 128 | 4390 | 4520 | 4 | 22093 | 1312 | 2023 | 3 | 19 | 112 | 7 | 0 | 2023 | 147 | 2023 | 38 | 2023 | 389 | 1968 | 135 |
| Atlantic | 206971 | 38079 | 60172 | 4 | 495 | 8856 | 9355 | 5 | 53804 | 3407 | 10432 | 26 | 89 | 253 | 31 | 0 | 10431 | 372 | 10421 | 295 | 10431 | 1391 | 10376 | 411 |
| Région Nord-Est | 58030 | 8025 | 27994 | 0 | 2 | 3472 | 3474 | 8 | 9690 | 962 | 728 | 7 | 3 | 45 | 0 | 0 | 728 | 37 | 721 | 45 | N.C. | N.C. | 728 | 36 |
| Québec-Chaudière-Appalaches | 127090 | 12718 | 15328 | 0 | 0 | 2731 | 2731 | 10 | 15057 | 1581 | 4275 | 20 | 5 | 39 | 0 | 0 | 4521 | 285 | 4275 | 212 | N.C. | N.C. | 4275 | 179 |
| Centre-du-Québec | 100600 | 14496 | 10522 | 0 | 0 | 1721 | 1721 | 13 | 9163 | 809 | 549 | 13 | 0 | 23 | 2 | 0 | 549 | 44 | 549 | 56 | N.C. | N.C. | 549 | 25 |
| Montréal-Laval | 139944 | 18697 | 52491 | 0 | 9 | 5799 | 5808 | 67 | 29537 | 2149 | 13192 | 121 | 13 | 224 | 10 | 0 | 13201 | 521 | 13293 | 599 | N.C. | N.C. | 12877 | 362 |
| Ouest du Québec | 77214 | 10777 | 12677 | 0 | 7 | 2122 | 2129 | 7 | 10783 | 954 | 680 | 20 | 0 | 51 | 1 | 0 | 679 | 127 | 680 | 39 | N.C. | N.C. | 681 | 26 |
| Montérégie | 99583 | 11894 | 13508 | 0 | 0 | 1597 | 1597 | 11 | 12931 | 903 | 80 | 0 | 0 | 2 | 0 | 0 | 80 | 1 | 80 | 4 | N.C. | N.C. | 80 | 1 |
| Province of Québec | 602461 | 76607 | 132520 | 0 | 18 | 17442 | 17460 | 116 | 87161 | 7358 | 19504 | 181 | 21 | 384 | 13 | 0 | 19758 | 1015 | 19598 | 955 | N.C. | N.C. | 19190 | 629 |
| P.H.O.L. - Ottawa | 20809 | 5316 | 2769 | 5 | 131 | 62 | 193 | 0 | 2769 | 213 | 2042 | 0 | 0 | 0 | 0 | 50 | 2042 | 6 | 2042 | 27 | 2042 | 132 | 2042 | 54 |
| EORLA | 59339 | 6423 | 9799 | 0 | 0 | 1365 | 1365 | 3 | 9799 | 1128 | 786 | 8 | 3 | 31 | 16 | 0 | 786 | 40 | 786 | 25 | 786 | 184 | 786 | 53 |
| P.H.O.L. - Kingston | 21033 | 3514 | 1630 | 2 | 88 | 38 | 128 | 1 | 1629 | 122 | 1392 | 0 | 0 | 0 | 0 | 65 | 1393 | 20 | 1393 | 22 | 1392 | 158 | 1393 | 52 |
| UHN / Mount Sinai Hospital | 63396 | 5148 | 12441 | 4 | 43 | 328 | 375 | 14 | 12441 | 203 | 732 | 0 | 0 | 4 | 0 | 0 | 699 | 1 | 732 | 0 | 732 | 23 | 732 | 36 |
| P.H.O.L. - Toronto | 40560 | 8584 | 15623 | 66 | 2367 | 140 | 1074 | 1 | 15594 | 917 | 13558 | 0 | 0 | 0 | 0 | 571 | 13561 | 194 | 13558 | 159 | 13558 | 1016 | 13558 | 538 |
| Sick Kids Hospital - Toronto | 0 | 0 | 0 | 0 | 0 | 0 | 0 | 0 | 0 | 0 | 0 | 0 | 0 | 0 | 0 | 0 | 0 | 0 | 0 | 0 | 0 | 0 | 0 | 0 |
| Shared Hospital Laboratory | 53030 | 4010 | 53033 | 56 | 1433 | 713 | 2202 | 19 | 53032 | 1865 | 30296 | 4 | 0 | 16 | 0 | 363 | 30309 | 259 | 30435 | 165 | 30383 | 759 | 30277 | 540 |
| P.H.O.L. - Sault Ste. Marie | 1281 | 245 | 359 | 1 | 52 | 14 | 57 | 0 | 359 | 3 | 307 | 0 | 0 | 0 | 0 | 30 | 307 | 0 | 307 | 20 | 307 | 10 | 307 | 5 |
| P.H.O.L. - Timmins | 6575 | 729 | 672 | 0 | 161 | 6 | 156 | 0 | 671 | 49 | 650 | 0 | 0 | 0 | 0 | 40 | 650 | 11 | 650 | 10 | 650 | 47 | 650 | 24 |
| St. Joseph's - London | 85651 | 11311 | 9503 | 0 | 0 | 861 | 861 | 11 | 9503 | 818 | 1127 | 0 | 0 | 0 | 0 | 44 | 1161 | 38 | 1161 | 6 | 1161 | 172 | 749 | 59 |
| P.H.O.L. - London | 25315 | 5477 | 6016 | 8 | 579 | 60 | 630 | 3 | 6015 | 621 | 5149 | 0 | 0 | 0 | 0 | 277 | 5150 | 66 | 5150 | 32 | 5149 | 362 | 5150 | 198 |
| P.H.O.L. - Orillia | 413 | 216 | 1611 | 6 | 260 | 23 | 289 | 0 | 1611 | 205 | 1552 | 0 | 0 | 0 | 0 | 106 | 1552 | 30 | 1552 | 32 | 1552 | 188 | 1552 | 82 |
| P.H.O.L. - Thunder Bay | 6478 | 1390 | 645 | 0 | 106 | 3 | 109 | 0 | 644 | 57 | 566 | 0 | 0 | 0 | 0 | 25 | 566 | 15 | 566 | 6 | 566 | 42 | 566 | 14 |
| P.H.O.L. - Sudbury | 1578 | 243 | 486 | 1 | 65 | 14 | 67 | 0 | 486 | 40 | 397 | 0 | 0 | 0 | 0 | 19 | 397 | 5 | 397 | 11 | 397 | 23 | 397 | 20 |
| P.H.O.L. - Hamilton | 18889 | 4933 | 5148 | 5 | 297 | 90 | 392 | 4 | 5145 | 415 | 3760 | 0 | 0 | 0 | 0 | 159 | 3762 | 42 | 3760 | 38 | 3760 | 303 | 3760 | 155 |
| P.H.O.L. - Peterborough | 3149 | 575 | 766 | 0 | 64 | 9 | 73 | 0 | 766 | 79 | 667 | 0 | 0 | 0 | 0 | 25 | 667 | 7 | 667 | 18 | 667 | 96 | 667 | 26 |
| St. Joseph's - Hamilton | 60980 | 9558 | 24992 | 0 | 0 | 2653 | 2653 | 8 | 24992 | 2026 | 24992 | 0 | 0 | 716 | 0 | 0 | 24992 | 214 | 24992 | 139 | 24992 | 1703 | 0 | 0 |
| Sault Area Hospital | 9374 | 1575 | 6087 | 1 | 259 | 253 | 513 | 0 | 6087 | 55 | 1765 | 33 | 0 | 42 | 2 | 0 | 1765 | 35 | 1765 | 85 | 1765 | 186 | 1765 | 32 |
| Province of Ontario | 477850 | 69247 | 151580 | 155 | 5905 | 6632 | 11137 | 64 | 151543 | 8816 | 89738 | 45 | 3 | 809 | 18 | 1774 | 89759 | 983 | 89913 | 795 | 89859 | 5404 | 64351 | 1888 |
| Manitoba | 45471 | 8593 | 21435 | 16 | 195 | 1729 | 1940 | 0 | 21435 | 1137 | 3409 | 2 | 4 | 125 | 6 | 0 | 3399 | 105 | 3493 | 141 | 3409 | 552 | 3493 | 127 |
| Saskatchewan | 118030 | 10025 | 25524 | 0 | 0 | 3852 | 3852 | 8 | 19294 | 1153 | 8456 | 28 | 37 | 393 | 8 | 0 | 8459 | 193 | 8461 | 453 | 8459 | 736 | 8456 | 323 |
| Alberta | 156410 | 26098 | 74016 | 815 | 7240 | 2638 | 10693 | 19 | 63242 | 5494 | 26014 | 139 | 60 | 526 | 29 | 0 | 26004 | 302 | 25974 | 520 | 25587 | 2323 | 26014 | 816 |
| Prairies | 319911 | 44716 | 120975 | 831 | 7435 | 8219 | 16485 | 27 | 103971 | 7784 | 37879 | 169 | 101 | 1044 | 43 | 0 | 37862 | 600 | 37928 | 1114 | 37455 | 3611 | 37963 | 1266 |
| British Columbia | 167557 | 16448 | 76479 | 314 | 4299 | 290 | 8610 | 42 | 70405 | 5167 | 16236 | 137 | 158 | 580 | 116 | 6 | 16224 | 344 | 16224 | 331 | 15763 | 2402 | 15760 | 596 |
| Yukon | 3792 | 263 | 487 | 0 | 132 | 0 | 140 | 0 | 484 | 12 | N.C. | N.C. | N.C. | N.C. | N.C. | N.C. | N.C. | N.C. | N.C. | N.C. | N.C. | N.C. | N.C. | N.C. |
| Northwest Territories | 939 | 126 | 861 | 2 | 114 | 0 | 116 | 0 | 861 | 33 | N.C. | N.C. | N.C. | N.C. | N.C. | N.C. | N.C. | N.C. | N.C. | N.C. | 861 | 210 | N.C. | N.C. |
| Nunavut | 2932 | 281 | 1502 | 3 | 230 | 3 | 236 | 0 | 1502 | 36 | N.C. | N.C. | N.C. | N.C. | N.C. | N.C. | N.C. | N.C. | N.C. | N.C. | N.C. | N.C. | N.C. | N.C. |
| Territories | 7663 | 670 | 2850 | 5 | 476 | 3 | 492 | 0 | 2847 | 81 | N.C. | N.C. | N.C. | N.C. | N.C. | N.C. | N.C. | N.C. | N.C. | N.C. | 861 | 210 | N.C. | N.C. |
| CANADA | 1782413 | 245767 | 544576 | 1309 | 18628 | 41442 | 63539 | 254 | 469731 | 32613 | 173789 | 558 | 372 | 3070 | 221 | 1780 | 174034 | 3314 | 174084 | 3490 | 154369 | 13018 | 147640 | 4790 |
The data in the RVDSS report represent surveillance data available at the time of writing. Data not collected by reporting lab denoted by N.C.
Some specimens from Yukon (YT) are sent to reference laboratories in British Columbia and reported results reflect specimens identified as originating from YT.
Results from British Columbia comprise of specimens from the following sites: Children's and Women's Hospital Laboratory, Fraser Health Medical Microbiology Laboratory, Island Health, Providence Health Care, Vancouver Coastal Health sites, Victoria General Hospital, BCCDC Public Health Laboratory, Interior Health Authority sites and Northern Health Authority sites.
Due to different testing protocols of laboratories across Canada, influenza A subtype detection counts may not be included in total influenza A detection counts. Total influenza A and B positive counts are used to calculate percentage of tests positive.
Delays in the reporting of data may cause data to change retrospectively. Due to these delays, the sum of weekly report totals do not add up to cumulative totals.
Positive respiratory virus tests historical comparison
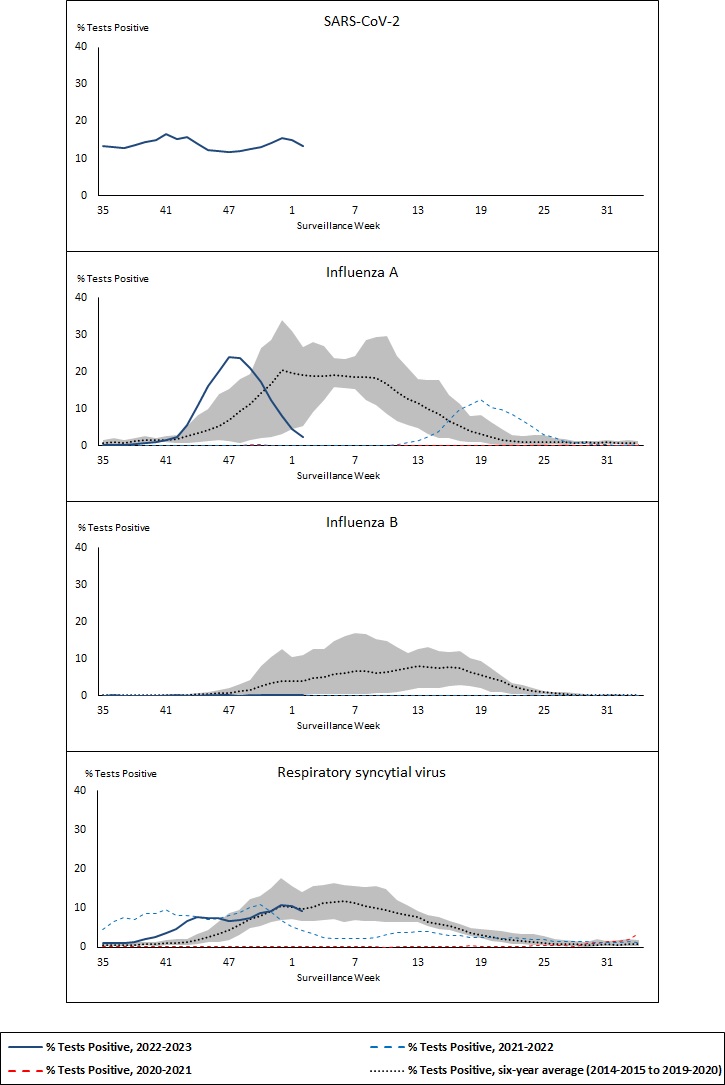
Shaded area represents the maximum and minimum % of respiratory virus tests positive reported by week from seasons 2014-2015 to 2019-2020
Note: Changes to testing practices during the COVID-19 pandemic may cause substantial changes to indicator estimates from previous years. Collection of laboratory testing practice meta-data to understand these changes is ongoing. Interpret trends with caution.
Note: SARS-CoV-2 surveillance was integrated into RVDSS at the beginning of the 2022-2023 season; no appropriate data is available for historical comparison.
Note: Data from week 11 of the 2019-2020 season onwards are excluded from the historical comparison due to the COVID-19 pandemic.
Figure 1: Positive severe acute respiratory syndrome coronavirus 2 (SARS-CoV-2), influenza, and respiratory syncytial virus tests (%) reported by participating laboratories in Canada by surveillance week compared to average and range from 2014-2015 to 2019-2020 season
| Week | Week end | 2022-2023 SARS-CoV-2% | 2022-2023 A% | 2021-2022 A% | 2020-2021 A% | Max A% Base | Min A% Base | Av A% Base | 2022-2023 B% | 2021-2022 B% | 2020-2021 B% | Max B% Base | Min B% Base | Av B% Base | 2022-2023 RSV% | 2021-2022 RSV% | 2020-2021 RSV% | Max RSV% Base | Min RSV% Base | Av RSV% Base |
|---|---|---|---|---|---|---|---|---|---|---|---|---|---|---|---|---|---|---|---|---|
| 35 | 2022-09-03 | 13.40 | 0.17 | 0.04 | 0.00 | 1.60 | 0.11 | 0.68 | 0.02 | 0.00 | 0.02 | 0.28 | 0.00 | 0.13 | 1.15 | 4.43 | 0.02 | 1.34 | 0.38 | 0.60 |
| 36 | 2022-09-10 | 13.06 | 0.14 | 0.01 | 0.00 | 2.11 | 0.23 | 0.98 | 0.04 | 0.00 | 0.00 | 0.55 | 0.00 | 0.15 | 1.13 | 6.61 | 0.04 | 1.09 | 0.22 | 0.57 |
| 37 | 2022-09-17 | 12.73 | 0.24 | 0.03 | 0.00 | 1.59 | 0.36 | 0.87 | 0.01 | 0.00 | 0.00 | 0.19 | 0.04 | 0.12 | 1.05 | 7.59 | 0.02 | 1.37 | 0.31 | 0.64 |
| 38 | 2022-09-24 | 13.59 | 0.49 | 0.00 | 0.02 | 2.15 | 0.43 | 1.16 | 0.02 | 0.00 | 0.00 | 0.21 | 0.00 | 0.14 | 1.41 | 7.16 | 0.10 | 1.24 | 0.37 | 0.64 |
| 39 | 2022-10-01 | 14.43 | 0.68 | 0.01 | 0.00 | 2.65 | 0.57 | 1.53 | 0.03 | 0.00 | 0.00 | 0.29 | 0.09 | 0.18 | 2.11 | 8.48 | 0.05 | 1.29 | 0.41 | 0.68 |
| 40 | 2022-10-08 | 15.04 | 0.99 | 0.00 | 0.00 | 2.17 | 1.01 | 1.58 | 0.03 | 0.02 | 0.00 | 0.20 | 0.05 | 0.11 | 2.45 | 8.53 | 0.07 | 1.39 | 0.34 | 0.67 |
| 41 | 2022-10-15 | 16.56 | 1.44 | 0.03 | 0.01 | 2.66 | 1.05 | 1.57 | 0.01 | 0.03 | 0.00 | 0.36 | 0.03 | 0.16 | 3.54 | 9.54 | 0.10 | 1.74 | 0.58 | 0.98 |
| 42 | 2022-10-22 | 15.36 | 2.40 | 0.03 | 0.00 | 2.96 | 0.77 | 1.92 | 0.05 | 0.02 | 0.00 | 0.45 | 0.05 | 0.25 | 4.58 | 8.18 | 0.07 | 2.11 | 0.63 | 1.14 |
| 43 | 2022-10-29 | 15.75 | 5.57 | 0.03 | 0.01 | 5.23 | 0.68 | 2.60 | 0.03 | 0.02 | 0.00 | 0.55 | 0.06 | 0.23 | 6.63 | 8.11 | 0.07 | 2.16 | 0.55 | 1.32 |
| 44 | 2022-11-05 | 13.88 | 10.90 | 0.10 | 0.04 | 8.42 | 1.08 | 3.39 | 0.03 | 0.10 | 0.03 | 0.71 | 0.12 | 0.31 | 7.71 | 7.82 | 0.05 | 3.35 | 0.83 | 1.92 |
| 45 | 2022-11-12 | 12.38 | 15.98 | 0.07 | 0.02 | 9.83 | 1.18 | 4.19 | 0.04 | 0.06 | 0.02 | 0.97 | 0.22 | 0.44 | 7.65 | 7.03 | 0.04 | 4.43 | 1.29 | 2.59 |
| 46 | 2022-11-19 | 11.92 | 19.81 | 0.10 | 0.03 | 13.95 | 1.42 | 5.47 | 0.05 | 0.06 | 0.01 | 1.49 | 0.09 | 0.58 | 7.61 | 7.18 | 0.06 | 6.33 | 1.38 | 3.29 |
| 47 | 2022-11-26 | 11.74 | 23.74 | 0.13 | 0.03 | 15.24 | 1.25 | 6.91 | 0.04 | 0.07 | 0.04 | 2.13 | 0.13 | 0.80 | 6.71 | 8.10 | 0.03 | 8.69 | 1.79 | 4.46 |
| 48 | 2022-12-03 | 12.11 | 23.64 | 0.19 | 0.04 | 18.07 | 0.76 | 9.40 | 0.03 | 0.15 | 0.01 | 3.18 | 0.08 | 1.20 | 6.99 | 8.92 | 0.02 | 9.47 | 3.11 | 5.72 |
| 49 | 2022-12-10 | 12.59 | 21.48 | 0.23 | 0.03 | 19.52 | 1.43 | 11.41 | 0.06 | 0.05 | 0.01 | 4.21 | 0.19 | 1.60 | 7.28 | 10.09 | 0.06 | 12.26 | 4.87 | 7.12 |
| 50 | 2022-12-17 | 13.10 | 17.20 | 0.23 | 0.01 | 26.42 | 1.97 | 14.27 | 0.07 | 0.02 | 0.01 | 7.95 | 0.15 | 2.55 | 8.71 | 10.78 | 0.07 | 13.19 | 5.39 | 7.93 |
| 51 | 2022-12-24 | 14.16 | 12.48 | 0.18 | 0.00 | 28.53 | 2.27 | 16.81 | 0.05 | 0.02 | 0.01 | 10.44 | 0.19 | 3.30 | 9.27 | 8.97 | 0.07 | 15.23 | 6.52 | 9.27 |
| 52 | 2022-12-31 | 15.62 | 7.97 | 0.09 | 0.00 | 33.97 | 3.30 | 20.41 | 0.07 | 0.01 | 0.00 | 12.73 | 0.23 | 4.07 | 10.69 | 6.72 | 0.01 | 17.80 | 6.83 | 10.39 |
| 1 | 2023-01-07 | 15.09 | 4.58 | 0.08 | 0.00 | 30.93 | 4.58 | 19.55 | 0.07 | 0.00 | 0.00 | 10.34 | 0.22 | 3.86 | 10.42 | 5.26 | 0.04 | 15.62 | 7.12 | 10.17 |
| 2 | 2023-01-14 | 13.41 | 2.26 | 0.11 | 0.00 | 26.80 | 5.46 | 19.10 | 0.06 | 0.01 | 0.00 | 11.01 | 0.29 | 3.91 | 9.19 | 4.32 | 0.07 | 14.05 | 6.60 | 9.63 |
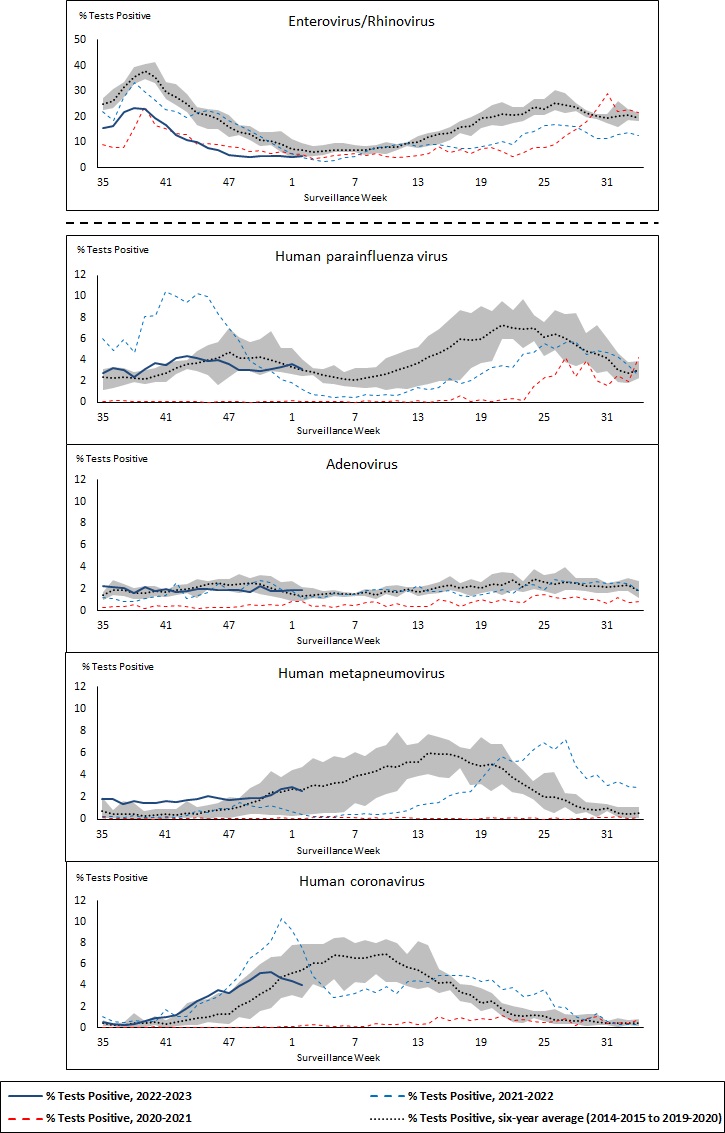
Shaded area represents the maximum and minimum % of respiratory virus tests positive reported by week from seasons 2014-2015 to 2019-2020
Note: Changes to testing practices during the COVID-19 pandemic may cause substantial changes to indicator estimates from previous years. Collection of laboratory testing practice meta-data to understand these changes is ongoing. Interpret trends with caution.
Note: Data from week 11 of the 2019-2020 season onwards are excluded from the historical comparison due to the COVID-19 pandemic.
Note: % Tests Positive scale changes across the dashed line
Figure 2: Positive tests (%) of other respiratory viruses reported by participating laboratories in Canada by surveillance week compared to average and range from 2014-2015 to 2019-2020 season
| Week | Week end | 2022-2023 EV/RV% | 2021-2022 EV/RV% | 2020-2021 EV/RV% | Max EV/RV% Base | Min EV/RV% Base | Av EV/RV% Base | 2022-2023 HPIV% | 2021-2022 HPIV% | 2020-2021 HPIV% | Max HPIV% Base | Min HPIV% Base | Av HPIV% Base | 2022-2023 ADV% | 2021-2022 ADV% | 2020-2021 ADV% | Max ADV% Base | Min ADV% Base | Av ADV% Base | 2022-2023 HMPV% | 2021-2022 HMPV% | 2020-2021 HMPV% | Max HMPV% Base | Min HMPV% Base | Av HMPV% Base | 2022-2023 HCoV% | 2021-2022 HCoV% | 2020-2021 HCoV% | Max HCoV% Base | Min HCoV% Base | Av HCoV% Base |
|---|---|---|---|---|---|---|---|---|---|---|---|---|---|---|---|---|---|---|---|---|---|---|---|---|---|---|---|---|---|---|---|
| 35 | 2022-09-03 | 15.47 | 21.96 | 9.07 | 27.19 | 22.44 | 24.78 | 2.80 | 5.99 | 0.08 | 3.16 | 1.15 | 2.42 | 2.28 | 1.18 | 0.27 | 1.74 | 0.99 | 1.43 | 1.80 | 0.23 | 0.17 | 2.04 | 0.10 | 0.77 | 0.53 | 1.05 | 0.06 | 0.76 | 0.18 | 0.45 |
| 36 | 2022-09-10 | 16.22 | 18.59 | 8.13 | 30.69 | 23.30 | 26.31 | 3.21 | 4.93 | 0.20 | 3.31 | 1.35 | 2.32 | 2.19 | 1.15 | 0.40 | 2.85 | 1.42 | 1.87 | 1.81 | 0.24 | 0.06 | 0.84 | 0.10 | 0.48 | 0.38 | 0.62 | 0.00 | 0.38 | 0.12 | 0.22 |
| 37 | 2022-09-17 | 21.73 | 27.46 | 8.07 | 33.58 | 27.74 | 31.68 | 3.02 | 5.97 | 0.13 | 3.26 | 1.65 | 2.40 | 2.10 | 0.81 | 0.35 | 2.44 | 1.38 | 1.86 | 1.38 | 0.17 | 0.05 | 1.61 | 0.00 | 0.51 | 0.28 | 0.44 | 0.05 | 0.56 | 0.00 | 0.26 |
| 38 | 2022-09-24 | 23.50 | 33.19 | 15.67 | 39.57 | 32.80 | 35.33 | 2.40 | 4.73 | 0.07 | 2.87 | 1.92 | 2.33 | 1.59 | 0.82 | 0.58 | 2.04 | 1.11 | 1.63 | 1.61 | 0.37 | 0.02 | 1.43 | 0.06 | 0.47 | 0.32 | 0.67 | 0.00 | 1.36 | 0.06 | 0.43 |
| 39 | 2022-10-01 | 22.87 | 30.01 | 24.12 | 40.59 | 34.87 | 37.68 | 3.10 | 8.12 | 0.02 | 3.01 | 1.70 | 2.24 | 2.21 | 1.14 | 0.19 | 2.27 | 1.04 | 1.66 | 1.43 | 0.17 | 0.04 | 0.72 | 0.05 | 0.28 | 0.59 | 0.62 | 0.05 | 0.66 | 0.07 | 0.45 |
| 40 | 2022-10-08 | 19.32 | 26.26 | 16.62 | 41.29 | 33.00 | 35.43 | 3.70 | 8.19 | 0.02 | 3.28 | 1.90 | 2.43 | 1.80 | 1.31 | 0.44 | 2.25 | 1.39 | 1.82 | 1.43 | 0.16 | 0.00 | 0.92 | 0.05 | 0.34 | 0.93 | 0.57 | 0.09 | 1.08 | 0.22 | 0.58 |
| 41 | 2022-10-15 | 16.70 | 22.91 | 15.48 | 33.62 | 26.94 | 29.81 | 3.52 | 10.46 | 0.06 | 3.70 | 1.94 | 2.74 | 2.03 | 1.37 | 0.37 | 1.91 | 1.28 | 1.70 | 1.66 | 0.20 | 0.19 | 0.95 | 0.04 | 0.46 | 1.00 | 1.69 | 0.02 | 0.70 | 0.00 | 0.33 |
| 42 | 2022-10-22 | 12.95 | 22.16 | 13.60 | 32.62 | 24.54 | 27.82 | 4.21 | 10.01 | 0.06 | 3.89 | 2.64 | 3.20 | 1.67 | 2.54 | 0.47 | 2.38 | 1.47 | 1.86 | 1.57 | 0.15 | 0.06 | 0.89 | 0.15 | 0.38 | 1.16 | 1.07 | 0.00 | 1.18 | 0.20 | 0.49 |
| 43 | 2022-10-29 | 11.05 | 19.64 | 13.14 | 28.73 | 21.67 | 24.95 | 4.41 | 9.38 | 0.07 | 3.98 | 3.18 | 3.56 | 1.79 | 1.15 | 0.37 | 2.42 | 1.63 | 1.96 | 1.78 | 0.36 | 0.02 | 1.64 | 0.12 | 0.57 | 1.86 | 1.05 | 0.00 | 2.35 | 0.27 | 0.75 |
| 44 | 2022-11-05 | 10.23 | 21.45 | 9.23 | 23.82 | 16.75 | 21.34 | 4.14 | 10.28 | 0.03 | 4.81 | 2.94 | 3.70 | 2.02 | 1.42 | 0.22 | 2.88 | 1.18 | 2.20 | 1.79 | 0.77 | 0.13 | 1.08 | 0.23 | 0.47 | 2.54 | 2.21 | 0.00 | 2.59 | 0.21 | 0.88 |
| 45 | 2022-11-12 | 7.77 | 22.39 | 9.70 | 23.08 | 15.17 | 20.56 | 3.90 | 9.97 | 0.01 | 5.42 | 2.53 | 4.01 | 1.99 | 1.63 | 0.33 | 2.68 | 2.02 | 2.42 | 2.06 | 0.64 | 0.01 | 1.30 | 0.04 | 0.77 | 3.00 | 2.57 | 0.03 | 2.74 | 0.52 | 0.96 |
| 46 | 2022-11-19 | 6.94 | 21.37 | 9.02 | 22.77 | 15.28 | 19.27 | 3.97 | 8.29 | 0.04 | 5.72 | 1.62 | 4.19 | 1.87 | 2.51 | 0.30 | 2.90 | 1.99 | 2.53 | 1.89 | 0.99 | 0.04 | 1.43 | 0.18 | 0.79 | 3.54 | 2.99 | 0.03 | 3.32 | 0.46 | 1.25 |
| 47 | 2022-11-26 | 4.88 | 18.54 | 8.44 | 20.84 | 12.15 | 16.09 | 3.64 | 7.04 | 0.06 | 7.00 | 2.36 | 4.72 | 1.89 | 1.94 | 0.32 | 2.95 | 1.83 | 2.35 | 1.78 | 1.01 | 0.02 | 2.02 | 0.09 | 0.89 | 3.24 | 3.90 | 0.04 | 3.26 | 0.37 | 1.25 |
| 48 | 2022-12-03 | 4.75 | 16.64 | 7.94 | 16.72 | 12.69 | 13.83 | 3.05 | 5.78 | 0.02 | 6.14 | 3.03 | 4.18 | 1.88 | 1.89 | 0.35 | 3.34 | 1.66 | 2.48 | 1.86 | 1.48 | 0.02 | 1.94 | 0.31 | 1.08 | 3.95 | 4.94 | 0.02 | 4.30 | 1.00 | 2.04 |
| 49 | 2022-12-10 | 4.14 | 14.57 | 6.21 | 16.32 | 10.72 | 13.07 | 3.07 | 3.97 | 0.00 | 5.65 | 2.94 | 4.19 | 1.70 | 2.48 | 0.54 | 3.03 | 1.84 | 2.49 | 1.91 | 1.22 | 0.05 | 2.80 | 0.49 | 1.46 | 4.46 | 6.58 | 0.05 | 5.19 | 0.84 | 2.52 |
| 50 | 2022-12-17 | 4.58 | 12.40 | 6.62 | 13.85 | 8.43 | 10.90 | 2.98 | 3.23 | 0.06 | 5.95 | 2.54 | 4.27 | 2.29 | 2.72 | 0.51 | 3.27 | 1.49 | 2.45 | 1.92 | 1.08 | 0.02 | 3.32 | 0.46 | 1.70 | 5.13 | 7.26 | 0.11 | 6.04 | 1.54 | 3.16 |
| 51 | 2022-12-24 | 4.49 | 9.95 | 5.65 | 14.18 | 8.81 | 10.48 | 3.09 | 3.01 | 0.04 | 6.71 | 2.94 | 3.95 | 1.76 | 2.54 | 0.58 | 3.20 | 1.36 | 2.04 | 2.23 | 1.20 | 0.04 | 4.39 | 0.37 | 2.44 | 5.28 | 8.11 | 0.05 | 6.68 | 1.87 | 3.72 |
| 52 | 2022-12-31 | 4.48 | 7.71 | 6.53 | 14.41 | 6.24 | 9.23 | 3.32 | 2.13 | 0.03 | 5.08 | 2.87 | 3.75 | 1.80 | 1.92 | 0.48 | 2.59 | 1.20 | 1.76 | 2.75 | 1.00 | 0.11 | 3.81 | 0.41 | 2.44 | 4.73 | 10.33 | 0.07 | 6.73 | 2.78 | 4.75 |
| 1 | 2023-01-07 | 4.18 | 5.71 | 5.43 | 11.09 | 4.36 | 7.42 | 3.63 | 1.84 | 0.12 | 5.08 | 2.68 | 3.34 | 1.88 | 1.84 | 0.81 | 2.67 | 0.85 | 1.54 | 2.94 | 0.72 | 0.06 | 4.45 | 0.28 | 2.70 | 4.40 | 9.27 | 0.12 | 7.77 | 3.07 | 5.16 |
| 2 | 2023-01-14 | 4.59 | 3.98 | 5.18 | 9.55 | 4.31 | 6.79 | 3.17 | 1.19 | 0.08 | 4.12 | 2.46 | 3.05 | 1.87 | 1.13 | 0.82 | 2.15 | 0.87 | 1.37 | 2.53 | 0.38 | 0.03 | 4.76 | 0.42 | 2.66 | 4.06 | 7.46 | 0.16 | 7.89 | 2.84 | 5.44 |
Positive severe acute respiratory syndrome coronavirus 2 (SARS-CoV-2) tests
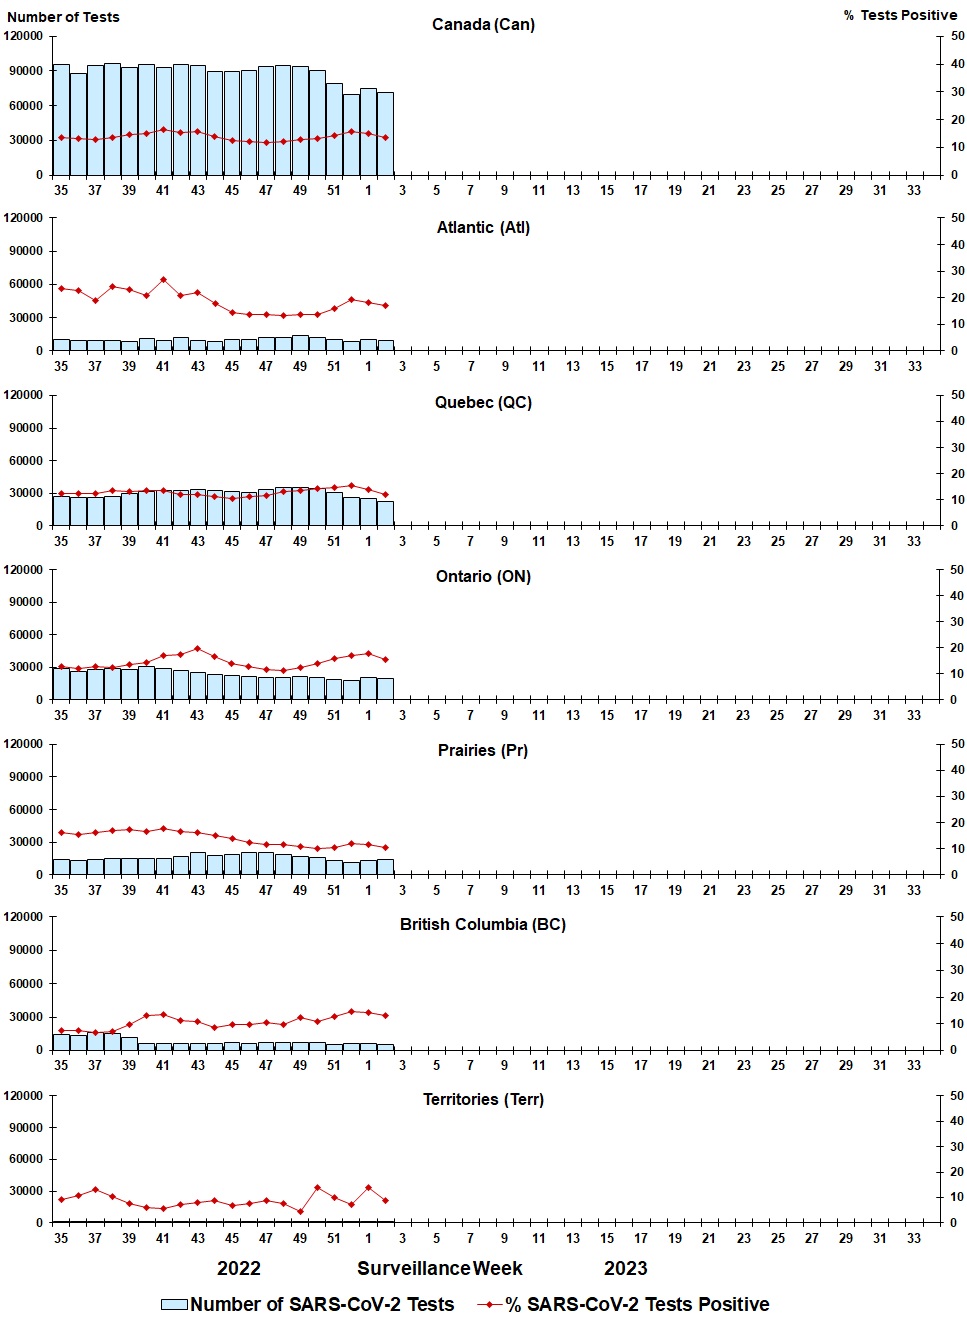
Note: Differences in positivity between jurisdictions can reflect differences in testing practices. Please interpret with caution.
Figure 3: Positive severe acute respiratory syndrome coronavirus 2 (SARS-CoV-2) tests (%) in Canada by region by surveillance week
| Week | Week end | Can Tests | SARS-CoV-2% | Atl Tests | SARS-CoV-2% | QC Tests | SARS-CoV-2% | ON Tests | SARS-CoV-2% | Pr Tests | SARS-CoV-2% | BC Tests | SARS-CoV-2% | Terr Tests | SARS-CoV-2% |
|---|---|---|---|---|---|---|---|---|---|---|---|---|---|---|---|
| 35 | 2022-09-03 | 95303 | 13.40 | 10317 | 23.39 | 26519 | 12.26 | 28978 | 12.71 | 14405 | 16.06 | 14523 | 7.27 | 561 | 9.27 |
| 36 | 2022-09-10 | 87999 | 13.06 | 9220 | 22.81 | 25637 | 12.40 | 25742 | 12.04 | 13362 | 15.37 | 13642 | 7.44 | 396 | 10.86 |
| 37 | 2022-09-17 | 94358 | 12.73 | 9788 | 18.93 | 26091 | 12.17 | 28069 | 12.72 | 14236 | 16.17 | 15727 | 6.70 | 447 | 13.20 |
| 38 | 2022-09-24 | 96263 | 13.59 | 9345 | 24.14 | 26931 | 13.36 | 28977 | 12.35 | 15018 | 16.73 | 15532 | 6.99 | 460 | 10.43 |
| 39 | 2022-10-01 | 92662 | 14.43 | 8311 | 23.17 | 29662 | 13.22 | 27909 | 13.57 | 14871 | 17.48 | 11511 | 9.65 | 398 | 7.79 |
| 40 | 2022-10-08 | 95437 | 15.04 | 11290 | 20.91 | 31745 | 13.44 | 30640 | 14.46 | 14741 | 16.41 | 6525 | 13.01 | 496 | 6.05 |
| 41 | 2022-10-15 | 93065 | 16.56 | 9618 | 27.02 | 32473 | 13.37 | 28633 | 17.02 | 15414 | 17.56 | 6458 | 13.35 | 469 | 5.76 |
| 42 | 2022-10-22 | 95235 | 15.36 | 11962 | 20.72 | 32792 | 12.10 | 26742 | 17.29 | 16859 | 16.63 | 6521 | 11.13 | 359 | 7.24 |
| 43 | 2022-10-29 | 94724 | 15.75 | 9563 | 21.97 | 33446 | 11.75 | 25142 | 19.65 | 20163 | 16.20 | 5991 | 10.82 | 419 | 8.11 |
| 44 | 2022-11-05 | 89743 | 13.88 | 8906 | 17.97 | 32692 | 11.30 | 23508 | 16.57 | 17671 | 15.09 | 6497 | 8.56 | 469 | 8.74 |
| 45 | 2022-11-12 | 89589 | 12.38 | 10513 | 14.36 | 31704 | 10.58 | 22024 | 13.83 | 18318 | 13.66 | 6651 | 9.76 | 379 | 6.86 |
| 46 | 2022-11-19 | 90434 | 11.92 | 10650 | 13.65 | 30751 | 11.13 | 21425 | 12.63 | 20613 | 12.23 | 6640 | 9.79 | 355 | 7.61 |
| 47 | 2022-11-26 | 93854 | 11.74 | 11661 | 13.65 | 33538 | 11.43 | 20744 | 11.77 | 20318 | 11.63 | 7236 | 10.50 | 357 | 8.68 |
| 48 | 2022-12-03 | 94394 | 12.11 | 12354 | 13.22 | 35546 | 12.94 | 20852 | 11.38 | 18471 | 11.52 | 6818 | 9.78 | 353 | 7.65 |
| 49 | 2022-12-10 | 93704 | 12.59 | 13445 | 13.82 | 34896 | 13.36 | 21214 | 12.29 | 16549 | 10.67 | 7196 | 12.26 | 404 | 4.46 |
| 50 | 2022-12-17 | 89983 | 13.10 | 11781 | 13.87 | 34271 | 14.24 | 20346 | 13.88 | 16279 | 10.13 | 6965 | 10.73 | 341 | 14.08 |
| 51 | 2022-12-24 | 78839 | 14.16 | 10225 | 15.87 | 30937 | 14.58 | 18610 | 15.78 | 13249 | 10.30 | 5579 | 12.56 | 239 | 10.04 |
| 52 | 2022-12-31 | 69864 | 15.62 | 8458 | 19.43 | 25554 | 15.29 | 18079 | 17.14 | 11699 | 11.99 | 5877 | 14.45 | 197 | 7.11 |
| 1 | 2023-01-07 | 75143 | 15.09 | 9934 | 18.10 | 24747 | 13.67 | 20785 | 17.96 | 13420 | 11.46 | 5974 | 14.16 | 283 | 13.78 |
| 2 | 2023-01-14 | 71421 | 13.41 | 9630 | 17.07 | 22535 | 12.09 | 19452 | 15.40 | 13831 | 10.48 | 5692 | 12.93 | 281 | 8.90 |
Positive influenza (Flu) tests
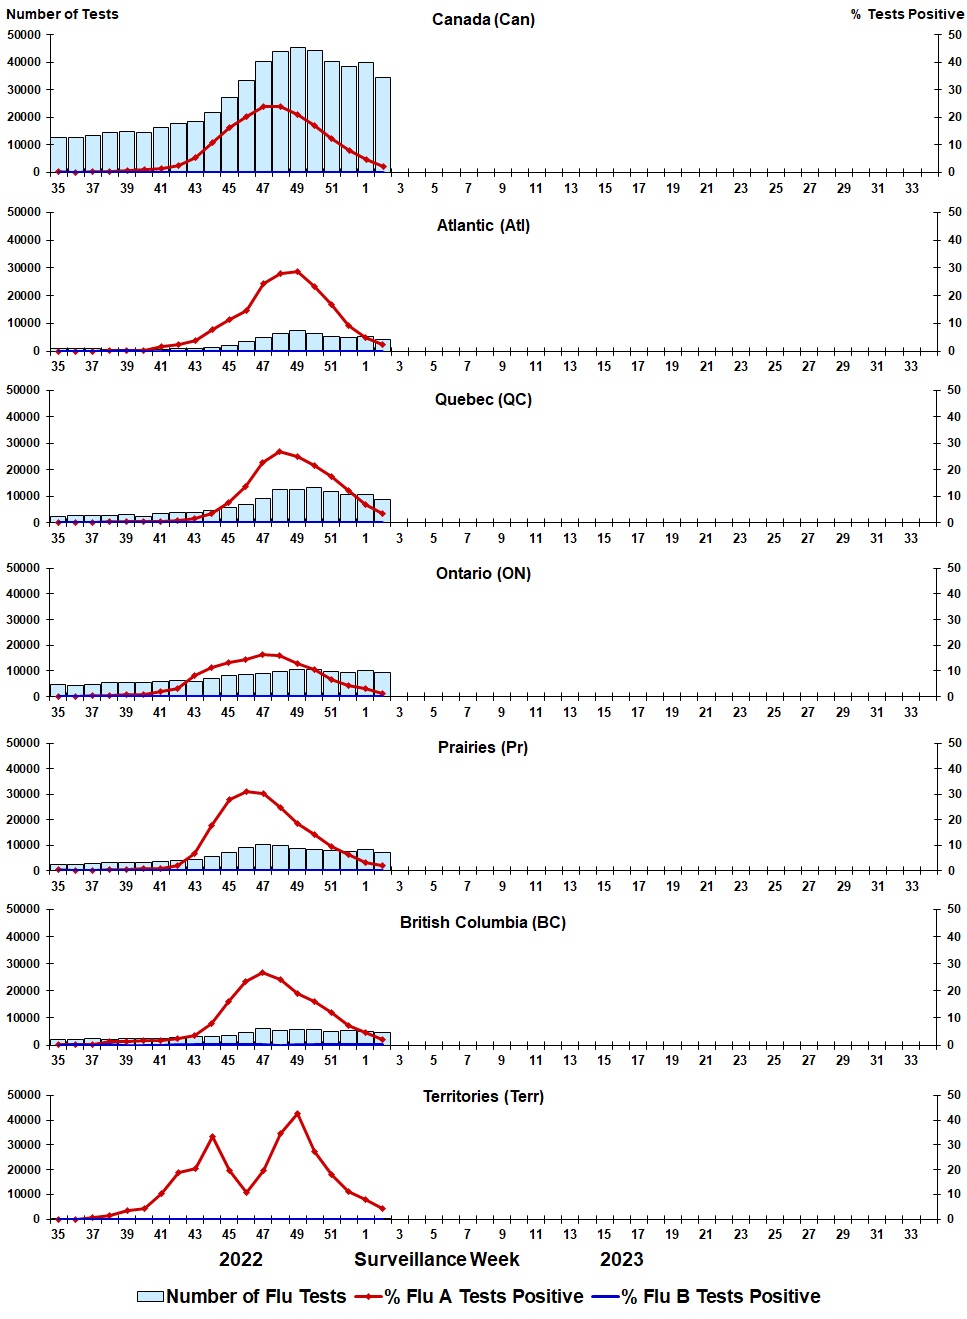
Figure 4: Positive influenza (Flu) tests (%) in Canada by region by surveillance week
| Week | Week end | Can Tests | Can A% | Can B% | Atl Tests | Atl A% | Atl B% | QC Tests | QC A% | QC B% | ON Tests | ON A% | ON B% | Pr Tests | Pr A% | Pr B% | BC Tests | BC A% | BC B% | Terr Tests | Terr A% | Terr B% |
|---|---|---|---|---|---|---|---|---|---|---|---|---|---|---|---|---|---|---|---|---|---|---|
| 35 | 2022-09-03 | 12693 | 0.17 | 0.02 | 932 | 0.11 | 0.11 | 2404 | 0.17 | 0.04 | 4663 | 0.11 | 0.00 | 2573 | 0.31 | 0.04 | 2006 | 0.20 | 0.00 | 115 | 0.00 | 0.00 |
| 36 | 2022-09-10 | 12544 | 0.14 | 0.04 | 906 | 0.00 | 0.00 | 2520 | 0.12 | 0.00 | 4411 | 0.16 | 0.02 | 2566 | 0.16 | 0.08 | 2055 | 0.19 | 0.10 | 86 | 0.00 | 0.00 |
| 37 | 2022-09-17 | 13440 | 0.24 | 0.01 | 854 | 0.12 | 0.00 | 2618 | 0.19 | 0.04 | 4801 | 0.31 | 0.02 | 2798 | 0.18 | 0.00 | 2247 | 0.22 | 0.00 | 122 | 0.82 | 0.00 |
| 38 | 2022-09-24 | 14421 | 0.49 | 0.02 | 788 | 0.13 | 0.00 | 2714 | 0.22 | 0.04 | 5515 | 0.38 | 0.00 | 3044 | 0.43 | 0.03 | 2226 | 1.21 | 0.04 | 134 | 1.49 | 0.00 |
| 39 | 2022-10-01 | 14841 | 0.68 | 0.03 | 688 | 0.29 | 0.15 | 2873 | 0.21 | 0.10 | 5624 | 0.66 | 0.02 | 3132 | 0.64 | 0.00 | 2411 | 1.33 | 0.00 | 113 | 3.54 | 0.00 |
| 40 | 2022-10-08 | 14485 | 0.99 | 0.03 | 818 | 0.24 | 0.00 | 2339 | 0.21 | 0.00 | 5676 | 1.02 | 0.05 | 3081 | 0.88 | 0.03 | 2430 | 1.85 | 0.00 | 141 | 4.26 | 0.00 |
| 41 | 2022-10-15 | 16215 | 1.44 | 0.01 | 776 | 1.68 | 0.00 | 3275 | 0.49 | 0.00 | 5761 | 1.89 | 0.00 | 3737 | 0.96 | 0.03 | 2540 | 1.85 | 0.00 | 126 | 10.32 | 0.00 |
| 42 | 2022-10-22 | 17731 | 2.40 | 0.05 | 1001 | 2.60 | 0.00 | 3608 | 0.86 | 0.03 | 6230 | 3.10 | 0.08 | 4006 | 2.15 | 0.02 | 2774 | 2.45 | 0.07 | 112 | 18.75 | 0.00 |
| 43 | 2022-10-29 | 18445 | 5.57 | 0.03 | 969 | 3.72 | 0.00 | 3821 | 1.41 | 0.08 | 6013 | 8.13 | 0.02 | 4456 | 7.05 | 0.00 | 3026 | 3.34 | 0.07 | 160 | 20.63 | 0.00 |
| 44 | 2022-11-05 | 21494 | 10.90 | 0.03 | 1209 | 8.02 | 0.00 | 4458 | 3.45 | 0.02 | 7006 | 11.28 | 0.04 | 5540 | 17.94 | 0.02 | 3111 | 8.07 | 0.06 | 170 | 33.53 | 0.00 |
| 45 | 2022-11-12 | 26572 | 15.98 | 0.04 | 2145 | 11.38 | 0.05 | 5731 | 7.47 | 0.07 | 8254 | 13.28 | 0.04 | 6772 | 27.82 | 0.03 | 3507 | 16.03 | 0.03 | 163 | 19.63 | 0.00 |
| 46 | 2022-11-19 | 32808 | 19.81 | 0.05 | 3433 | 14.54 | 0.00 | 6914 | 13.65 | 0.04 | 8727 | 14.32 | 0.07 | 8818 | 30.32 | 0.06 | 4741 | 23.52 | 0.04 | 175 | 10.29 | 0.00 |
| 47 | 2022-11-26 | 39766 | 23.74 | 0.04 | 5140 | 24.20 | 0.00 | 9252 | 22.84 | 0.06 | 9193 | 16.41 | 0.03 | 9734 | 29.45 | 0.01 | 6279 | 26.74 | 0.10 | 168 | 17.86 | 0.00 |
| 48 | 2022-12-03 | 43395 | 23.64 | 0.03 | 6393 | 27.94 | 0.02 | 12431 | 26.91 | 0.06 | 9930 | 16.05 | 0.02 | 9117 | 23.97 | 0.03 | 5334 | 24.07 | 0.00 | 190 | 33.16 | 0.00 |
| 49 | 2022-12-10 | 43589 | 21.48 | 0.06 | 7404 | 28.55 | 0.00 | 12591 | 25.07 | 0.14 | 10580 | 13.16 | 0.06 | 7441 | 20.51 | 0.03 | 5326 | 20.32 | 0.04 | 247 | 38.06 | 0.00 |
| 50 | 2022-12-17 | 44347 | 17.20 | 0.07 | 6554 | 23.25 | 0.00 | 13081 | 21.57 | 0.15 | 10525 | 10.56 | 0.02 | 8255 | 14.40 | 0.01 | 5731 | 16.18 | 0.10 | 201 | 27.36 | 0.00 |
| 51 | 2022-12-24 | 40138 | 12.48 | 0.05 | 5487 | 16.93 | 0.00 | 11742 | 17.27 | 0.09 | 9666 | 6.57 | 0.03 | 8000 | 9.65 | 0.01 | 5122 | 12.16 | 0.10 | 121 | 18.18 | 0.00 |
| 52 | 2022-12-31 | 38286 | 7.97 | 0.07 | 4924 | 9.36 | 0.00 | 10677 | 12.04 | 0.14 | 9370 | 4.30 | 0.09 | 7758 | 6.38 | 0.04 | 5477 | 7.23 | 0.04 | 80 | 11.25 | 0.00 |
| 1 | 2023-01-07 | 39781 | 4.58 | 0.07 | 5460 | 4.93 | 0.00 | 10624 | 6.92 | 0.14 | 10122 | 3.03 | 0.08 | 8309 | 3.23 | 0.00 | 5152 | 4.54 | 0.12 | 114 | 7.89 | 0.00 |
| 2 | 2023-01-14 | 34515 | 2.26 | 0.06 | 4291 | 2.47 | 0.02 | 8822 | 3.47 | 0.09 | 9533 | 1.31 | 0.08 | 7266 | 1.90 | 0.01 | 4491 | 2.20 | 0.02 | 112 | 4.46 | 0.00 |
Positive respiratory syncytial virus (RSV) tests
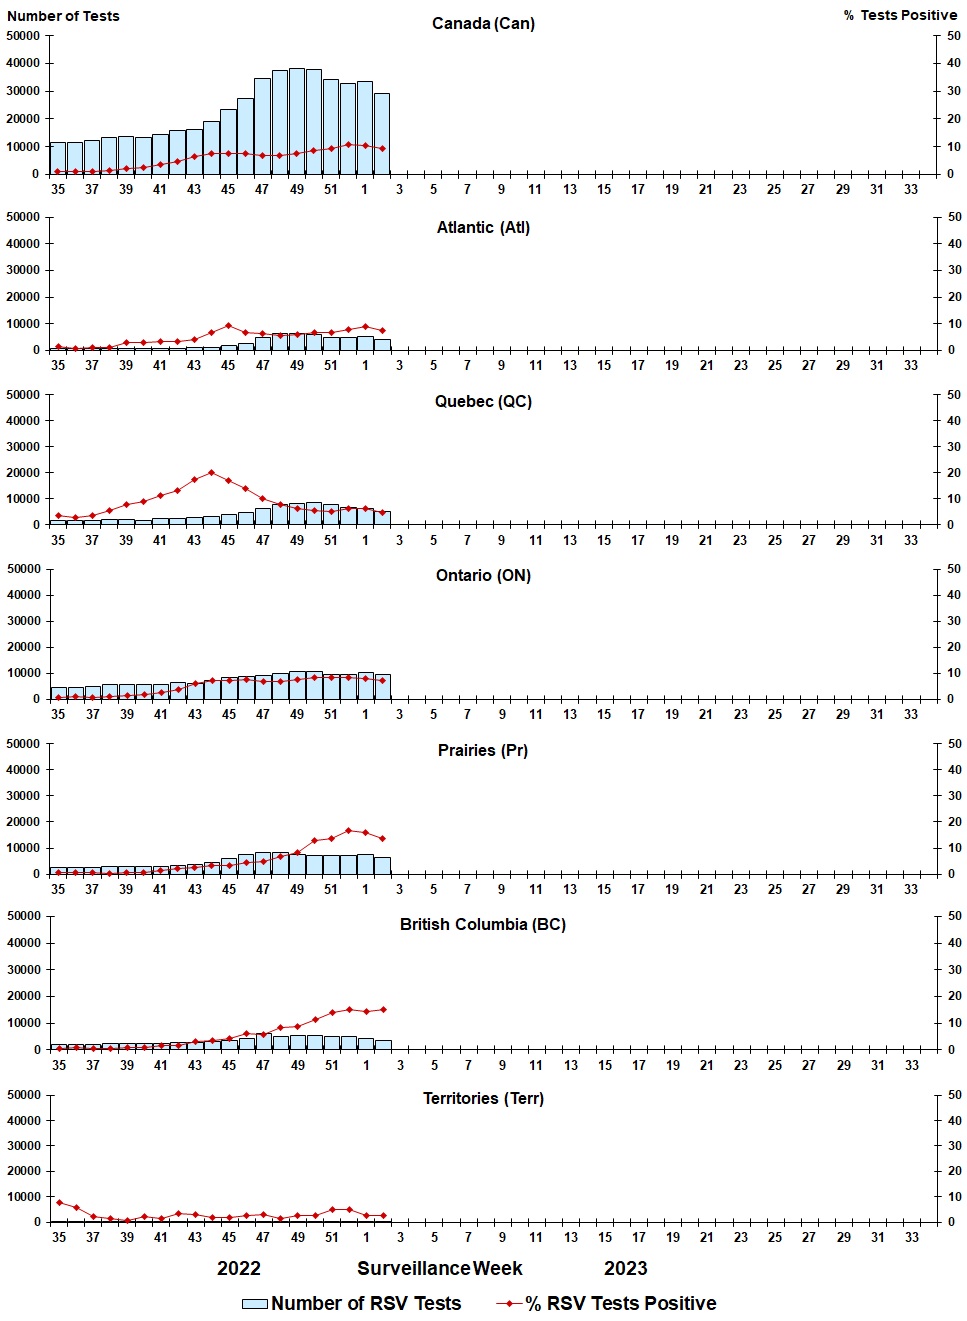
Figure 5: Positive respiratory syncytial virus (RSV) tests (%) in Canada by region by surveillance week
| Week | Week end | Can Tests | RSV% | Atl Tests | RSV% | QC Tests | RSV% | ON Tests | RSV% | Pr Tests | RSV% | BC Tests | RSV% | Terr Tests | RSV% |
|---|---|---|---|---|---|---|---|---|---|---|---|---|---|---|---|
| 35 | 2022-09-03 | 11509 | 1.15 | 832 | 1.44 | 1737 | 3.51 | 4663 | 0.54 | 2367 | 0.68 | 1795 | 0.50 | 115 | 7.83 |
| 36 | 2022-09-10 | 11349 | 1.13 | 785 | 0.64 | 1737 | 2.71 | 4411 | 1.00 | 2415 | 0.54 | 1915 | 0.73 | 86 | 5.81 |
| 37 | 2022-09-17 | 12232 | 1.05 | 721 | 0.97 | 1851 | 3.51 | 4801 | 0.60 | 2610 | 0.61 | 2127 | 0.38 | 122 | 2.46 |
| 38 | 2022-09-24 | 13235 | 1.41 | 707 | 1.13 | 1908 | 5.56 | 5515 | 0.98 | 2821 | 0.35 | 2150 | 0.33 | 134 | 1.49 |
| 39 | 2022-10-01 | 13527 | 2.11 | 556 | 3.06 | 2029 | 7.69 | 5623 | 1.35 | 2894 | 0.73 | 2312 | 0.65 | 113 | 0.88 |
| 40 | 2022-10-08 | 13246 | 2.45 | 677 | 2.95 | 1727 | 8.92 | 5675 | 1.92 | 2707 | 0.63 | 2319 | 0.95 | 141 | 2.13 |
| 41 | 2022-10-15 | 14245 | 3.54 | 695 | 3.45 | 2330 | 11.12 | 5761 | 2.46 | 3049 | 1.38 | 2284 | 1.53 | 126 | 1.59 |
| 42 | 2022-10-22 | 15688 | 4.58 | 799 | 3.38 | 2644 | 13.09 | 6230 | 3.60 | 3352 | 2.21 | 2551 | 1.72 | 112 | 3.57 |
| 43 | 2022-10-29 | 16163 | 6.63 | 929 | 4.20 | 2751 | 17.52 | 6010 | 6.09 | 3634 | 2.67 | 2680 | 3.10 | 159 | 3.14 |
| 44 | 2022-11-05 | 18740 | 7.71 | 964 | 6.64 | 3126 | 20.15 | 7006 | 7.09 | 4483 | 3.37 | 2993 | 3.31 | 168 | 1.79 |
| 45 | 2022-11-12 | 23114 | 7.65 | 1867 | 9.16 | 3986 | 16.88 | 8242 | 7.01 | 5466 | 3.64 | 3390 | 4.25 | 163 | 1.84 |
| 46 | 2022-11-19 | 26999 | 7.61 | 2538 | 6.82 | 4620 | 14.11 | 8721 | 7.41 | 6904 | 4.88 | 4041 | 5.99 | 175 | 2.86 |
| 47 | 2022-11-26 | 34079 | 6.71 | 4680 | 6.24 | 6170 | 9.98 | 9192 | 6.80 | 7726 | 5.14 | 6143 | 5.73 | 168 | 2.98 |
| 48 | 2022-12-03 | 36841 | 6.99 | 6110 | 5.35 | 8002 | 7.91 | 9926 | 6.85 | 7522 | 6.90 | 5091 | 8.15 | 190 | 1.58 |
| 49 | 2022-12-10 | 36861 | 7.28 | 6227 | 5.77 | 8179 | 6.32 | 10579 | 7.61 | 6303 | 8.52 | 5326 | 8.60 | 247 | 2.83 |
| 50 | 2022-12-17 | 37736 | 8.71 | 5921 | 6.67 | 8545 | 5.36 | 10522 | 8.33 | 7131 | 13.06 | 5416 | 11.48 | 201 | 2.49 |
| 51 | 2022-12-24 | 34257 | 9.27 | 4905 | 6.81 | 7661 | 5.33 | 9664 | 8.14 | 7106 | 13.68 | 4800 | 13.96 | 121 | 4.96 |
| 52 | 2022-12-31 | 32886 | 10.69 | 4669 | 7.90 | 6616 | 6.48 | 9370 | 8.19 | 7032 | 16.74 | 5119 | 15.06 | 80 | 5.00 |
| 1 | 2023-01-07 | 33359 | 10.42 | 5144 | 8.98 | 6300 | 6.48 | 10120 | 7.99 | 7534 | 15.97 | 4147 | 14.23 | 114 | 2.63 |
| 2 | 2023-01-14 | 29079 | 9.19 | 4078 | 7.41 | 5215 | 4.83 | 9533 | 7.09 | 6501 | 13.77 | 3640 | 14.92 | 112 | 2.68 |
Positive human parainfluenza virus (HPIV) tests
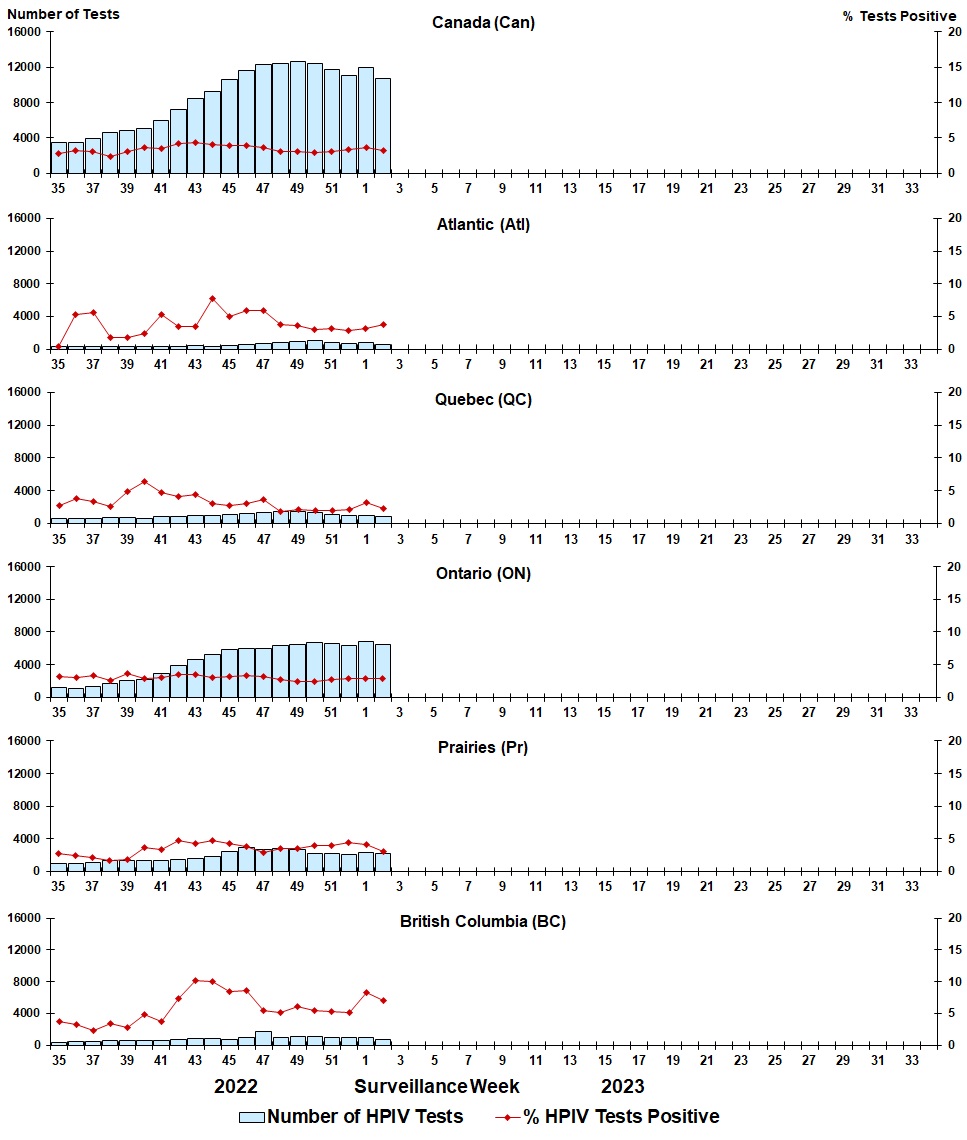
Figure 6: Positive human parainfluenza virus (HPIV) tests (%) in Canada by region by surveillance week
| Week | Week End | Can Tests | HPIV% | Atl Tests | HPIV% | QC Tests | HPIV% | ON Tests | HPIV% | Pr Tests | HPIV% | BC Tests | HPIV% |
|---|---|---|---|---|---|---|---|---|---|---|---|---|---|
| 35 | 2022-09-03 | 3433 | 2.80 | 294 | 0.34 | 619 | 2.75 | 1151 | 3.21 | 967 | 2.69 | 402 | 3.73 |
| 36 | 2022-09-10 | 3454 | 3.21 | 280 | 5.36 | 646 | 3.87 | 1081 | 2.96 | 1025 | 2.44 | 422 | 3.32 |
| 37 | 2022-09-17 | 3973 | 3.02 | 301 | 5.65 | 661 | 3.33 | 1368 | 3.36 | 1112 | 2.07 | 530 | 2.26 |
| 38 | 2022-09-24 | 4589 | 2.40 | 334 | 1.80 | 717 | 2.65 | 1717 | 2.56 | 1274 | 1.73 | 547 | 3.47 |
| 39 | 2022-10-01 | 4878 | 3.10 | 286 | 1.75 | 728 | 4.81 | 1999 | 3.60 | 1327 | 1.81 | 538 | 2.79 |
| 40 | 2022-10-08 | 5057 | 3.70 | 298 | 2.35 | 578 | 6.40 | 2228 | 2.92 | 1386 | 3.68 | 567 | 4.76 |
| 41 | 2022-10-15 | 5998 | 3.52 | 265 | 5.28 | 851 | 4.70 | 2960 | 3.04 | 1323 | 3.40 | 599 | 3.67 |
| 42 | 2022-10-22 | 7244 | 4.21 | 354 | 3.39 | 904 | 4.09 | 3859 | 3.55 | 1420 | 4.72 | 707 | 7.36 |
| 43 | 2022-10-29 | 8428 | 4.41 | 441 | 3.40 | 944 | 4.45 | 4632 | 3.52 | 1571 | 4.20 | 839 | 10.25 |
| 44 | 2022-11-05 | 9258 | 4.14 | 362 | 7.73 | 974 | 2.98 | 5243 | 2.96 | 1857 | 4.79 | 822 | 9.98 |
| 45 | 2022-11-12 | 10628 | 3.90 | 458 | 5.02 | 1103 | 2.81 | 5832 | 3.24 | 2451 | 4.28 | 783 | 8.43 |
| 46 | 2022-11-19 | 11672 | 3.97 | 575 | 5.91 | 1243 | 3.06 | 5943 | 3.30 | 2973 | 3.87 | 937 | 8.54 |
| 47 | 2022-11-26 | 12288 | 3.64 | 677 | 5.91 | 1319 | 3.64 | 5937 | 3.17 | 2644 | 2.91 | 1710 | 5.50 |
| 48 | 2022-12-03 | 12348 | 3.05 | 808 | 3.71 | 1437 | 1.88 | 6343 | 2.70 | 2804 | 3.50 | 956 | 5.23 |
| 49 | 2022-12-10 | 12271 | 3.07 | 962 | 3.64 | 1406 | 1.99 | 6469 | 2.43 | 2439 | 3.81 | 995 | 6.43 |
| 50 | 2022-12-17 | 12356 | 2.98 | 988 | 2.94 | 1350 | 1.93 | 6718 | 2.44 | 2231 | 4.03 | 1069 | 5.52 |
| 51 | 2022-12-24 | 11701 | 3.09 | 783 | 3.19 | 1147 | 2.01 | 6638 | 2.65 | 2147 | 3.91 | 986 | 5.38 |
| 52 | 2022-12-31 | 11030 | 3.32 | 638 | 2.82 | 1016 | 2.17 | 6308 | 2.92 | 2063 | 4.36 | 1005 | 5.17 |
| 1 | 2023-01-07 | 11996 | 3.63 | 802 | 3.12 | 1017 | 3.24 | 6864 | 2.93 | 2349 | 4.09 | 964 | 8.30 |
| 2 | 2023-01-14 | 10759 | 3.17 | 526 | 3.80 | 810 | 2.22 | 6446 | 2.82 | 2231 | 3.09 | 746 | 6.97 |
Positive adenovirus (ADV) tests
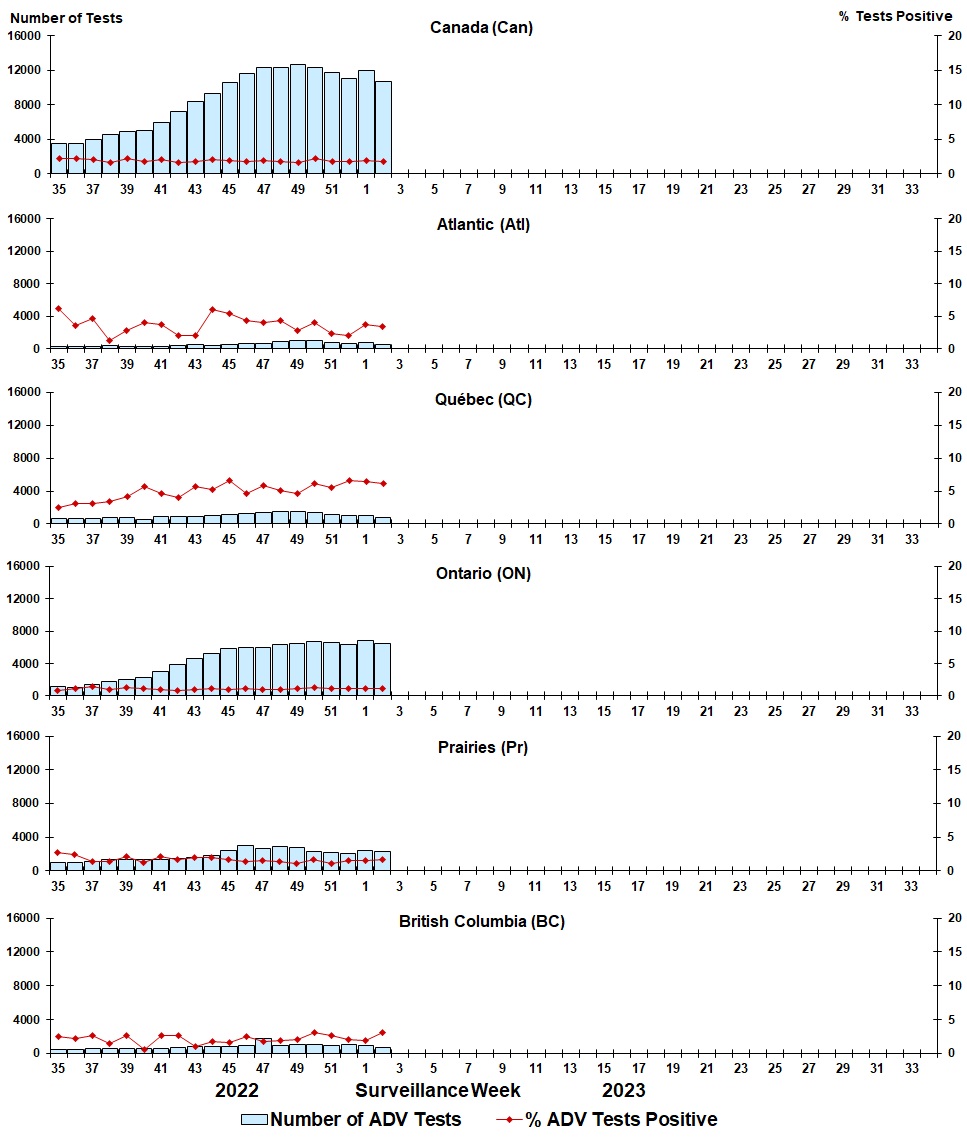
Figure 7: Positive adenovirus (ADV) tests (%) in Canada by region by surveillance week
| Week | Week End | Can Tests | ADV% | Atl Tests | ADV% | QC Tests | ADV% | ON Tests | ADV% | Pr Tests | ADV% | BC Tests | ADV% |
|---|---|---|---|---|---|---|---|---|---|---|---|---|---|
| 35 | 2022-09-03 | 3472 | 2.28 | 294 | 6.12 | 632 | 2.53 | 1179 | 0.76 | 965 | 2.69 | 402 | 2.49 |
| 36 | 2022-09-10 | 3478 | 2.19 | 280 | 3.57 | 659 | 3.03 | 1089 | 1.10 | 1028 | 2.43 | 422 | 2.13 |
| 37 | 2022-09-17 | 3991 | 2.10 | 301 | 4.65 | 679 | 3.09 | 1369 | 1.46 | 1111 | 1.35 | 530 | 2.64 |
| 38 | 2022-09-24 | 4604 | 1.59 | 334 | 1.20 | 731 | 3.42 | 1717 | 1.05 | 1275 | 1.41 | 547 | 1.46 |
| 39 | 2022-10-01 | 4894 | 2.21 | 286 | 2.80 | 742 | 4.18 | 2001 | 1.35 | 1327 | 2.11 | 538 | 2.60 |
| 40 | 2022-10-08 | 5068 | 1.80 | 298 | 4.03 | 583 | 5.66 | 2234 | 1.16 | 1386 | 1.23 | 567 | 0.53 |
| 41 | 2022-10-15 | 6013 | 2.03 | 265 | 3.77 | 864 | 4.63 | 2962 | 0.95 | 1323 | 2.12 | 599 | 2.67 |
| 42 | 2022-10-22 | 7255 | 1.67 | 354 | 1.98 | 915 | 4.04 | 3859 | 0.88 | 1420 | 1.69 | 707 | 2.69 |
| 43 | 2022-10-29 | 8440 | 1.79 | 441 | 2.04 | 955 | 5.76 | 4633 | 1.01 | 1571 | 1.97 | 839 | 1.07 |
| 44 | 2022-11-05 | 9271 | 2.02 | 362 | 6.08 | 987 | 5.27 | 5243 | 1.16 | 1857 | 1.99 | 822 | 1.82 |
| 45 | 2022-11-12 | 10610 | 1.99 | 458 | 5.46 | 1117 | 6.62 | 5800 | 1.03 | 2451 | 1.59 | 783 | 1.66 |
| 46 | 2022-11-19 | 11696 | 1.87 | 575 | 4.35 | 1265 | 4.66 | 5946 | 1.19 | 2972 | 1.38 | 937 | 2.45 |
| 47 | 2022-11-26 | 12291 | 1.89 | 677 | 3.99 | 1333 | 5.85 | 5937 | 0.94 | 2633 | 1.52 | 1710 | 1.81 |
| 48 | 2022-12-03 | 12343 | 1.88 | 808 | 4.33 | 1453 | 5.09 | 6343 | 1.04 | 2783 | 1.40 | 956 | 1.88 |
| 49 | 2022-12-10 | 12262 | 1.70 | 962 | 2.81 | 1417 | 4.59 | 6469 | 1.07 | 2419 | 1.03 | 995 | 2.21 |
| 50 | 2022-12-17 | 12368 | 2.29 | 987 | 4.05 | 1364 | 6.16 | 6718 | 1.31 | 2230 | 1.70 | 1069 | 3.09 |
| 51 | 2022-12-24 | 11718 | 1.76 | 783 | 2.30 | 1161 | 5.51 | 6638 | 1.11 | 2150 | 1.12 | 986 | 2.64 |
| 52 | 2022-12-31 | 11030 | 1.80 | 638 | 2.04 | 1020 | 6.57 | 6308 | 1.08 | 2059 | 1.51 | 1005 | 1.99 |
| 1 | 2023-01-07 | 12008 | 1.88 | 802 | 3.74 | 1027 | 6.52 | 6866 | 1.12 | 2349 | 1.45 | 964 | 1.87 |
| 2 | 2023-01-14 | 10766 | 1.87 | 526 | 3.42 | 819 | 6.11 | 6446 | 1.12 | 2229 | 1.70 | 746 | 3.08 |
Positive human metapneumovirus (HMPV) tests
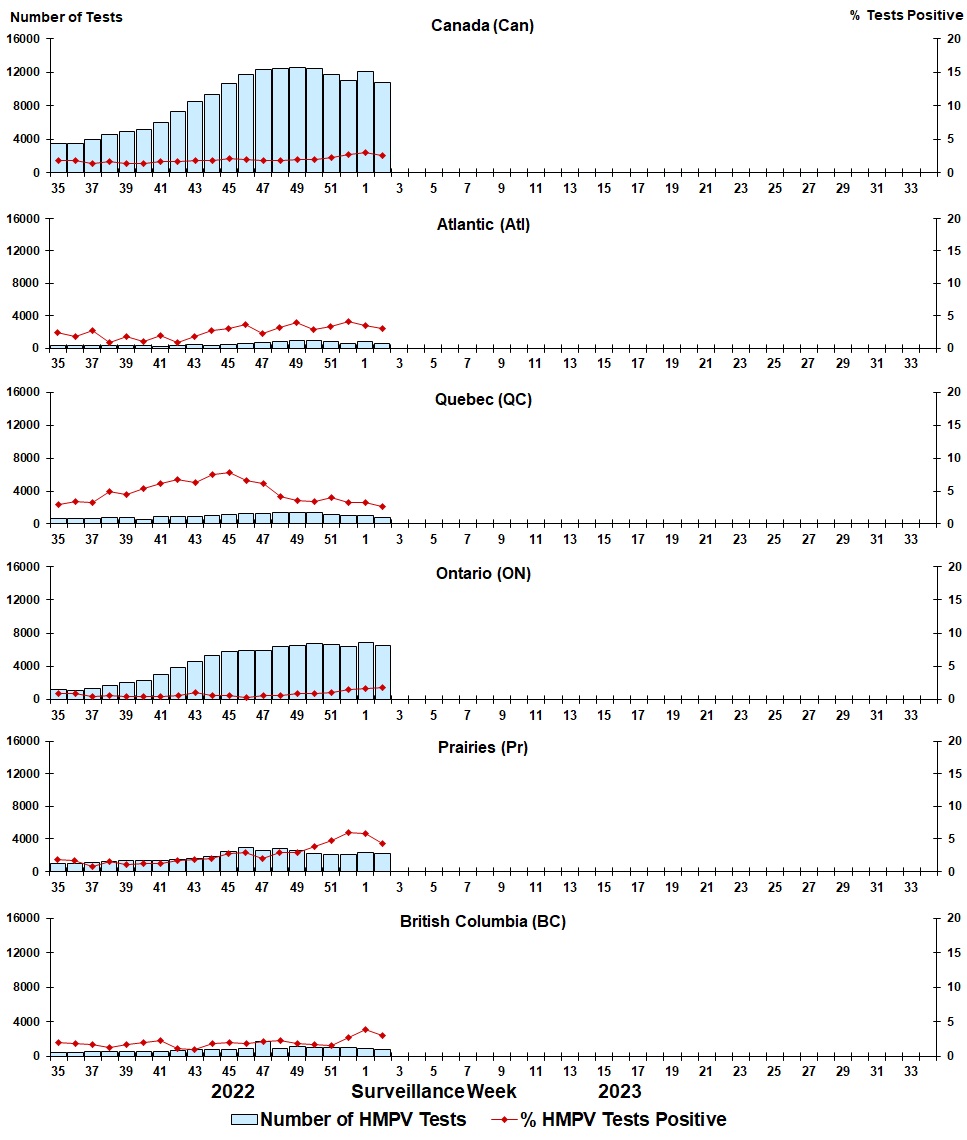
Figure 8: Positive human metapneumovirus (HMPV) tests (%) in Canada by region by surveillance week
| Week | Week End | Can Tests | HMPV% | Atl Tests | HMPV% | QC Tests | HMPV% | ON Tests | HMPV% | Pr Tests | HMPV% | BC Tests | HMPV% |
|---|---|---|---|---|---|---|---|---|---|---|---|---|---|
| 35 | 2022-09-03 | 3492 | 1.80 | 294 | 2.38 | 619 | 2.91 | 1179 | 0.93 | 998 | 1.90 | 402 | 1.99 |
| 36 | 2022-09-10 | 3489 | 1.81 | 280 | 1.79 | 649 | 3.39 | 1089 | 0.92 | 1049 | 1.72 | 422 | 1.90 |
| 37 | 2022-09-17 | 3992 | 1.38 | 301 | 2.66 | 665 | 3.31 | 1368 | 0.51 | 1127 | 0.80 | 530 | 1.70 |
| 38 | 2022-09-24 | 4603 | 1.61 | 334 | 0.90 | 723 | 4.98 | 1714 | 0.53 | 1285 | 1.48 | 547 | 1.28 |
| 39 | 2022-10-01 | 4895 | 1.43 | 286 | 1.75 | 729 | 4.53 | 2001 | 0.45 | 1341 | 1.04 | 538 | 1.67 |
| 40 | 2022-10-08 | 5096 | 1.43 | 298 | 1.01 | 581 | 5.34 | 2236 | 0.45 | 1414 | 1.27 | 567 | 1.94 |
| 41 | 2022-10-15 | 6027 | 1.66 | 265 | 1.89 | 857 | 6.07 | 2962 | 0.41 | 1344 | 1.26 | 599 | 2.34 |
| 42 | 2022-10-22 | 7277 | 1.57 | 354 | 0.85 | 911 | 6.70 | 3865 | 0.52 | 1440 | 1.53 | 707 | 1.13 |
| 43 | 2022-10-29 | 8449 | 1.78 | 441 | 1.81 | 960 | 6.35 | 4632 | 0.97 | 1576 | 1.78 | 839 | 0.95 |
| 44 | 2022-11-05 | 9271 | 1.79 | 362 | 2.76 | 977 | 7.57 | 5245 | 0.57 | 1865 | 1.98 | 822 | 1.82 |
| 45 | 2022-11-12 | 10656 | 2.06 | 458 | 3.06 | 1123 | 7.84 | 5838 | 0.57 | 2453 | 2.77 | 783 | 2.04 |
| 46 | 2022-11-19 | 11677 | 1.89 | 575 | 3.65 | 1247 | 6.58 | 5955 | 0.27 | 2962 | 2.87 | 937 | 1.81 |
| 47 | 2022-11-26 | 12282 | 1.78 | 677 | 2.22 | 1325 | 6.11 | 5951 | 0.55 | 2618 | 2.02 | 1710 | 2.16 |
| 48 | 2022-12-03 | 12372 | 1.86 | 808 | 3.22 | 1438 | 4.17 | 6359 | 0.64 | 2811 | 2.88 | 956 | 2.30 |
| 49 | 2022-12-10 | 12303 | 1.91 | 962 | 3.95 | 1407 | 3.55 | 6473 | 0.85 | 2466 | 2.88 | 995 | 2.11 |
| 50 | 2022-12-17 | 12385 | 1.92 | 987 | 2.84 | 1350 | 3.48 | 6726 | 0.86 | 2253 | 3.86 | 1069 | 1.68 |
| 51 | 2022-12-24 | 11712 | 2.23 | 773 | 3.36 | 1152 | 4.08 | 6652 | 1.05 | 2149 | 4.75 | 986 | 1.62 |
| 52 | 2022-12-31 | 11053 | 2.75 | 638 | 4.08 | 1020 | 3.33 | 6330 | 1.50 | 2060 | 5.92 | 1005 | 2.69 |
| 1 | 2023-01-07 | 12017 | 2.94 | 802 | 3.49 | 1018 | 3.24 | 6872 | 1.67 | 2361 | 5.89 | 964 | 3.94 |
| 2 | 2023-01-14 | 10804 | 2.53 | 526 | 3.04 | 813 | 2.58 | 6464 | 1.79 | 2255 | 4.35 | 746 | 2.95 |
Positive enterovirus/rhinovirus (EV/RV) tests
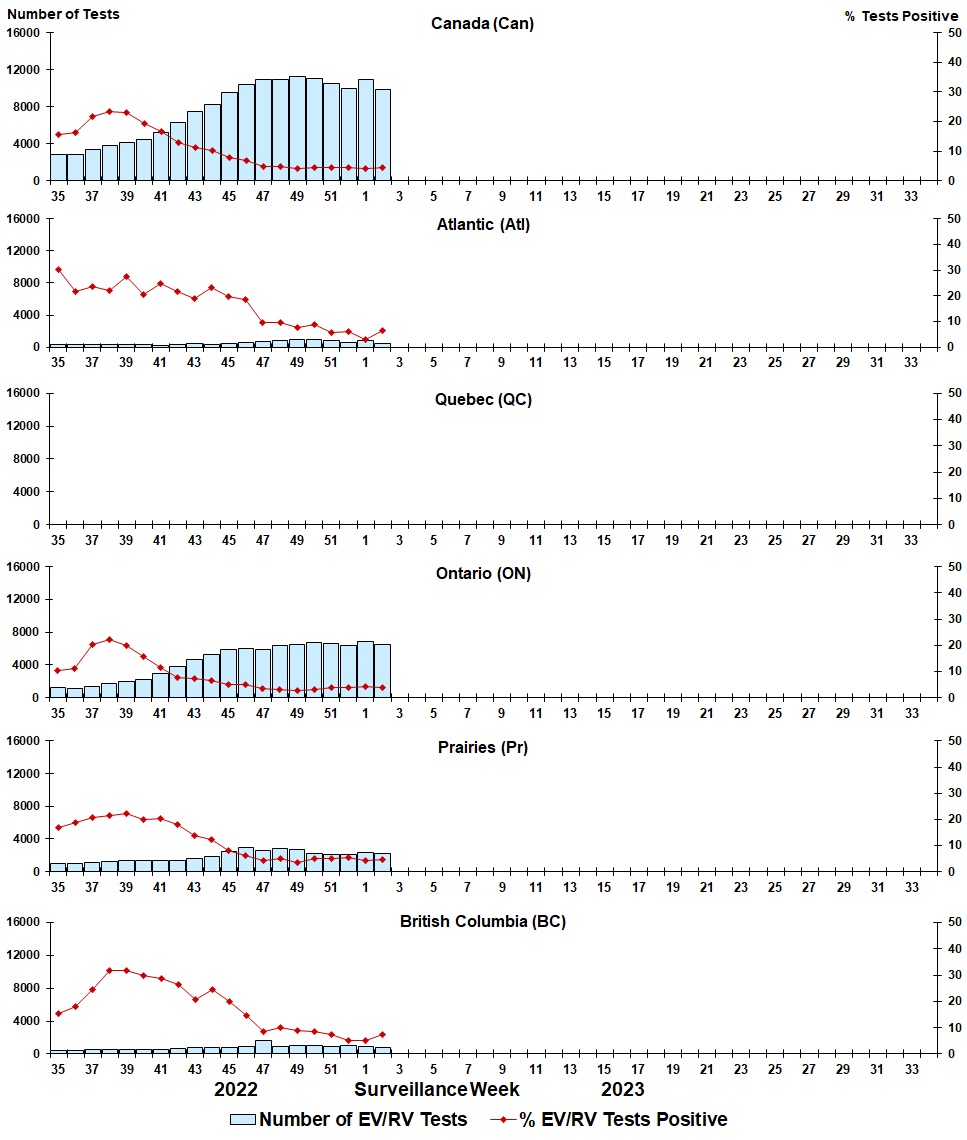
Figure 9: Positive enterovirus/rhinovirus (EV/RV) tests (%) in Canada by region by surveillance week
| Week | Week End | Can Tests | EV/RV% | Atl Tests | EV/RV% | QC Tests | EV/RV% | ON Tests | EV/RV% | Pr Tests | EV/RV% | BC Tests | EV/RV% |
|---|---|---|---|---|---|---|---|---|---|---|---|---|---|
| 35 | 2022-09-03 | 2845 | 15.47 | 294 | 30.27 | - | - | 1179 | 10.18 | 947 | 16.79 | 394 | 15.48 |
| 36 | 2022-09-10 | 2817 | 16.22 | 280 | 21.79 | - | - | 1089 | 11.20 | 1013 | 18.76 | 417 | 17.99 |
| 37 | 2022-09-17 | 3337 | 21.73 | 301 | 23.59 | - | - | 1368 | 20.10 | 1101 | 20.62 | 522 | 24.33 |
| 38 | 2022-09-24 | 3847 | 23.50 | 334 | 22.16 | - | - | 1689 | 22.20 | 1255 | 21.59 | 538 | 31.78 |
| 39 | 2022-10-01 | 4149 | 22.87 | 286 | 27.62 | - | - | 2001 | 19.94 | 1309 | 22.23 | 521 | 31.67 |
| 40 | 2022-10-08 | 4488 | 19.32 | 298 | 20.47 | - | - | 2235 | 15.84 | 1365 | 19.85 | 546 | 29.67 |
| 41 | 2022-10-15 | 5161 | 16.70 | 265 | 24.91 | - | - | 2963 | 11.51 | 1305 | 20.15 | 579 | 28.67 |
| 42 | 2022-10-22 | 6332 | 12.95 | 354 | 21.47 | - | - | 3863 | 7.77 | 1389 | 18.14 | 678 | 26.40 |
| 43 | 2022-10-29 | 7495 | 11.05 | 441 | 19.05 | - | - | 4632 | 7.38 | 1554 | 13.96 | 814 | 20.64 |
| 44 | 2022-11-05 | 8272 | 10.23 | 362 | 23.20 | - | - | 5245 | 6.43 | 1827 | 12.10 | 796 | 24.37 |
| 45 | 2022-11-12 | 9526 | 7.77 | 458 | 19.87 | - | - | 5837 | 4.99 | 2415 | 7.99 | 759 | 19.89 |
| 46 | 2022-11-19 | 10428 | 6.94 | 575 | 18.43 | - | - | 5952 | 4.96 | 2945 | 6.25 | 904 | 14.49 |
| 47 | 2022-11-26 | 10987 | 4.88 | 677 | 9.75 | - | - | 5927 | 3.36 | 2619 | 4.39 | 1678 | 8.70 |
| 48 | 2022-12-03 | 10945 | 4.75 | 808 | 9.78 | - | - | 6359 | 3.21 | 2774 | 4.83 | 931 | 10.20 |
| 49 | 2022-12-10 | 10971 | 4.14 | 962 | 7.59 | - | - | 6473 | 2.90 | 2425 | 3.84 | 995 | 9.25 |
| 50 | 2022-12-17 | 11052 | 4.58 | 987 | 8.81 | - | - | 6726 | 3.20 | 2213 | 4.84 | 1038 | 8.67 |
| 51 | 2022-12-24 | 10516 | 4.49 | 783 | 5.75 | - | - | 6652 | 3.77 | 2125 | 4.89 | 956 | 7.53 |
| 52 | 2022-12-31 | 9987 | 4.48 | 638 | 6.11 | - | - | 6330 | 3.95 | 2047 | 5.23 | 972 | 5.25 |
| 1 | 2023-01-07 | 10946 | 4.18 | 802 | 3.12 | - | - | 6873 | 4.13 | 2334 | 4.33 | 937 | 5.02 |
| 2 | 2023-01-14 | 9914 | 4.59 | 526 | 6.65 | - | - | 6464 | 4.05 | 2210 | 4.75 | 714 | 7.42 |
Positive human coronavirus (HCoV) tests
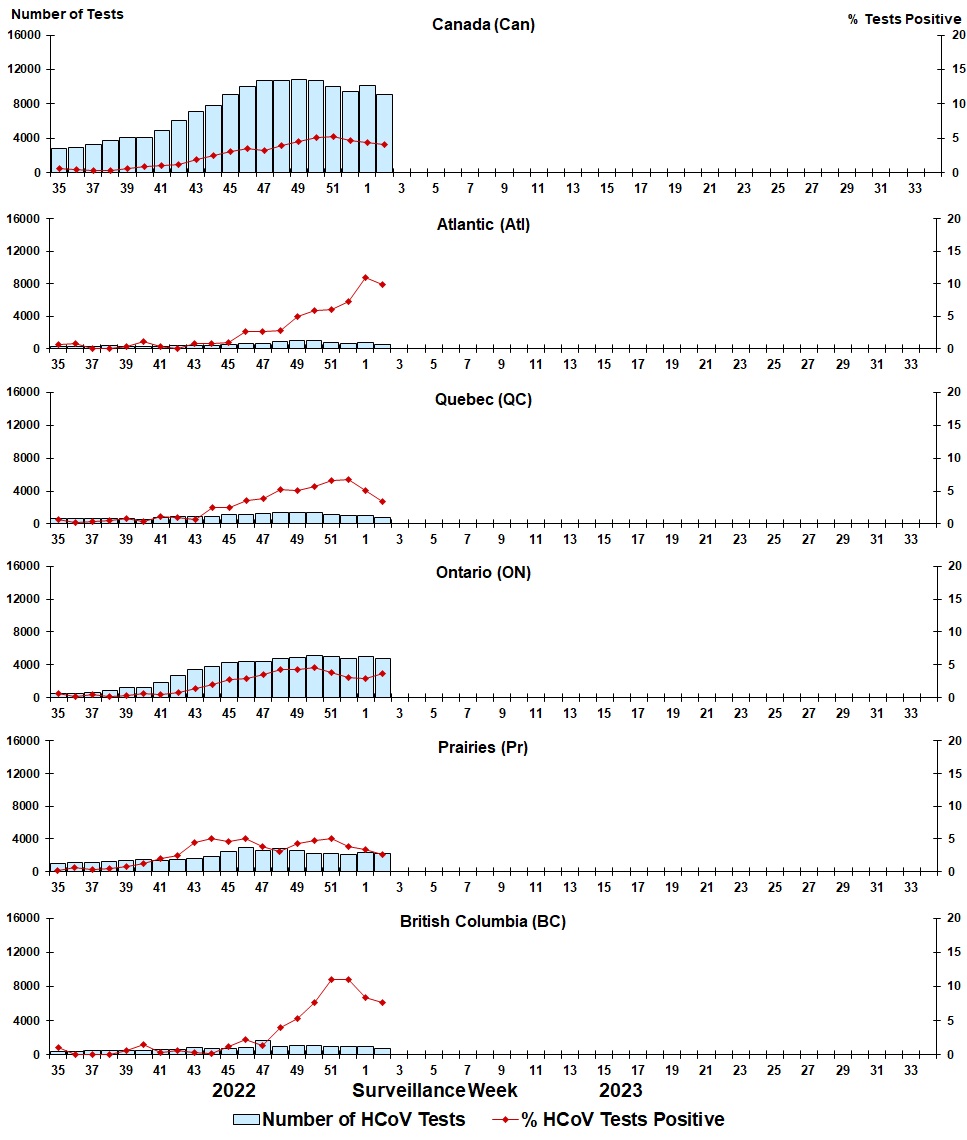
Figure 10: Positive human coronavirus (HCoV) tests (%) in Canada by region by surveillance week
| Week | Week End | Can Tests | HCoV% | Atl Tests | HCoV% | QC Tests | HCoV% | ON Tests | HCoV% | Pr Tests | HCoV% | BC Tests | HCoV% |
|---|---|---|---|---|---|---|---|---|---|---|---|---|---|
| 35 | 2022-09-03 | 2818 | 0.53 | 294 | 0.68 | 610 | 0.66 | 523 | 0.57 | 997 | 0.20 | 394 | 1.02 |
| 36 | 2022-09-10 | 2877 | 0.38 | 280 | 0.71 | 639 | 0.16 | 495 | 0.20 | 1046 | 0.67 | 417 | 0.00 |
| 37 | 2022-09-17 | 3264 | 0.28 | 301 | 0.00 | 654 | 0.31 | 658 | 0.46 | 1128 | 0.35 | 522 | 0.00 |
| 38 | 2022-09-24 | 3716 | 0.32 | 334 | 0.00 | 705 | 0.57 | 853 | 0.23 | 1286 | 0.47 | 538 | 0.00 |
| 39 | 2022-10-01 | 4034 | 0.59 | 286 | 0.35 | 716 | 0.84 | 1170 | 0.34 | 1341 | 0.75 | 521 | 0.58 |
| 40 | 2022-10-08 | 4079 | 0.93 | 298 | 1.01 | 568 | 0.35 | 1253 | 0.56 | 1414 | 1.27 | 546 | 1.47 |
| 41 | 2022-10-15 | 4922 | 1.00 | 265 | 0.38 | 842 | 1.07 | 1889 | 0.53 | 1347 | 2.00 | 579 | 0.35 |
| 42 | 2022-10-22 | 6026 | 1.16 | 354 | 0.00 | 884 | 1.02 | 2671 | 0.79 | 1439 | 2.50 | 678 | 0.59 |
| 43 | 2022-10-29 | 7154 | 1.86 | 386 | 0.78 | 922 | 0.65 | 3451 | 1.45 | 1580 | 4.49 | 814 | 0.37 |
| 44 | 2022-11-05 | 7767 | 2.54 | 362 | 0.83 | 943 | 2.55 | 3800 | 1.97 | 1866 | 5.04 | 796 | 0.13 |
| 45 | 2022-11-12 | 9087 | 3.00 | 458 | 0.87 | 1087 | 2.48 | 4325 | 2.80 | 2457 | 4.56 | 759 | 1.19 |
| 46 | 2022-11-19 | 10077 | 3.54 | 575 | 2.61 | 1193 | 3.52 | 4433 | 2.96 | 2971 | 5.02 | 904 | 2.21 |
| 47 | 2022-11-26 | 10691 | 3.24 | 677 | 2.66 | 1290 | 3.80 | 4433 | 3.50 | 2612 | 3.83 | 1678 | 1.43 |
| 48 | 2022-12-03 | 10719 | 3.95 | 808 | 2.72 | 1379 | 5.29 | 4787 | 4.24 | 2814 | 3.13 | 931 | 3.97 |
| 49 | 2022-12-10 | 10684 | 4.46 | 962 | 4.89 | 1383 | 4.92 | 4874 | 4.21 | 2470 | 4.29 | 995 | 5.03 |
| 50 | 2022-12-17 | 10765 | 5.13 | 987 | 5.78 | 1350 | 5.63 | 5133 | 4.56 | 2257 | 4.70 | 1038 | 7.61 |
| 51 | 2022-12-24 | 10056 | 5.28 | 783 | 6.00 | 1147 | 6.63 | 5024 | 3.86 | 2149 | 5.07 | 953 | 11.02 |
| 52 | 2022-12-31 | 9437 | 4.73 | 638 | 7.21 | 1016 | 6.69 | 4746 | 3.08 | 2065 | 3.83 | 972 | 11.01 |
| 1 | 2023-01-07 | 10142 | 4.40 | 802 | 10.97 | 1017 | 5.11 | 5026 | 2.94 | 2360 | 3.35 | 937 | 8.43 |
| 2 | 2023-01-14 | 9117 | 4.06 | 526 | 9.89 | 811 | 3.45 | 4805 | 3.64 | 2261 | 2.65 | 714 | 7.70 |