
Respiratory Virus Report, Week 44 - ending November 5, 2022
In this Respiratory Virus Report, the number of detections of coronavirus reflects only seasonal human coronaviruses, not the novel pandemic coronavirus (SARS-CoV-2) that causes COVID-19. For information on COVID-19, see the Coronavirus disease (COVID-19): Outbreak update
Overall Summary
Respiratory virus activity has increased in recent weeks in Canada, and activity of several viruses is above expected levels.
- Overall influenza activity is increasing and above expected levels for this time of year (2,234 detections; 11.7% positive). Influenza activity is above the seasonal threshold of 5% of tests positive, indicating the beginning of the influenza epidemic at the national level.
- Influenza activity is increasing across Canada, with nearly all regions reporting over 5% of tests positive.
- Influenza A accounts for nearly all influenza activity in Canada.
- Overall respiratory syncytial virus activity is increasing and is above expected levels for this time of year (1,309 detections; 7.8% positive). Level of activity is variable across regions (range: 1.8%–20.1% positive).
- Activity of other respiratory viruses is relatively stable and near expected levels for this time of year.
- 32/34 sentinel laboratories reported surveillance data.
On this page
- List of abbreviations
- Respiratory virus detections
- Positive respiratory virus tests historical comparison
- Number of positive respiratory virus tests
- Positive influenza (Flu) tests
- Positive respiratory syncytial virus (RSV) tests
- Positive human parainfluenza virus (HPIV) tests
- Positive adenovirus (ADV) tests
- Positive human metapneumovirus (HMPV) tests
- Positive enterovirus/rhinovirus (EV/ RV) tests
- Positive human coronavirus (HCoV) tests
Abbreviations:
- Flu
- Influenza
- Flu A(H1)pdm09
- Influenza A(H1N1)pdm09
- Flu A(H3)
- Influenza A(H3N2)
- Flu A(UnS)
- Influenza A(Unsubtyped)
- RSV
- Respiratory syncytial virus
- HPIV
- Human parainfluenza virus
- HMPV
- Human metapneumovirus
- ADV
- Adenovirus
- EV/RV
- Enterovirus/Rhinovirus
- HCoV
- Human coronavirus
- Atl
- Atlantic Canada
- BC
- British Columbia
- Can
- Canada
- EORLA
- Eastern Ontario Regional Laboratory Association
- HSC
- Health Sciences Centre
- N.C.
- Data not collected
- N.R.
- Data not reported for current week
- ON
- Ontario
- PR
- Prairies
- P.H.O.L.
- Public Health Ontario Laboratory
- QC
- Quebec
- Terr
- Territories of Canada
- UHN
- University Health Network
Respiratory virus detections
Table 1: Respiratory virus detections for the week ending November 5, 2022 (surveillance week 2022-44)
| Reporting Laboratory | Flu Tested | A(H1)pdm09 Positive | A(H3) Positive | A(UnS) Positive | Total Flu A Positive | Total Flu B Positive | RSV Tested | RSV Positive | HPIV Tested | HPIV 1 Positive | HPIV 2 Positive | HPIV 3 Positive | HPIV 4 Positive | Other HPIV Positive | ADV Tested | ADV Positive | HMPV Tested | HMPV Positive | EV/RV Tested | EV/RV Positive | HCoV Tested | HCoV Positive |
|---|---|---|---|---|---|---|---|---|---|---|---|---|---|---|---|---|---|---|---|---|---|---|
| Newfoundland | 220 | 0 | 0 | 1 | 1 | 0 | 220 | 8 | 220 | 0 | 0 | 4 | 0 | 0 | 220 | 12 | 220 | 10 | 220 | 37 | 220 | 1 |
| Prince Edward Island | 63 | 0 | 5 | 1 | 6 | 0 | 63 | 1 | 63 | 4 | 5 | 5 | 1 | 0 | 63 | 4 | 63 | 0 | 63 | 19 | 63 | 1 |
| Nova Scotia | 415 | 0 | 0 | 32 | 32 | 0 | 415 | 51 | 33 | 0 | 0 | 3 | 0 | 0 | 33 | 1 | 33 | 0 | 33 | 13 | 33 | 0 |
| New Brunswick | 511 | 0 | 6 | 52 | 58 | 0 | 266 | 4 | 46 | 0 | 2 | 2 | 2 | 0 | 46 | 5 | 46 | 0 | 46 | 15 | 46 | 1 |
| Atlantic | 1209 | 0 | 11 | 86 | 97 | 0 | 964 | 64 | 362 | 4 | 7 | 14 | 3 | 0 | 362 | 22 | 362 | 10 | 362 | 84 | 362 | 3 |
| Région Nord-Est | 1037 | 0 | 0 | 2 | 2 | 0 | 225 | 38 | 25 | 0 | 0 | 0 | 0 | 0 | 25 | 0 | 25 | 2 | N.C. | N.C. | 25 | 2 |
| Québec-Chaudière-Appalaches | 428 | 0 | 0 | 3 | 3 | 0 | 429 | 121 | 179 | 1 | 0 | 3 | 0 | 0 | 191 | 15 | 179 | 15 | N.C. | N.C. | 179 | 8 |
| Centre-du-Québec | 437 | 0 | 0 | 14 | 14 | 0 | 424 | 95 | 26 | 1 | 0 | 1 | 0 | 0 | 26 | 2 | 26 | 3 | N.C. | N.C. | 26 | 0 |
| Montréal-Laval | 1833 | 0 | 1 | 83 | 84 | 1 | 1375 | 216 | 656 | 6 | 1 | 7 | 0 | 0 | 656 | 26 | 660 | 48 | N.C. | N.C. | 625 | 11 |
| Ouest du Québec | 326 | 0 | 0 | 23 | 23 | 0 | 274 | 65 | 46 | 2 | 0 | 6 | 0 | 0 | 46 | 5 | 46 | 4 | N.C. | N.C. | 46 | 3 |
| Montérégie | 346 | 0 | 0 | 22 | 22 | 0 | 346 | 82 | 5 | 0 | 0 | 0 | 0 | 0 | 5 | 0 | 5 | 0 | N.C. | N.C. | 5 | 0 |
| Province of Québec | 4407 | 0 | 1 | 147 | 148 | 1 | 3073 | 617 | 937 | 10 | 1 | 17 | 0 | 0 | 949 | 48 | 941 | 72 | N.C. | N.C. | 906 | 24 |
| P.H.O.L. - Ottawa | 129 | 0 | 1 | 0 | 1 | 0 | 129 | 1 | 129 | 0 | 0 | 0 | 0 | 3 | 129 | 0 | 129 | 0 | 129 | 9 | 129 | 0 |
| EORLA | N.R. | N.R. | N.R. | N.R. | N.R. | N.R. | N.R. | N.R. | N.R. | N.R. | N.R. | N.R. | N.R. | N.R. | N.R. | N.R. | N.R. | N.R. | N.R. | N.R. | N.R. | N.R. |
| P.H.O.L. - Kingston | 62 | 0 | 1 | 2 | 3 | 0 | 62 | 9 | 60 | 0 | 0 | 0 | 0 | 6 | 60 | 0 | 60 | 0 | 60 | 8 | 60 | 4 |
| UHN / Mount Sinai Hospital | 621 | 0 | 0 | 28 | 28 | 1 | 621 | 3 | 23 | 0 | 0 | 0 | 0 | 0 | 23 | 0 | 23 | 0 | 23 | 2 | 23 | 2 |
| P.H.O.L. - Toronto | 762 | 4 | 188 | 1 | 43 | 0 | 762 | 18 | 762 | 0 | 0 | 0 | 0 | 44 | 762 | 13 | 762 | 8 | 762 | 63 | 762 | 25 |
| Sick Kids Hospital - Toronto | N.R. | N.R. | N.R. | N.R. | N.R. | N.R. | N.R. | N.R. | N.R. | N.R. | N.R. | N.R. | N.R. | N.R. | N.R. | N.R. | N.R. | N.R. | N.R. | N.R. | N.R. | N.R. |
| Shared Hospital Laboratory | 2322 | 4 | 180 | 247 | 431 | 0 | 2322 | 149 | 1987 | 0 | 0 | 0 | 0 | 20 | 1987 | 13 | 1989 | 5 | 1989 | 73 | 1988 | 26 |
| P.H.O.L. - Sault Ste. Marie | 11 | 0 | 0 | 0 | 0 | 0 | 11 | 0 | 11 | 0 | 0 | 0 | 0 | 0 | 11 | 0 | 11 | 0 | 11 | 2 | 11 | 0 |
| P.H.O.L. - Timmins | 12 | 0 | 3 | 0 | 3 | 0 | 12 | 0 | 12 | 0 | 0 | 0 | 0 | 0 | 12 | 0 | 12 | 0 | 12 | 0 | 12 | 0 |
| St. Joseph's - London | 338 | 0 | 0 | 22 | 22 | 0 | 338 | 38 | 49 | 0 | 0 | 0 | 0 | 1 | 49 | 4 | 49 | 0 | 49 | 12 | 49 | 3 |
| P.H.O.L. - London | 265 | 1 | 45 | 2 | 48 | 0 | 265 | 39 | 265 | 0 | 0 | 0 | 0 | 16 | 265 | 7 | 265 | 0 | 265 | 14 | 265 | 4 |
| P.H.O.L. - Orillia | 121 | 0 | 43 | 0 | 43 | 0 | 121 | 8 | 121 | 0 | 0 | 0 | 0 | 10 | 121 | 3 | 121 | 0 | 121 | 17 | 121 | 5 |
| P.H.O.L. - Thunder Bay | 43 | 0 | 9 | 1 | 10 | 0 | 43 | 0 | 43 | 0 | 0 | 0 | 0 | 0 | 43 | 0 | 43 | 0 | 43 | 0 | 43 | 0 |
| P.H.O.L. - Sudbury | 9 | 0 | 0 | 0 | 0 | 0 | 9 | 1 | 9 | 0 | 0 | 0 | 0 | 1 | 9 | 1 | 9 | 1 | 9 | 2 | 9 | 0 |
| P.H.O.L. - Hamilton | 160 | 0 | 32 | 1 | 33 | 0 | 160 | 26 | 160 | 0 | 0 | 0 | 0 | 4 | 160 | 4 | 160 | 6 | 160 | 17 | 160 | 3 |
| P.H.O.L. - Peterborough | 33 | 0 | 9 | 0 | 9 | 0 | 33 | 0 | 33 | 0 | 0 | 0 | 0 | 0 | 33 | 0 | 33 | 0 | 33 | 1 | 33 | 0 |
| St. Joseph's - Hamilton | 1444 | 0 | 0 | 241 | 241 | 1 | 1444 | 115 | 1444 | 0 | 0 | 47 | 0 | 0 | 1444 | 9 | 1444 | 1 | 1444 | 84 | 0 | 0 |
| Province of Ontario | 6332 | 9 | 511 | 545 | 915 | 2 | 6332 | 407 | 5108 | 0 | 0 | 47 | 0 | 105 | 5108 | 54 | 5110 | 21 | 5110 | 304 | 3665 | 72 |
| Manitoba | 778 | 3 | 4 | 0 | 7 | 0 | 778 | 23 | 155 | 0 | 0 | 8 | 1 | 0 | 155 | 7 | 187 | 10 | 155 | 34 | 187 | 1 |
| Saskatchewan | 896 | 0 | 0 | 192 | 192 | 0 | 703 | 12 | 377 | 2 | 4 | 21 | 1 | 0 | 377 | 11 | 377 | 14 | 377 | 56 | 377 | 11 |
| Alberta | 3200 | 19 | 521 | 113 | 653 | 0 | 2675 | 100 | 1119 | 7 | 1 | 29 | 1 | 0 | 1119 | 15 | 1118 | 9 | 1100 | 103 | 1119 | 69 |
| Prairies | 4874 | 22 | 525 | 305 | 852 | 0 | 4156 | 135 | 1651 | 9 | 5 | 58 | 3 | 0 | 1651 | 33 | 1682 | 33 | 1632 | 193 | 1683 | 81 |
| British Columbia | 2163 | 13 | 54 | 0 | 172 | 0 | 2163 | 83 | 463 | 8 | 11 | 26 | 0 | 0 | 463 | 10 | 463 | 13 | 463 | 117 | 463 | 1 |
| Yukon | 6 | 0 | 0 | 0 | 0 | 0 | 6 | 0 | N.C. | N.C. | N.C. | N.C. | N.C. | N.C. | N.C. | N.C. | N.C. | N.C. | N.C. | N.C. | N.C. | N.C. |
| Northwest Territories | 42 | 0 | 0 | 0 | 0 | 0 | 42 | 1 | 0 | 0 | 0 | 0 | 0 | 0 | 0 | 0 | 0 | 0 | 42 | 10 | 0 | 0 |
| Nunavut | 120 | 0 | 47 | 0 | 47 | 0 | 120 | 2 | N.C. | N.C. | N.C. | N.C. | N.C. | N.C. | N.C. | N.C. | N.C. | N.C. | N.C. | N.C. | N.C. | N.C. |
| Territories | 168 | 0 | 47 | 0 | 47 | 0 | 168 | 3 | 0 | 0 | 0 | 0 | 0 | 0 | 0 | 0 | 0 | 0 | 42 | 10 | 0 | 0 |
| CANADA | 19153 | 44 | 1149 | 1083 | 2231 | 3 | 16856 | 1309 | 8521 | 31 | 24 | 162 | 6 | 105 | 8533 | 167 | 8558 | 149 | 7609 | 708 | 7079 | 181 |
The data in the RVDSS report represent surveillance data available at the time of writing. Data missing from the current week are denoted by N.R. Data not collected by reporting lab denoted by N.C.
Specimens from Yukon (YT) are sent to reference laboratories in British Columbia and reported results reflect specimens identified as originating from YT.
Results from British Columbia comprise of specimens from the following sites: Children's and Women's Hospital Laboratory, Fraser Health Medical Microbiology Laboratory, Island Health, Providence Health Care, Vancouver Coastal Health sites, Victoria General Hospital, BCCDC Public Health Laboratory, Interior Health Authority sites and Northern Health Authority sites.
Due to different testing protocols of laboratories across Canada, influenza A subtype detection counts may not be included in total influenza A detection counts. Total influenza A and B positive counts are used to calculate percentage of tests positive.
Delays in the reporting of data may cause data to change retrospectively.
Table 2: Cumulative respiratory virus detections from August 28, 2022 to November 5, 2022 (surveillance weeks 2022-35 to 2022-44)
| Reporting Laboratory | Flu Tested | A(H1)pdm09 Positive | A(H3) Positive | A(UnS) Positive | Total Flu A Positive | Total Flu B Positive | RSV Tested | RSV Positive | HPIV Tested | HPIV 1 Positive | HPIV 2 Positive | HPIV 3 Positive | HPIV 4 Positive | Other HPIV Positive | ADV Tested | ADV Positive | HMPV Tested | HMPV Positive | EV/RV Tested | EV/RV Positive | HCoV Tested | HCoV Positive |
|---|---|---|---|---|---|---|---|---|---|---|---|---|---|---|---|---|---|---|---|---|---|---|
| Newfoundland | 1846 | 0 | 1 | 1 | 2 | 0 | 1846 | 65 | 1846 | 2 | 7 | 12 | 3 | 0 | 1846 | 27 | 1846 | 50 | 1846 | 260 | 1846 | 2 |
| Prince Edward Island | 423 | 0 | 6 | 1 | 7 | 0 | 423 | 8 | 423 | 4 | 10 | 24 | 2 | 0 | 423 | 28 | 423 | 6 | 423 | 212 | 423 | 2 |
| Nova Scotia | 2645 | 0 | 3 | 54 | 57 | 1 | 2644 | 119 | 455 | 3 | 4 | 7 | 1 | 0 | 455 | 16 | 455 | 0 | 455 | 116 | 455 | 3 |
| New Brunswick | 4027 | 0 | 11 | 102 | 113 | 1 | 2752 | 31 | 491 | 0 | 8 | 29 | 4 | 0 | 491 | 43 | 491 | 1 | 491 | 157 | 436 | 8 |
| Atlantic | 8941 | 0 | 21 | 158 | 179 | 2 | 7665 | 223 | 3215 | 9 | 29 | 72 | 10 | 0 | 3215 | 114 | 3215 | 57 | 3215 | 745 | 3160 | 15 |
| Région Nord-Est | 8749 | 0 | 0 | 8 | 8 | 1 | 1577 | 86 | 238 | 3 | 2 | 14 | 0 | 0 | 238 | 11 | 238 | 4 | N.C. | N.C. | 238 | 2 |
| Québec-Chaudière-Appalaches | 2880 | 0 | 0 | 8 | 8 | 0 | 2886 | 393 | 1431 | 14 | 4 | 19 | 0 | 0 | 1555 | 84 | 1431 | 70 | N.C. | N.C. | 1431 | 17 |
| Centre-du-Québec | 2225 | 0 | 0 | 20 | 20 | 1 | 2194 | 252 | 262 | 11 | 0 | 12 | 0 | 0 | 262 | 14 | 262 | 32 | N.C. | N.C. | 262 | 1 |
| Montréal-Laval | 10850 | 0 | 1 | 158 | 159 | 6 | 9598 | 930 | 5215 | 72 | 8 | 94 | 4 | 0 | 5215 | 157 | 5265 | 284 | N.C. | N.C. | 5076 | 37 |
| Ouest du Québec | 2128 | 0 | 0 | 32 | 32 | 0 | 1849 | 269 | 410 | 12 | 0 | 32 | 0 | 0 | 410 | 60 | 410 | 18 | N.C. | N.C. | 410 | 10 |
| Montérégie | 3749 | 0 | 0 | 51 | 51 | 3 | 3683 | 363 | 29 | 0 | 0 | 1 | 0 | 0 | 29 | 0 | 29 | 0 | N.C. | N.C. | 29 | 0 |
| Province of Québec | 30581 | 0 | 1 | 277 | 278 | 11 | 21787 | 2293 | 7585 | 112 | 14 | 172 | 4 | 0 | 7709 | 326 | 7635 | 408 | N.C. | N.C. | 7446 | 67 |
| P.H.O.L. - Ottawa | 597 | 0 | 5 | 0 | 5 | 0 | 597 | 8 | 597 | 0 | 0 | 0 | 0 | 10 | 597 | 0 | 597 | 10 | 597 | 52 | 597 | 1 |
| EORLA | 2470 | 0 | 0 | 31 | 31 | 1 | 2470 | 177 | 361 | 4 | 2 | 6 | 2 | 0 | 361 | 11 | 361 | 8 | 361 | 119 | 361 | 5 |
| P.H.O.L. - Kingston | 553 | 0 | 16 | 2 | 18 | 0 | 553 | 33 | 547 | 0 | 0 | 0 | 0 | 24 | 547 | 12 | 547 | 5 | 547 | 95 | 547 | 6 |
| UHN / Mount Sinai Hospital | 4728 | 0 | 1 | 67 | 68 | 5 | 4728 | 27 | 198 | 0 | 0 | 1 | 0 | 0 | 198 | 1 | 198 | 0 | 198 | 9 | 198 | 15 |
| P.H.O.L. - Toronto | 3790 | 22 | 372 | 2 | 127 | 0 | 3787 | 59 | 3787 | 0 | 0 | 0 | 0 | 189 | 3789 | 59 | 3786 | 38 | 3787 | 479 | 3786 | 46 |
| Sick Kids Hospital - Toronto | 0 | 0 | 0 | 0 | 0 | 0 | 0 | 0 | 0 | 0 | 0 | 0 | 0 | 0 | 0 | 0 | 0 | 0 | 0 | 0 | 0 | 0 |
| Shared Hospital Laboratory | 27526 | 9 | 331 | 539 | 879 | 2 | 27526 | 472 | 6860 | 4 | 0 | 15 | 0 | 105 | 6872 | 41 | 6881 | 17 | 6853 | 270 | 6730 | 48 |
| P.H.O.L. - Sault Ste. Marie | 60 | 0 | 0 | 0 | 0 | 0 | 60 | 0 | 60 | 0 | 0 | 0 | 0 | 0 | 60 | 0 | 60 | 0 | 60 | 8 | 60 | 0 |
| P.H.O.L. - Timmins | 139 | 0 | 9 | 0 | 9 | 0 | 139 | 0 | 139 | 0 | 0 | 0 | 0 | 9 | 139 | 1 | 139 | 6 | 139 | 27 | 139 | 9 |
| St. Joseph's - London | 1033 | 0 | 0 | 34 | 34 | 0 | 1033 | 86 | 527 | 0 | 0 | 0 | 0 | 13 | 561 | 13 | 561 | 0 | 561 | 120 | 150 | 6 |
| P.H.O.L. - London | 1411 | 2 | 96 | 3 | 94 | 0 | 1411 | 78 | 1411 | 0 | 0 | 0 | 0 | 64 | 1411 | 25 | 1411 | 3 | 1411 | 195 | 1411 | 12 |
| P.H.O.L. - Orillia | 555 | 0 | 81 | 1 | 82 | 0 | 555 | 28 | 555 | 0 | 0 | 0 | 0 | 38 | 555 | 12 | 555 | 6 | 555 | 118 | 555 | 10 |
| P.H.O.L. - Thunder Bay | 130 | 0 | 21 | 1 | 22 | 0 | 130 | 0 | 130 | 0 | 0 | 0 | 0 | 1 | 130 | 1 | 130 | 0 | 130 | 32 | 130 | 1 |
| P.H.O.L. - Sudbury | 66 | 0 | 0 | 0 | 0 | 0 | 66 | 2 | 66 | 0 | 0 | 0 | 0 | 3 | 66 | 2 | 66 | 1 | 66 | 11 | 66 | 0 |
| P.H.O.L. - Hamilton | 978 | 0 | 50 | 1 | 51 | 2 | 975 | 75 | 975 | 0 | 0 | 0 | 0 | 42 | 975 | 13 | 975 | 8 | 975 | 144 | 975 | 9 |
| P.H.O.L. - Peterborough | 319 | 0 | 24 | 0 | 24 | 0 | 319 | 17 | 319 | 0 | 0 | 0 | 0 | 15 | 319 | 5 | 319 | 2 | 319 | 75 | 319 | 3 |
| St. Joseph's - Hamilton | 8966 | 0 | 0 | 558 | 558 | 4 | 8966 | 408 | 8966 | 0 | 0 | 283 | 0 | 0 | 8966 | 66 | 8966 | 33 | 8966 | 1065 | 0 | 0 |
| Province of Ontario | 53321 | 33 | 1006 | 1239 | 2002 | 14 | 53315 | 1470 | 25498 | 8 | 2 | 305 | 2 | 513 | 25546 | 262 | 25552 | 137 | 25525 | 2819 | 16024 | 171 |
| Manitoba | 5901 | 4 | 9 | 18 | 31 | 0 | 5901 | 85 | 1389 | 0 | 2 | 31 | 4 | 0 | 1389 | 50 | 1613 | 55 | 1389 | 371 | 1613 | 6 |
| Saskatchewan | 5813 | 0 | 0 | 284 | 284 | 1 | 4961 | 38 | 2251 | 6 | 16 | 99 | 8 | 0 | 2253 | 71 | 2255 | 90 | 2253 | 415 | 2251 | 37 |
| Alberta | 21881 | 54 | 812 | 167 | 1033 | 6 | 19124 | 318 | 9397 | 60 | 26 | 163 | 9 | 0 | 9396 | 124 | 9388 | 52 | 9209 | 1548 | 9397 | 219 |
| Prairies | 33595 | 58 | 821 | 469 | 1348 | 7 | 29986 | 441 | 13037 | 66 | 44 | 293 | 21 | 0 | 13038 | 245 | 13256 | 197 | 12851 | 2334 | 13261 | 262 |
| British Columbia | 23878 | 68 | 259 | 7 | 505 | 7 | 22296 | 320 | 5616 | 34 | 58 | 183 | 26 | 6 | 5616 | 112 | 5616 | 95 | 5474 | 1392 | 5474 | 25 |
| Yukon | 61 | 0 | 0 | 0 | 0 | 0 | 61 | 1 | N.C. | N.C. | N.C. | N.C. | N.C. | N.C. | N.C. | N.C. | N.C. | N.C. | N.C. | N.C. | N.C. | N.C. |
| Northwest Territories | 392 | 0 | 1 | 0 | 1 | 0 | 392 | 15 | 0 | 0 | 0 | 0 | 0 | 0 | 0 | 0 | 0 | 0 | 392 | 157 | 0 | 0 |
| Nunavut | 823 | 3 | 123 | 0 | 126 | 0 | 823 | 21 | N.C. | N.C. | N.C. | N.C. | N.C. | N.C. | N.C. | N.C. | N.C. | N.C. | N.C. | N.C. | N.C. | N.C. |
| Territories | 1276 | 3 | 124 | 0 | 127 | 0 | 1276 | 37 | 0 | 0 | 0 | 0 | 0 | 0 | 0 | 0 | 0 | 0 | 392 | 157 | 0 | 0 |
| CANADA | 151592 | 162 | 2232 | 2150 | 4439 | 41 | 136325 | 4784 | 54951 | 229 | 147 | 1025 | 63 | 519 | 55124 | 1059 | 55274 | 894 | 47457 | 7447 | 45365 | 540 |
The data in the RVDSS report represent surveillance data available at the time of writing. Data not collected by reporting lab denoted by N.C.
Specimens from Yukon (YT) are sent to reference laboratories in British Columbia and reported results reflect specimens identified as originating from YT.
Results from British Columbia comprise of specimens from the following sites: Children's and Women's Hospital Laboratory, Fraser Health Medical Microbiology Laboratory, Island Health, Providence Health Care, Vancouver Coastal Health sites, Victoria General Hospital, BCCDC Public Health Laboratory, Interior Health Authority sites and Northern Health Authority sites.
Due to different testing protocols of laboratories across Canada, influenza A subtype detection counts may not be included in total influenza A detection counts. Total influenza A and B positive counts are used to calculate percentage of tests positive.
Delays in the reporting of data may cause data to change retrospectively. Due to these delays, the sum of weekly report totals do not add up to cumulative totals.
Positive respiratory virus tests historical comparison
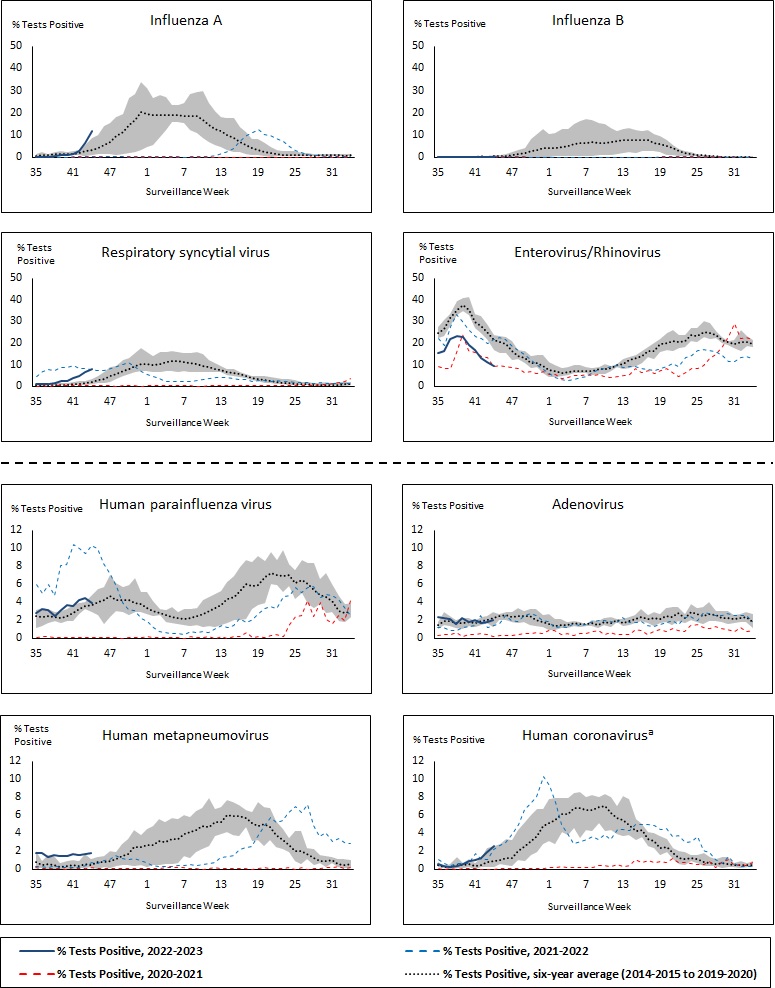
Shaded area represents the maximum and minimum % of respiratory virus tests positive reported by week from seasons 2014-2015 to 2019-2020
Note: Data from week 11 of the 2019-2020 season onwards are excluded from the historical comparison due to the COVID-19 pandemic
Note: % Tests Positive scale changes across the dashed line
a Human coronavirus excludes human coronaviruses SARS-CoV, MERS-CoV and SARS-CoV-2; Includes seasonal human coronaviruses HCoV-229E, HCoV-OC43, HCoV-NL63, HCoV-HKU1.
Figure 1: Positive respiratory virus tests (%) reported by participating laboratories in Canada by surveillance week compared to average and range from 2014-2015 to 2019-2020 season
| Week | Week end | 2022-2023 A% | 2021-2022 A% | 2020-2021 A% | Max A% Base | Min A% Base | Av A% Base | 2022-2023 B% | 2021-2022 B% | 2020-2021 B% | Max B% Base | Min B% Base | Av B% Base | 2022-2023 RSV% | 2021-2022 RSV% | 2020-2021 RSV% | Max RSV% Base | Min RSV% Base | Av RSV% Base | 2022-2023 HPIV% | 2021-2022 HPIV% | 2020-2021 HPIV% | Max HPIV% Base | Min HPIV% Base | Av HPIV% Base | 2022-2023 ADV% | 2021-2022 ADV% | 2020-2021 ADV% | Max ADV% Base | Min ADV% Base | Av ADV% Base | 2022-2023 HMPV% | 2021-2022 HMPV% | 2020-2021 HMPV% | Max HMPV% Base | Min HMPV% Base | Av HMPV% Base | 2022-2023 EV/RV% | 2021-2022 EV/RV% | 2020-2021 EV/RV% | Max EV/RV% Base | Min EV/RV% Base | Av EV/RV% Base | 2022-2023 HCoV% | 2021-2022 HCoV% | 2020-2021 HCoV% | Max HCoV% Base | Min HCoV% Base | Av HCoV% Base |
|---|---|---|---|---|---|---|---|---|---|---|---|---|---|---|---|---|---|---|---|---|---|---|---|---|---|---|---|---|---|---|---|---|---|---|---|---|---|---|---|---|---|---|---|---|---|---|---|---|---|
| 35 | 2022-09-03 | 0.17 | 0.04 | 0.00 | 1.60 | 0.11 | 0.68 | 0.02 | 0.00 | 0.02 | 0.28 | 0.00 | 0.13 | 1.13 | 4.43 | 0.02 | 1.34 | 0.38 | 0.60 | 2.83 | 5.99 | 0.08 | 3.16 | 1.15 | 2.42 | 2.24 | 1.18 | 0.27 | 1.74 | 0.99 | 1.43 | 1.83 | 0.23 | 0.17 | 2.04 | 0.10 | 0.77 | 15.54 | 21.96 | 9.07 | 27.19 | 22.44 | 24.78 | 0.54 | 1.05 | 0.06 | 0.76 | 0.18 | 0.45 |
| 36 | 2022-09-10 | 0.14 | 0.01 | 0.00 | 2.11 | 0.23 | 0.98 | 0.04 | 0.00 | 0.00 | 0.55 | 0.00 | 0.15 | 1.13 | 6.61 | 0.04 | 1.09 | 0.22 | 0.57 | 3.26 | 4.93 | 0.20 | 3.31 | 1.35 | 2.32 | 2.07 | 1.15 | 0.40 | 2.85 | 1.42 | 1.87 | 1.83 | 0.24 | 0.06 | 0.84 | 0.10 | 0.48 | 16.16 | 18.59 | 8.13 | 30.69 | 23.30 | 26.31 | 0.39 | 0.62 | 0.00 | 0.38 | 0.12 | 0.22 |
| 37 | 2022-09-17 | 0.24 | 0.03 | 0.00 | 1.59 | 0.36 | 0.87 | 0.01 | 0.00 | 0.00 | 0.19 | 0.04 | 0.12 | 1.05 | 7.59 | 0.02 | 1.37 | 0.31 | 0.64 | 3.07 | 5.97 | 0.13 | 3.26 | 1.65 | 2.40 | 1.96 | 0.81 | 0.35 | 2.44 | 1.38 | 1.86 | 1.38 | 0.17 | 0.05 | 1.61 | 0.00 | 0.51 | 21.87 | 27.46 | 8.07 | 33.58 | 27.74 | 31.68 | 0.28 | 0.44 | 0.05 | 0.56 | 0.00 | 0.26 |
| 38 | 2022-09-24 | 0.49 | 0.00 | 0.02 | 2.15 | 0.43 | 1.16 | 0.02 | 0.00 | 0.00 | 0.21 | 0.00 | 0.14 | 1.44 | 7.16 | 0.10 | 1.24 | 0.37 | 0.64 | 2.41 | 4.73 | 0.07 | 2.87 | 1.92 | 2.33 | 1.39 | 0.82 | 0.58 | 2.04 | 1.11 | 1.63 | 1.61 | 0.37 | 0.02 | 1.43 | 0.06 | 0.47 | 23.42 | 33.19 | 15.67 | 39.57 | 32.80 | 35.33 | 0.33 | 0.67 | 0.00 | 1.36 | 0.06 | 0.43 |
| 39 | 2022-10-01 | 0.70 | 0.01 | 0.00 | 2.65 | 0.57 | 1.53 | 0.03 | 0.00 | 0.00 | 0.29 | 0.09 | 0.18 | 2.19 | 8.48 | 0.05 | 1.29 | 0.41 | 0.68 | 3.13 | 8.12 | 0.02 | 3.01 | 1.70 | 2.24 | 2.07 | 1.14 | 0.19 | 2.27 | 1.04 | 1.66 | 1.45 | 0.17 | 0.04 | 0.72 | 0.05 | 0.28 | 22.79 | 30.01 | 24.12 | 40.59 | 34.87 | 37.68 | 0.60 | 0.62 | 0.05 | 0.66 | 0.07 | 0.45 |
| 40 | 2022-10-08 | 1.00 | 0.00 | 0.00 | 2.17 | 1.01 | 1.58 | 0.03 | 0.02 | 0.00 | 0.20 | 0.05 | 0.11 | 2.48 | 8.53 | 0.07 | 1.39 | 0.34 | 0.67 | 3.72 | 8.19 | 0.02 | 3.28 | 1.90 | 2.43 | 1.67 | 1.31 | 0.44 | 2.25 | 1.39 | 1.82 | 1.42 | 0.16 | 0.00 | 0.92 | 0.05 | 0.34 | 19.24 | 26.26 | 16.62 | 41.29 | 33.00 | 35.43 | 0.95 | 0.57 | 0.09 | 1.08 | 0.22 | 0.58 |
| 41 | 2022-10-15 | 1.53 | 0.03 | 0.01 | 2.66 | 1.05 | 1.57 | 0.01 | 0.03 | 0.00 | 0.36 | 0.03 | 0.16 | 3.57 | 9.54 | 0.10 | 1.74 | 0.58 | 0.98 | 3.56 | 10.46 | 0.06 | 3.70 | 1.94 | 2.74 | 1.87 | 1.37 | 0.37 | 1.91 | 1.28 | 1.70 | 1.64 | 0.20 | 0.19 | 0.95 | 0.04 | 0.46 | 16.67 | 22.91 | 15.48 | 33.62 | 26.94 | 29.81 | 0.99 | 1.69 | 0.02 | 0.70 | 0.00 | 0.33 |
| 42 | 2022-10-22 | 2.64 | 0.03 | 0.00 | 2.96 | 0.77 | 1.92 | 0.05 | 0.02 | 0.00 | 0.45 | 0.05 | 0.25 | 4.66 | 8.18 | 0.07 | 2.11 | 0.63 | 1.14 | 4.23 | 10.01 | 0.06 | 3.89 | 2.64 | 3.20 | 1.63 | 2.54 | 0.47 | 2.38 | 1.47 | 1.86 | 1.54 | 0.15 | 0.06 | 0.89 | 0.15 | 0.38 | 12.91 | 22.16 | 13.60 | 32.62 | 24.54 | 27.82 | 1.18 | 1.07 | 0.00 | 1.18 | 0.20 | 0.49 |
| 43 | 2022-10-29 | 6.25 | 0.03 | 0.01 | 5.23 | 0.68 | 2.60 | 0.03 | 0.02 | 0.00 | 0.55 | 0.06 | 0.23 | 6.70 | 8.11 | 0.07 | 2.16 | 0.55 | 1.32 | 4.43 | 9.38 | 0.07 | 3.98 | 3.18 | 3.56 | 1.80 | 1.15 | 0.37 | 2.42 | 1.63 | 1.96 | 1.70 | 0.36 | 0.02 | 1.64 | 0.12 | 0.57 | 11.09 | 19.64 | 13.14 | 28.73 | 21.67 | 24.95 | 1.87 | 1.05 | 0.00 | 2.35 | 0.27 | 0.75 |
| 44 | 2022-11-05 | 11.65 | 0.10 | 0.04 | 8.42 | 1.08 | 3.39 | 0.02 | 0.10 | 0.03 | 0.71 | 0.12 | 0.31 | 7.77 | 7.82 | 0.05 | 3.35 | 0.83 | 1.92 | 3.85 | 10.28 | 0.03 | 4.81 | 2.94 | 3.70 | 1.96 | 1.42 | 0.22 | 2.88 | 1.18 | 2.20 | 1.74 | 0.77 | 0.13 | 1.08 | 0.23 | 0.47 | 9.30 | 21.45 | 9.23 | 23.82 | 16.75 | 21.34 | 2.56 | 2.21 | 0.00 | 2.59 | 0.21 | 0.88 |
Number of positive respiratory virus tests
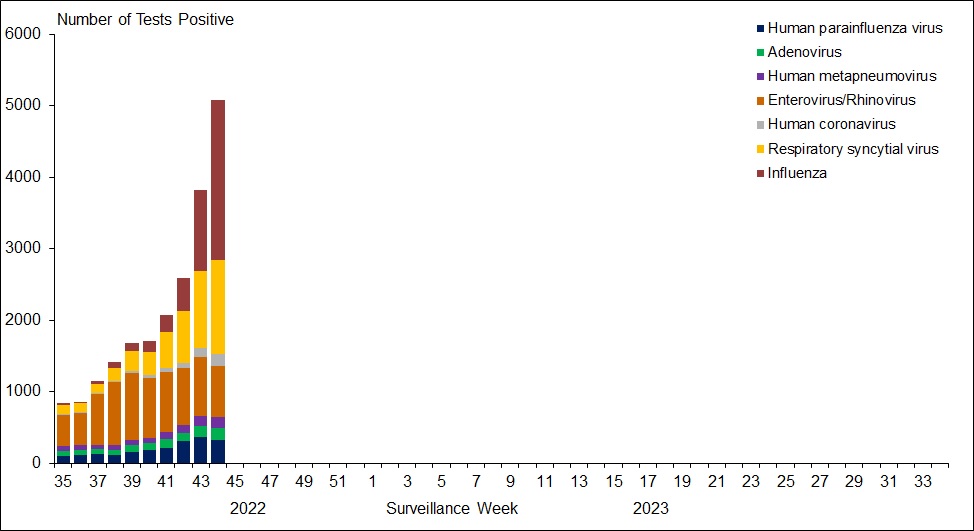
Figure 2: Number of positive respiratory virus tests reported by participating laboratories in Canada by surveillance week
| Week | ParaInfluenza | Adenovirus | Human metapneumovirus | Enterovirus/Rhinovirus | Coronavirus | Respiratory syncytial virus | Influenza |
|---|---|---|---|---|---|---|---|
| 35 | 96 | 77 | 63 | 436 | 15 | 130 | 25 |
| 36 | 111 | 71 | 63 | 448 | 11 | 128 | 23 |
| 37 | 120 | 77 | 54 | 715 | 9 | 128 | 34 |
| 38 | 109 | 63 | 73 | 885 | 12 | 186 | 72 |
| 39 | 151 | 100 | 70 | 932 | 24 | 286 | 106 |
| 40 | 185 | 83 | 71 | 847 | 38 | 325 | 147 |
| 41 | 211 | 111 | 98 | 849 | 48 | 504 | 243 |
| 42 | 303 | 117 | 111 | 806 | 70 | 717 | 463 |
| 43 | 369 | 150 | 142 | 820 | 132 | 1,071 | 1,133 |
| 44 | 328 | 167 | 149 | 708 | 181 | 1,309 | 2,234 |
Positive influenza (Flu) tests
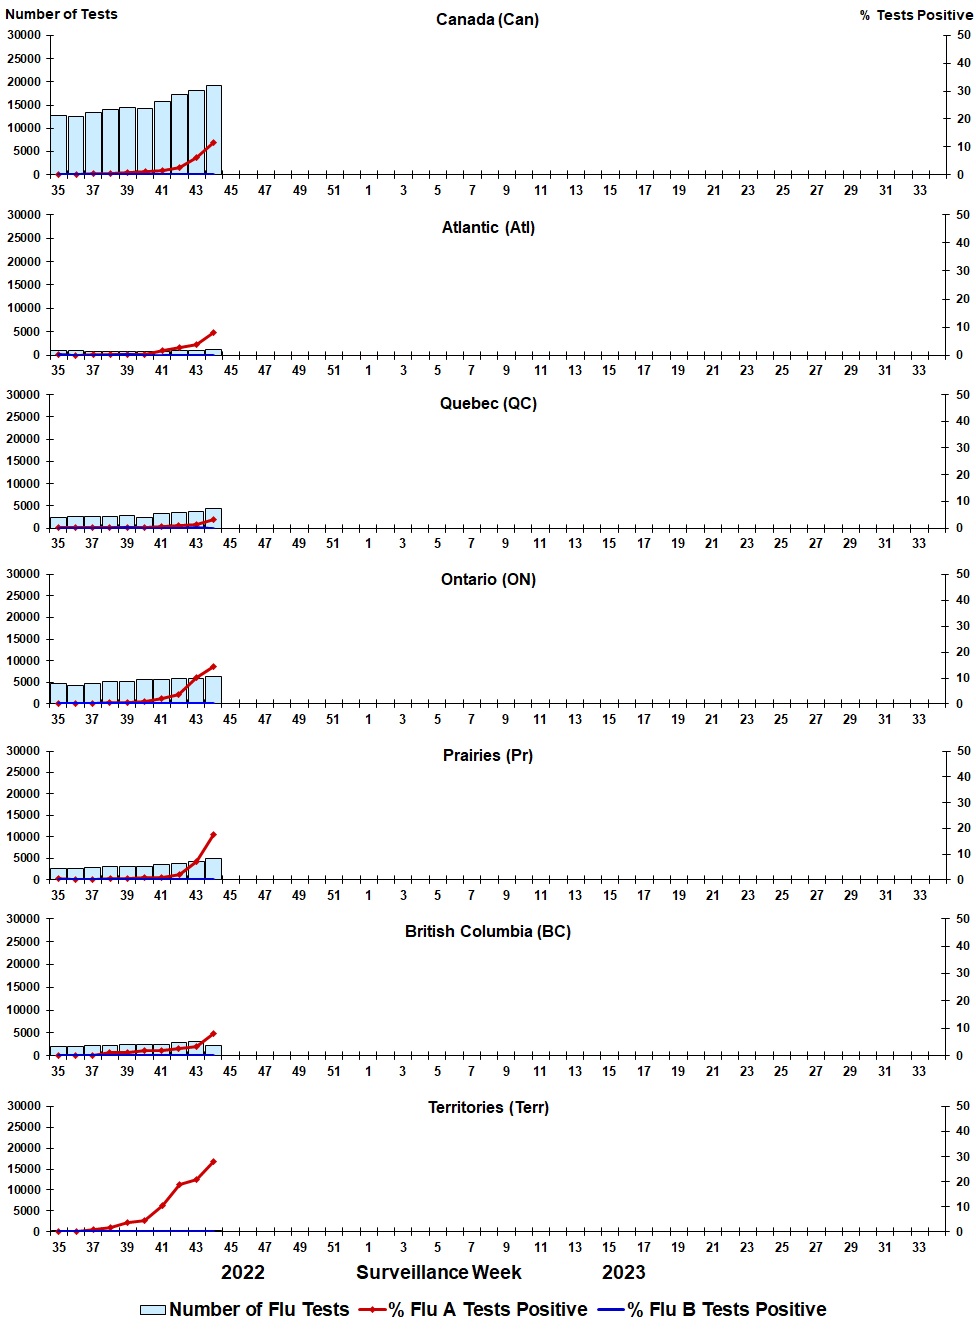
Figure 3: Positive influenza (Flu) tests (%) in Canada by region by surveillance week
| Week | Week end | Can Tests | Can A% | Can B% | Atl Tests | Atl A% | Atl B% | QC Tests | QC A% | QC B% | ON Tests | ON A% | ON B% | Pr Tests | Pr A% | Pr B% | BC Tests | BC A% | BC B% | Terr Tests | Terr A% | Terr B% |
|---|---|---|---|---|---|---|---|---|---|---|---|---|---|---|---|---|---|---|---|---|---|---|
| 35 | 2022-09-03 | 12651 | 0.17 | 0.02 | 932 | 0.11 | 0.11 | 2404 | 0.17 | 0.04 | 4621 | 0.11 | 0.00 | 2573 | 0.31 | 0.04 | 2006 | 0.20 | 0.00 | 115 | 0.00 | 0.00 |
| 36 | 2022-09-10 | 12499 | 0.14 | 0.04 | 906 | 0.00 | 0.00 | 2520 | 0.12 | 0.00 | 4367 | 0.16 | 0.02 | 2565 | 0.16 | 0.08 | 2055 | 0.19 | 0.10 | 86 | 0.00 | 0.00 |
| 37 | 2022-09-17 | 13368 | 0.24 | 0.01 | 854 | 0.12 | 0.00 | 2618 | 0.19 | 0.04 | 4729 | 0.32 | 0.02 | 2798 | 0.18 | 0.00 | 2247 | 0.22 | 0.00 | 122 | 0.82 | 0.00 |
| 38 | 2022-09-24 | 14059 | 0.49 | 0.02 | 788 | 0.13 | 0.00 | 2714 | 0.22 | 0.04 | 5153 | 0.39 | 0.00 | 3044 | 0.43 | 0.03 | 2226 | 1.21 | 0.04 | 134 | 1.49 | 0.00 |
| 39 | 2022-10-01 | 14373 | 0.70 | 0.03 | 688 | 0.29 | 0.15 | 2873 | 0.21 | 0.10 | 5156 | 0.72 | 0.02 | 3132 | 0.64 | 0.00 | 2411 | 1.33 | 0.00 | 113 | 3.54 | 0.00 |
| 40 | 2022-10-08 | 14354 | 1.00 | 0.03 | 818 | 0.24 | 0.00 | 2339 | 0.21 | 0.00 | 5546 | 1.05 | 0.05 | 3080 | 0.88 | 0.03 | 2430 | 1.85 | 0.00 | 141 | 4.26 | 0.00 |
| 41 | 2022-10-15 | 15867 | 1.53 | 0.01 | 776 | 1.68 | 0.00 | 3275 | 0.49 | 0.00 | 5630 | 2.08 | 0.00 | 3520 | 1.02 | 0.03 | 2540 | 1.85 | 0.00 | 126 | 10.32 | 0.00 |
| 42 | 2022-10-22 | 17229 | 2.64 | 0.05 | 1001 | 2.60 | 0.00 | 3608 | 0.86 | 0.03 | 5930 | 3.79 | 0.08 | 3804 | 2.18 | 0.03 | 2774 | 2.45 | 0.07 | 112 | 18.75 | 0.00 |
| 43 | 2022-10-29 | 18037 | 6.25 | 0.03 | 969 | 3.72 | 0.00 | 3823 | 1.41 | 0.08 | 5857 | 10.30 | 0.02 | 4203 | 7.14 | 0.00 | 3026 | 3.34 | 0.07 | 159 | 20.75 | 0.00 |
| 44 | 2022-11-05 | 19153 | 11.65 | 0.02 | 1209 | 8.02 | 0.00 | 4407 | 3.36 | 0.02 | 6332 | 14.45 | 0.03 | 4874 | 17.48 | 0.00 | 2163 | 7.95 | 0.00 | 168 | 27.98 | 0.00 |
Positive respiratory syncytial virus (RSV) tests
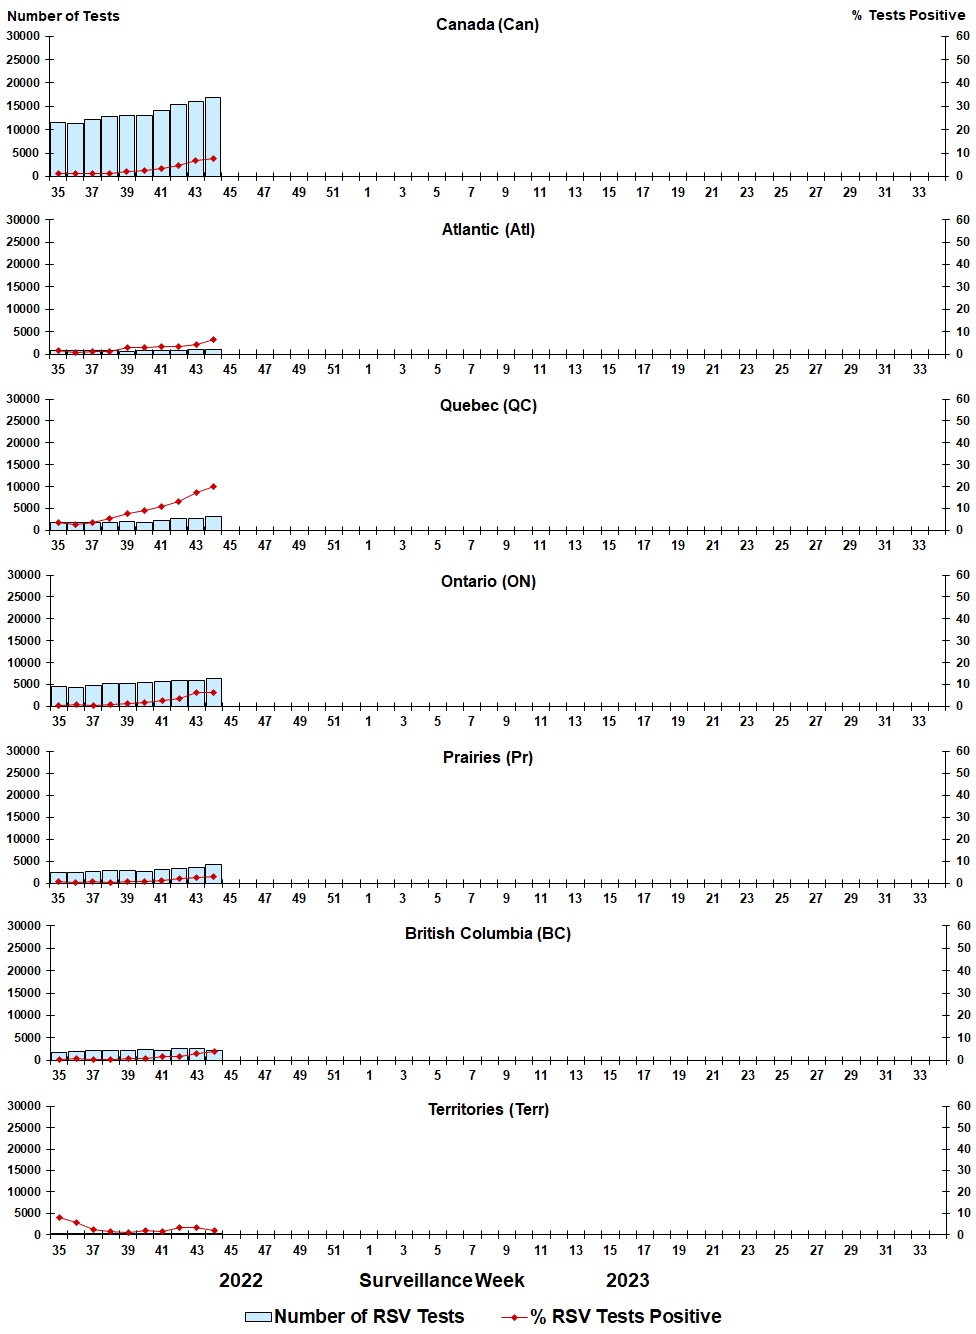
Figure 4: Positive respiratory syncytial virus (RSV) tests (%) in Canada by region by surveillance week
| Week | Week end | Can Tests | RSV% | Atl Tests | RSV% | QC Tests | RSV% | ON Tests | RSV% | Pr Tests | RSV% | BC Tests | RSV% | Terr Tests | RSV% |
|---|---|---|---|---|---|---|---|---|---|---|---|---|---|---|---|
| 35 | 2022-09-03 | 11467 | 1.13 | 832 | 1.44 | 1737 | 3.51 | 4621 | 0.50 | 2367 | 0.68 | 1795 | 0.50 | 115 | 7.83 |
| 36 | 2022-09-10 | 11304 | 1.13 | 785 | 0.64 | 1737 | 2.71 | 4367 | 1.01 | 2414 | 0.54 | 1915 | 0.73 | 86 | 5.81 |
| 37 | 2022-09-17 | 12160 | 1.05 | 721 | 0.97 | 1851 | 3.51 | 4729 | 0.61 | 2610 | 0.61 | 2127 | 0.38 | 122 | 2.46 |
| 38 | 2022-09-24 | 12873 | 1.44 | 707 | 1.13 | 1908 | 5.56 | 5153 | 1.03 | 2821 | 0.35 | 2150 | 0.33 | 134 | 1.49 |
| 39 | 2022-10-01 | 13059 | 2.19 | 556 | 3.06 | 2029 | 7.69 | 5155 | 1.47 | 2894 | 0.73 | 2312 | 0.65 | 113 | 0.88 |
| 40 | 2022-10-08 | 13115 | 2.48 | 677 | 2.95 | 1727 | 8.92 | 5545 | 1.97 | 2706 | 0.63 | 2319 | 0.95 | 141 | 2.13 |
| 41 | 2022-10-15 | 14114 | 3.57 | 695 | 3.45 | 2330 | 11.12 | 5630 | 2.52 | 3049 | 1.38 | 2284 | 1.53 | 126 | 1.59 |
| 42 | 2022-10-22 | 15388 | 4.66 | 799 | 3.38 | 2644 | 13.09 | 5930 | 3.74 | 3352 | 2.21 | 2551 | 1.72 | 112 | 3.57 |
| 43 | 2022-10-29 | 15987 | 6.70 | 929 | 4.20 | 2751 | 17.52 | 5853 | 6.24 | 3615 | 2.68 | 2680 | 3.10 | 159 | 3.14 |
| 44 | 2022-11-05 | 16856 | 7.77 | 964 | 6.64 | 3073 | 20.08 | 6332 | 6.43 | 4156 | 3.25 | 2163 | 3.84 | 168 | 1.79 |
Positive human parainfluenza virus (HPIV) tests
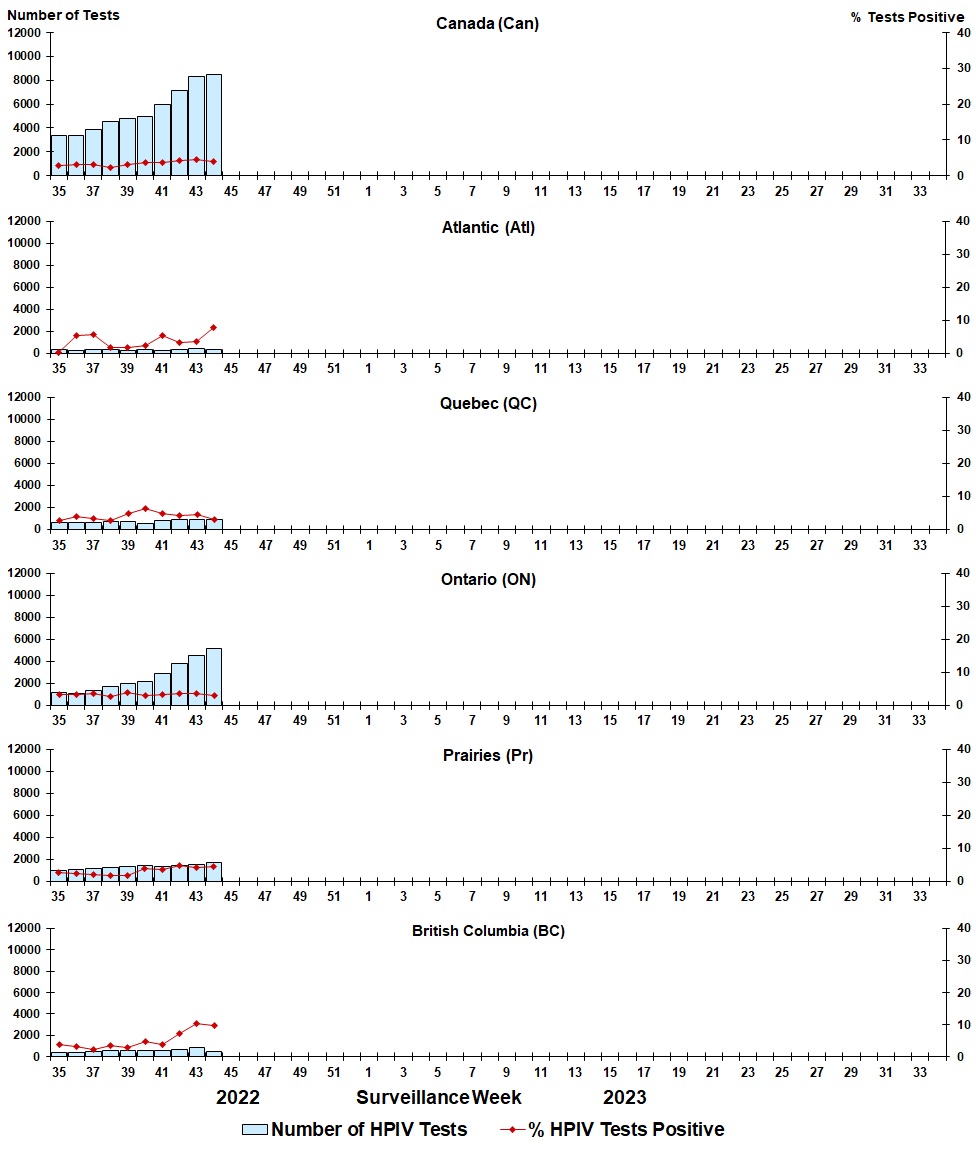
Figure 5: Positive human parainfluenza virus (HPIV) tests (%) in Canada by region by surveillance week
| Week | Week End | Can Tests | HPIV% | Atl Tests | HPIV% | QC Tests | HPIV% | ON Tests | HPIV% | Pr Tests | HPIV% | BC Tests | HPIV% |
|---|---|---|---|---|---|---|---|---|---|---|---|---|---|
| 35 | 2022-09-03 | 3393 | 2.83 | 294 | 0.34 | 619 | 2.75 | 1111 | 3.33 | 967 | 2.69 | 402 | 3.73 |
| 36 | 2022-09-10 | 3410 | 3.26 | 280 | 5.36 | 646 | 3.87 | 1037 | 3.09 | 1025 | 2.44 | 422 | 3.32 |
| 37 | 2022-09-17 | 3905 | 3.07 | 301 | 5.65 | 661 | 3.33 | 1300 | 3.54 | 1112 | 2.07 | 530 | 2.26 |
| 38 | 2022-09-24 | 4521 | 2.41 | 334 | 1.80 | 717 | 2.65 | 1649 | 2.61 | 1274 | 1.73 | 547 | 3.47 |
| 39 | 2022-10-01 | 4818 | 3.13 | 286 | 1.75 | 728 | 4.81 | 1939 | 3.71 | 1327 | 1.81 | 538 | 2.79 |
| 40 | 2022-10-08 | 4971 | 3.72 | 298 | 2.35 | 578 | 6.40 | 2143 | 2.94 | 1385 | 3.68 | 567 | 4.76 |
| 41 | 2022-10-15 | 5931 | 3.56 | 265 | 5.28 | 851 | 4.70 | 2893 | 3.11 | 1323 | 3.40 | 599 | 3.67 |
| 42 | 2022-10-22 | 7155 | 4.23 | 354 | 3.39 | 904 | 4.09 | 3770 | 3.58 | 1420 | 4.72 | 707 | 7.36 |
| 43 | 2022-10-29 | 8325 | 4.43 | 441 | 3.40 | 944 | 4.45 | 4548 | 3.52 | 1552 | 4.25 | 839 | 10.25 |
| 44 | 2022-11-05 | 8521 | 3.85 | 362 | 7.73 | 937 | 2.99 | 5108 | 2.98 | 1651 | 4.54 | 463 | 9.72 |
Positive adenovirus (ADV) tests
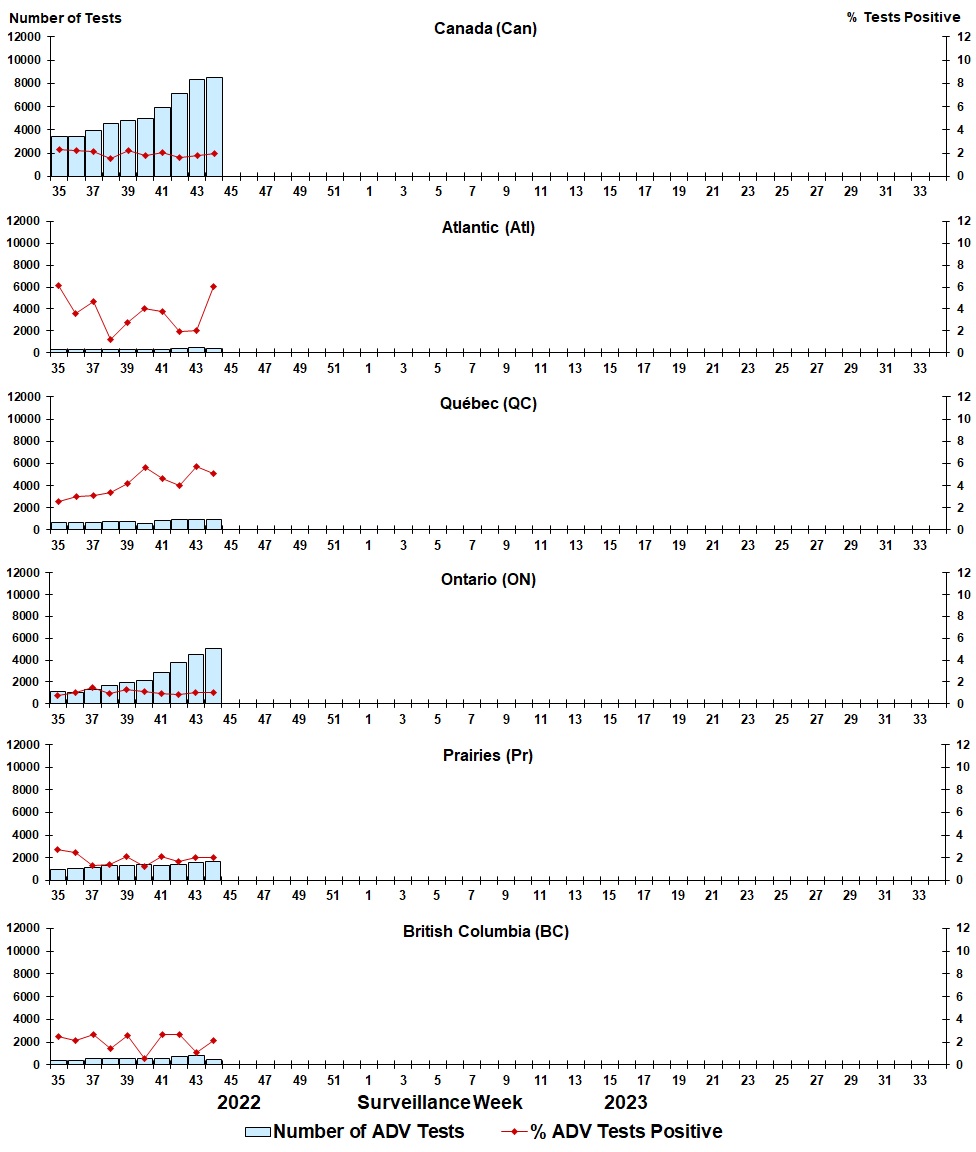
Figure 6: Positive adenovirus (ADV) tests (%) in Canada by region by surveillance week
| Week | Week End | Can Tests | ADV% | Atl Tests | ADV% | QC Tests | ADV% | ON Tests | ADV% | Pr Tests | ADV% | BC Tests | ADV% |
|---|---|---|---|---|---|---|---|---|---|---|---|---|---|
| 35 | 2022-09-03 | 3432 | 2.24 | 294 | 6.12 | 632 | 2.53 | 1139 | 0.61 | 965 | 2.69 | 402 | 2.49 |
| 36 | 2022-09-10 | 3434 | 2.07 | 280 | 3.57 | 659 | 3.03 | 1045 | 0.67 | 1028 | 2.43 | 422 | 2.13 |
| 37 | 2022-09-17 | 3924 | 1.96 | 301 | 4.65 | 680 | 3.09 | 1301 | 1.00 | 1111 | 1.35 | 530 | 2.64 |
| 38 | 2022-09-24 | 4536 | 1.39 | 334 | 1.20 | 731 | 3.42 | 1649 | 0.49 | 1275 | 1.41 | 547 | 1.46 |
| 39 | 2022-10-01 | 4834 | 2.07 | 286 | 2.80 | 742 | 4.18 | 1941 | 0.98 | 1327 | 2.11 | 538 | 2.60 |
| 40 | 2022-10-08 | 4980 | 1.67 | 298 | 4.03 | 581 | 5.68 | 2149 | 0.84 | 1385 | 1.23 | 567 | 0.53 |
| 41 | 2022-10-15 | 5946 | 1.87 | 265 | 3.77 | 864 | 4.63 | 2895 | 0.59 | 1323 | 2.12 | 599 | 2.67 |
| 42 | 2022-10-22 | 7166 | 1.63 | 354 | 1.98 | 915 | 4.04 | 3770 | 0.80 | 1420 | 1.69 | 707 | 2.69 |
| 43 | 2022-10-29 | 8337 | 1.80 | 441 | 2.04 | 955 | 5.76 | 4549 | 1.01 | 1552 | 2.00 | 839 | 1.07 |
| 44 | 2022-11-05 | 8533 | 1.96 | 362 | 6.08 | 949 | 5.06 | 5108 | 1.06 | 1651 | 2.00 | 463 | 2.16 |
Positive human metapneumovirus (HMPV) tests
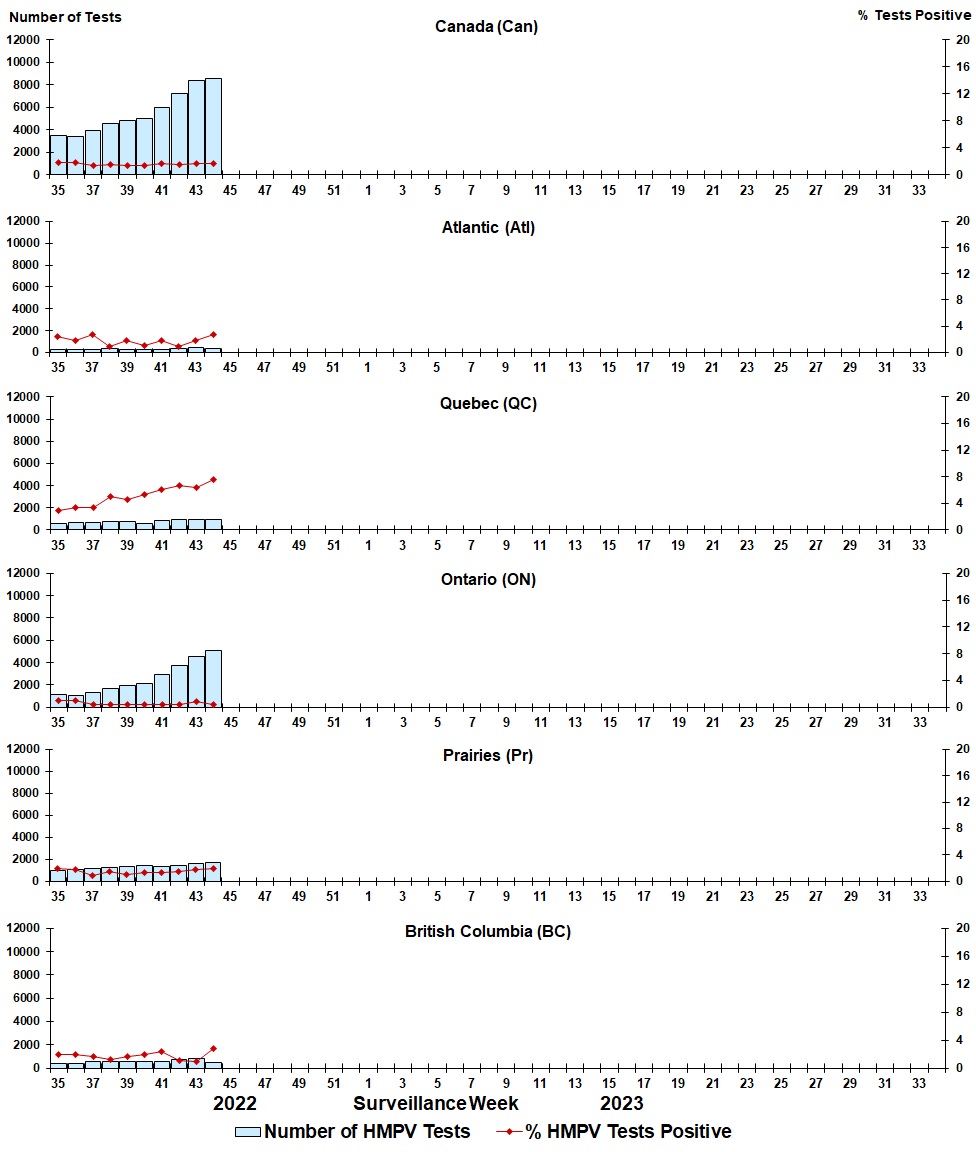
Figure 7: Positive human metapneumovirus (HMPV) tests (%) in Canada by region by surveillance week
| Week | Week End | Can Tests | HMPV% | Atl Tests | HMPV% | QC Tests | HMPV% | ON Tests | HMPV% | Pr Tests | HMPV% | BC Tests | HMPV% |
|---|---|---|---|---|---|---|---|---|---|---|---|---|---|
| 35 | 2022-09-03 | 3452 | 1.83 | 294 | 2.38 | 619 | 2.91 | 1139 | 0.97 | 998 | 1.90 | 402 | 1.99 |
| 36 | 2022-09-10 | 3445 | 1.83 | 280 | 1.79 | 649 | 3.39 | 1045 | 0.96 | 1049 | 1.72 | 422 | 1.90 |
| 37 | 2022-09-17 | 3925 | 1.38 | 301 | 2.66 | 666 | 3.30 | 1300 | 0.46 | 1127 | 0.80 | 530 | 1.70 |
| 38 | 2022-09-24 | 4535 | 1.61 | 334 | 0.90 | 723 | 4.98 | 1646 | 0.49 | 1285 | 1.48 | 547 | 1.28 |
| 39 | 2022-10-01 | 4835 | 1.45 | 286 | 1.75 | 729 | 4.53 | 1941 | 0.46 | 1341 | 1.04 | 538 | 1.67 |
| 40 | 2022-10-08 | 5010 | 1.42 | 298 | 1.01 | 581 | 5.34 | 2151 | 0.37 | 1413 | 1.27 | 567 | 1.94 |
| 41 | 2022-10-15 | 5960 | 1.64 | 265 | 1.89 | 857 | 6.07 | 2895 | 0.35 | 1344 | 1.26 | 599 | 2.34 |
| 42 | 2022-10-22 | 7188 | 1.54 | 354 | 0.85 | 911 | 6.70 | 3776 | 0.45 | 1440 | 1.53 | 707 | 1.13 |
| 43 | 2022-10-29 | 8366 | 1.70 | 441 | 1.81 | 960 | 6.35 | 4549 | 0.81 | 1576 | 1.78 | 839 | 0.95 |
| 44 | 2022-11-05 | 8558 | 1.74 | 362 | 2.76 | 941 | 7.65 | 5110 | 0.41 | 1682 | 1.96 | 463 | 2.81 |
Positive enterovirus/rhinovirus (EV/RV) tests
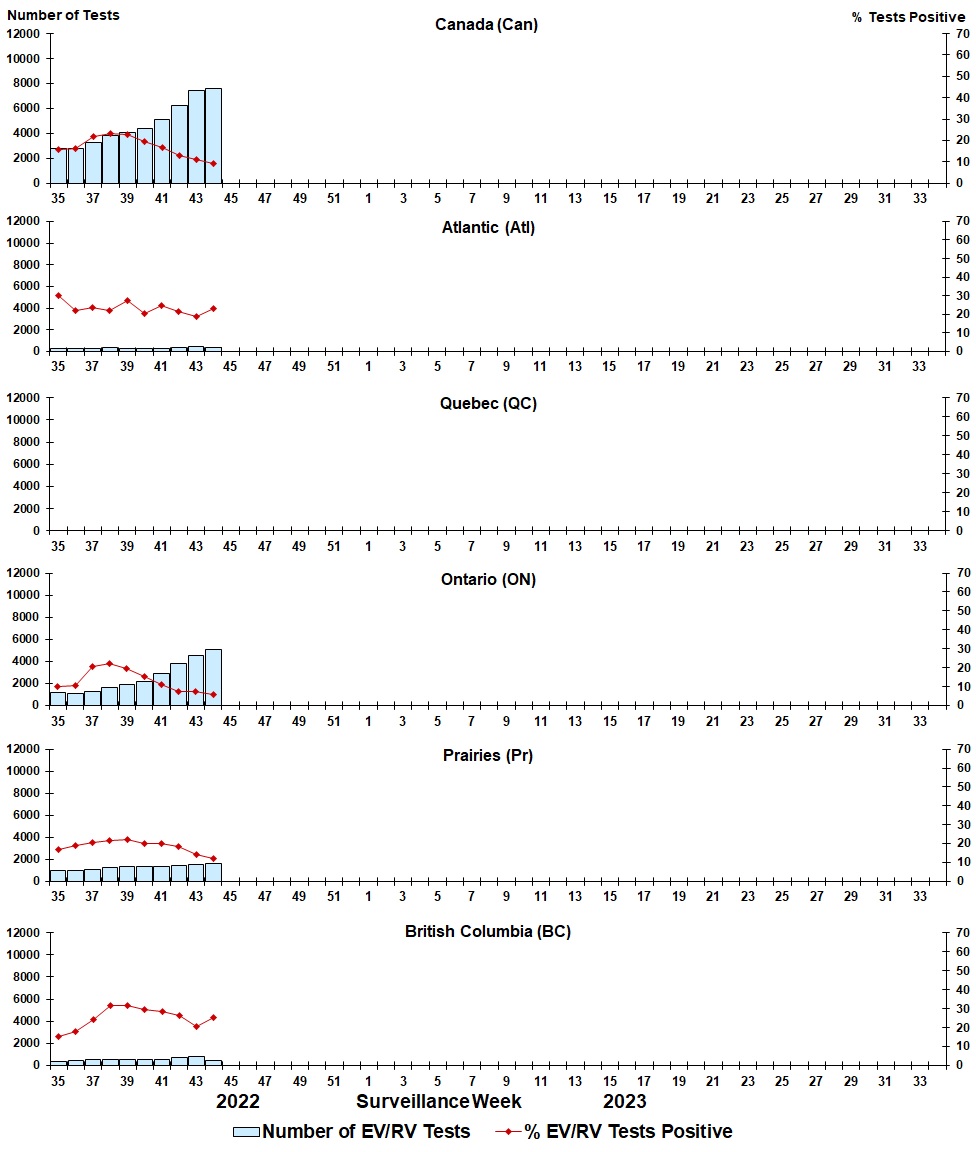
Figure 8: Positive enterovirus/rhinovirus (EV/RV) tests (%) in Canada by region by surveillance week
| Week | Week End | Can Tests | EV/RV% | Atl Tests | EV/RV% | QC Tests | EV/RV% | ON Tests | EV/RV% | Pr Tests | EV/RV% | BC Tests | EV/RV% |
|---|---|---|---|---|---|---|---|---|---|---|---|---|---|
| 35 | 2022-09-03 | 2805 | 15.54 | 294 | 30.27 | - | - | 1139 | 10.18 | 947 | 16.79 | 394 | 15.48 |
| 36 | 2022-09-10 | 2773 | 16.16 | 280 | 21.79 | - | - | 1045 | 10.81 | 1013 | 18.76 | 417 | 17.99 |
| 37 | 2022-09-17 | 3269 | 21.87 | 301 | 23.59 | - | - | 1300 | 20.38 | 1101 | 20.62 | 522 | 24.33 |
| 38 | 2022-09-24 | 3779 | 23.42 | 334 | 22.16 | - | - | 1621 | 21.96 | 1255 | 21.59 | 538 | 31.78 |
| 39 | 2022-10-01 | 4089 | 22.79 | 286 | 27.62 | - | - | 1941 | 19.68 | 1309 | 22.23 | 521 | 31.67 |
| 40 | 2022-10-08 | 4402 | 19.24 | 298 | 20.47 | - | - | 2150 | 15.58 | 1364 | 19.79 | 546 | 29.67 |
| 41 | 2022-10-15 | 5094 | 16.67 | 265 | 24.91 | - | - | 2896 | 11.33 | 1305 | 20.15 | 579 | 28.67 |
| 42 | 2022-10-22 | 6243 | 12.91 | 354 | 21.47 | - | - | 3774 | 7.58 | 1389 | 18.14 | 678 | 26.40 |
| 43 | 2022-10-29 | 7393 | 11.09 | 441 | 19.05 | - | - | 4549 | 7.34 | 1535 | 14.14 | 814 | 20.64 |
| 44 | 2022-11-05 | 7609 | 9.30 | 362 | 23.20 | - | - | 5110 | 5.95 | 1632 | 11.83 | 463 | 25.27 |
Positive human coronavirus (HCoV) tests
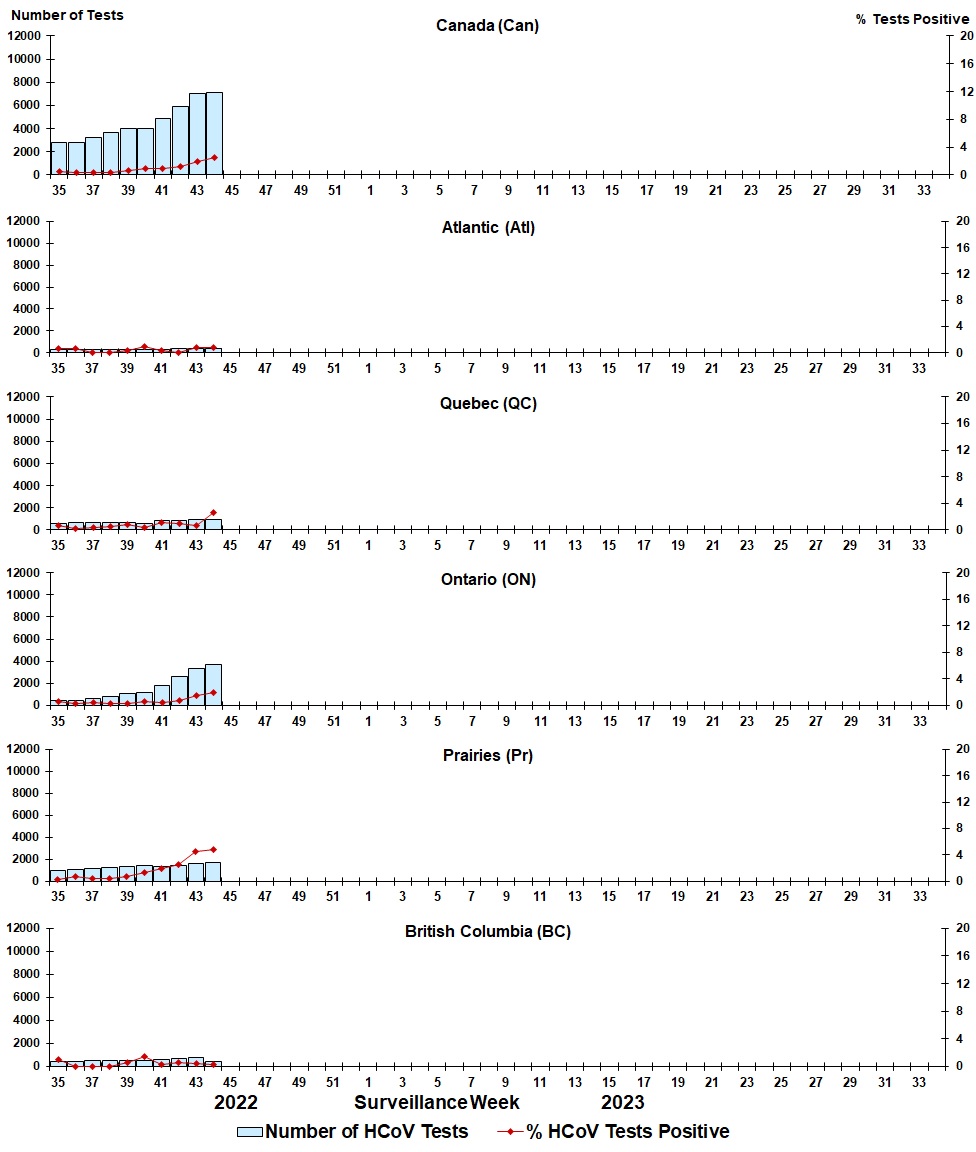
Figure 9: Positive human coronavirus (HCoV) tests (%) in Canada by region by surveillance week
| Week | Week End | Can Tests | HCoV% | Atl Tests | HCoV% | QC Tests | HCoV% | ON Tests | HCoV% | Pr Tests | HCoV% | BC Tests | HCoV% |
|---|---|---|---|---|---|---|---|---|---|---|---|---|---|
| 35 | 2022-09-03 | 2778 | 0.54 | 294 | 0.68 | 610 | 0.66 | 483 | 0.62 | 997 | 0.20 | 394 | 1.02 |
| 36 | 2022-09-10 | 2833 | 0.39 | 280 | 0.71 | 639 | 0.16 | 451 | 0.22 | 1046 | 0.67 | 417 | 0.00 |
| 37 | 2022-09-17 | 3197 | 0.28 | 301 | 0.00 | 655 | 0.31 | 590 | 0.51 | 1128 | 0.35 | 522 | 0.00 |
| 38 | 2022-09-24 | 3648 | 0.33 | 334 | 0.00 | 705 | 0.57 | 785 | 0.25 | 1286 | 0.47 | 538 | 0.00 |
| 39 | 2022-10-01 | 3974 | 0.60 | 286 | 0.35 | 716 | 0.84 | 1110 | 0.36 | 1341 | 0.75 | 521 | 0.58 |
| 40 | 2022-10-08 | 3993 | 0.95 | 298 | 1.01 | 568 | 0.35 | 1168 | 0.60 | 1413 | 1.27 | 546 | 1.47 |
| 41 | 2022-10-15 | 4855 | 0.99 | 265 | 0.38 | 842 | 1.07 | 1822 | 0.49 | 1347 | 2.00 | 579 | 0.35 |
| 42 | 2022-10-22 | 5937 | 1.18 | 354 | 0.00 | 884 | 1.02 | 2582 | 0.81 | 1439 | 2.50 | 678 | 0.59 |
| 43 | 2022-10-29 | 7071 | 1.87 | 386 | 0.78 | 922 | 0.65 | 3368 | 1.45 | 1580 | 4.49 | 814 | 0.37 |
| 44 | 2022-11-05 | 7079 | 2.56 | 362 | 0.83 | 906 | 2.65 | 3665 | 1.96 | 1683 | 4.81 | 463 | 0.22 |