
Note for President's visit with Stephen Lucas
Introduction
Deputy Head
Mr. Stephen Lucas was appointed as the Deputy Head (DH) of Health Canada (HC) on September 3, 2019.
Mr. Stephen Lucas has previously exercised the Public Service Commission’s (PSC) authority as Deputy Head. A copy of the New Direction in Staffing (NDS) highlights for DHs is attached as Annex A.
Organizational Context
Mandate
HC is responsible for helping Canadians maintain and improve their health. It ensures that high-quality health services are accessible, and works to reduce health risks.
The organization is responsible for regulating areas such as drugs and health products, food products, environmental and workplace health. It also promotes healthy living, ensures consumer products safety, and conducts researches and testing.
In the fall 2017, the Government created Indigenous Services Canada, a new department with the primary mandate of improving the quality of services delivered to First Nations, Inuit, and Métis peoples. This resulted in the transfer, to the new Department, of the HC First Nations and Inuit Health Branch as well as internal corporate resources.
HC and the Public Health Agency of Canada share the same Human Resources (HR) services.
Challenges
HC anticipates an increase of staffing and recruitment activities in fiscal years 2019-2020 and 2020-2021, due to a funding level increase for improving the accessibility, affordability and appropriate use of prescription drugs and medical devices. They wish to attract, retain and develop a talented, diverse and representative workforce, and are competing with the scientific and medical industries for the same pool of candidates.
To address this challenge, they will continue to modernize recruitment and workplace practices in support of greater efficiency. As such, HC will focus on succession planning and will continue ensuring available pools of candidates for:
- Administrative positions (AS-CR) for which they have numerous positions and frequent movements; and
- Highly specialized positions (MD, NU, CH) that are difficult to attract.
In the recruitment of these professionals, obtaining timely confirmation of bilingualism and recognition of foreign education credentials has been a challenge.
HC will continue to experiment with recruitment strategies in an attempt to have a more timely and efficient staffing system.
Experimentation
HC has successfully experienced group interviews in 2018 in their offices on the East Coast, and said they could use this practice in the future for their appointment processes.
HC is working on making their talent management and performance appraisal practices more compatible for use in staffing processes, as valuable information to assess merit.
HC is conducting a pilot project called “Growth Approach” (Grandir) that consist of not eliminating the candidates that don’t meet one or more merit criteria. Unsuccessful candidates are simply kept in a partially assessed pool until such time as they can demonstrate to an assessment board that they have acquired the competency that they previously missed. The results are then used to help guide training and development plans for employees. This approach leverages multiple assessment resources (performance review, work sample, etc.) and facilitates the alignment with talent management of employees.
For the hiring of doctors (MD group), HC has adapted their advertisement approach. They now simply ask candidates to submit their résumé, and the hiring manager contact them to ask for any pertinent additional information. This simplified application process, combined with customized outreach strategies using social media and other forums, has increased the number of candidates for the MD group. The approach was a success as it is now recruiting more candidates than with the former traditional methods.
Population and Staffing Activities
Population
HC is a large organization that has a population of 10,850 employees, as of March 31, 2019.
Staffing Activities
In 2018–2019, HC processed a total of 6,359 staffing actions:
- 2,783 appointments to the public service (these include casuals and students);
- 1,356 promotions;
- 797 acting appointments; and
- 1,423 lateral and downward movements
Tenure of appointments:
- 4,068 indeterminates;
- 809 terms;
- 804 casuals, and
- 678 students.
Please refer to Annex B for additional details on staffing activities.
Time to Staff
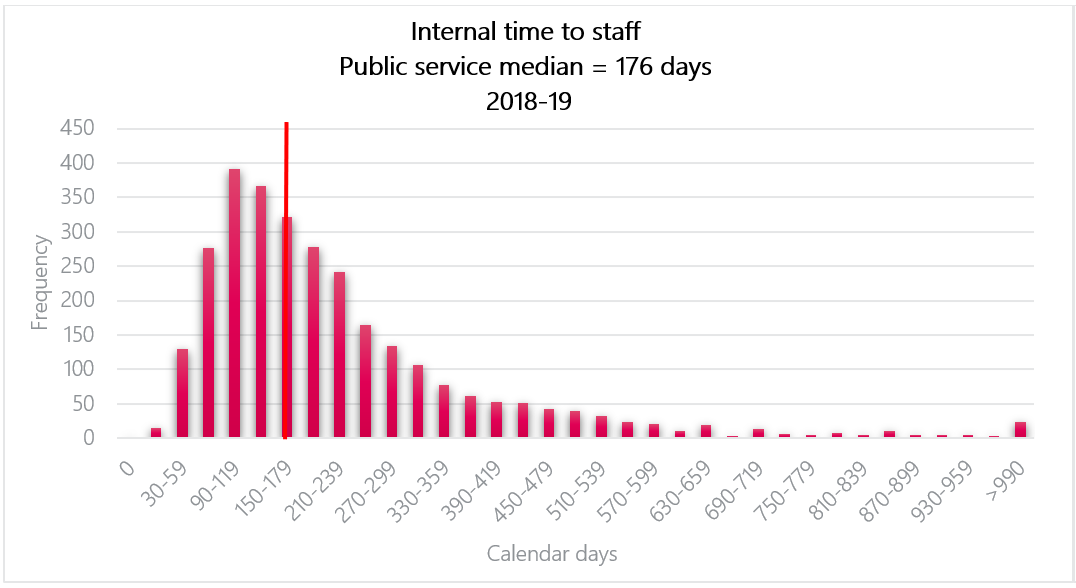
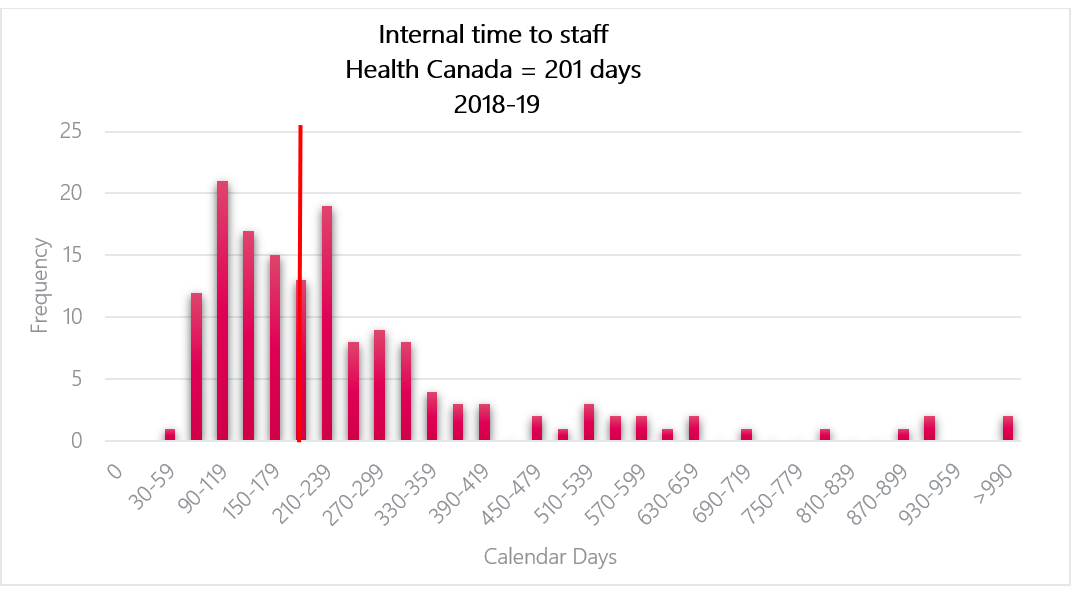
HC has a median time of 201 days for internal appointments, which is higher than the median of the public service, which is 176 days.
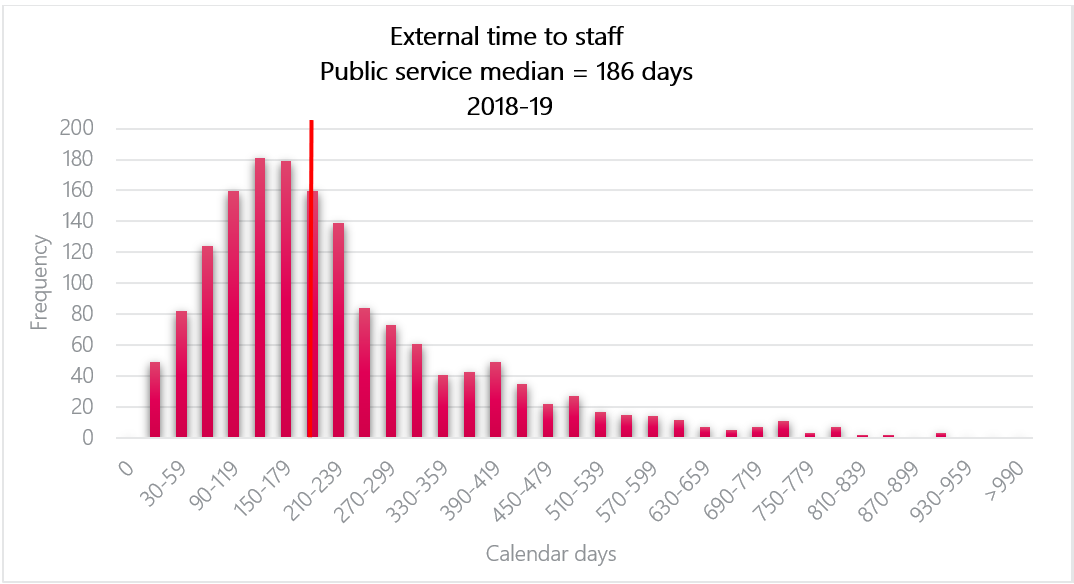
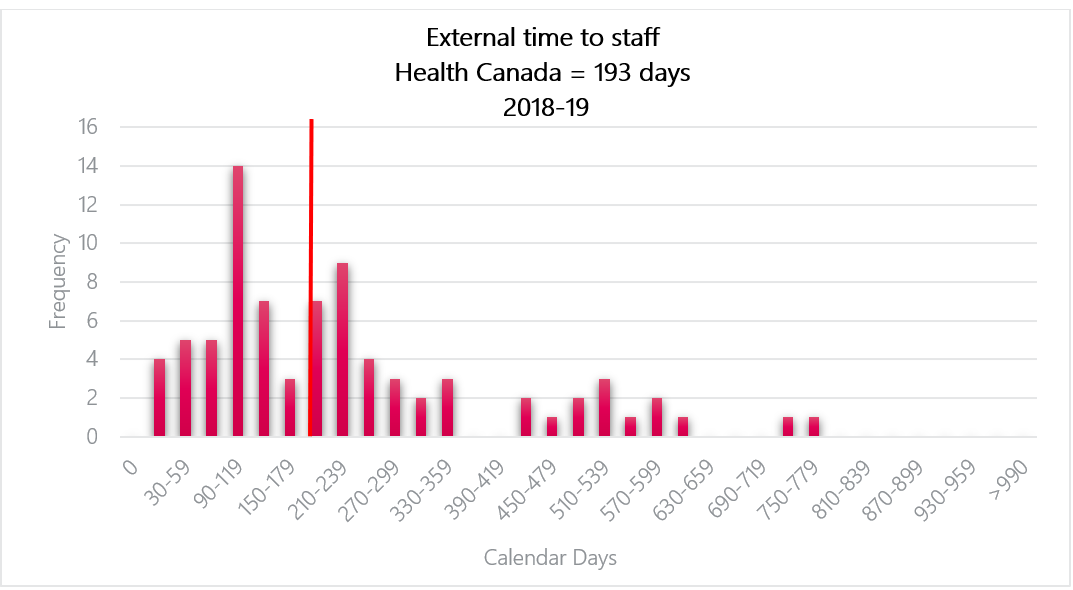
HC has a median time of 193 days for external appointments, which is higher than the median of the public service, which is 186 days.
As part of the HR to Pay Timeliness initiative, HC put in place various tools and processes to help improve the overall staffing timeliness.
Staffing Framework
New Direction in Staffing Implementation
In February 2019, at the request of the organization, the Public Service Commission (PSC) re-examined HC sub-delegation instruments. HC updated their staffing framework (Policy on Area of Selection, guidance for the use of advertised and non-advertised appointments, articulation of selection decision and sub-delegation instrument) further to observations stemming from this review. The updated framework has since been approved by the DH.
Appointment Delegation and Accountability Instrument Annex D Reporting
Use of the Public Service Official Languages Exclusion Approval Order and the Public Service Official Languages Appointment Regulations
HC reported that the organization made no use of the Public Service Official Languages Exclusion Approval Order.
They reported two active cases under the Public Service Official Languages Appointment Regulations for the period of April 1, 2018, and March 31, 2019. Both individuals have since successfully completed their training. The organization does not have any outstanding cases.
Approved Deputy Head Exceptions to the National Area of Selection Requirements for External Advertised Appointment Process
HC did not report any exception to the National Area of Selection approved by their DH.
Results of Organizational Cyclical Assessment
HC confirmed that they will submit their cyclical Assessment by May 2021. They are hoping to provide a preliminary report to see if the PSC would have any advice to provide prior to submitting the final report.
Inquiries and Trends
The majority (16.1%) of inquiries from HC are related to the assessment in the appointment process. Other noteworthy areas of inquiries include clarification on sections of the Public Service Employment Act, guidance on the Office of the Chief Human Resources Officer people management policies, staffing values and student hiring. This spread of inquiries is similar to activities from comparable organizations.
HC is doing regular monitoring of their staffing system. They are using this information to support their cyclical review report.
Oversight
Audit
HC was included in the completed System-Wide Staffing Audit, for which the final report was published in December 2018. The organization was also one of the 15 organizations covered by the Horizontal Audit on Credential Validation. The final report for this audit was published on May 29, 2019
Investigations
Between August 26, 2016, and August 25, 2019, the PSC received 22 requests for investigations on staffing actions at HC, 14 on external appointments and 8 on potential frauds. At the beginning of that period, the PSC also had 4 cases carried over from the previous year.
- 2 cases were referred by the organization (one on external processes and one on potential fraud);
- 15 cases were closed or not accepted (thirteen on external processes and two on potential fraud);
- 3 cases on potential fraud were unfounded;
- 3 cases on potential fraud were founded; and
- 3 cases are ongoing (one on external process and one on potential fraud).
Nature of Issue |
Cases Received |
Cases Referred by Organization |
Closed—Not Accepted |
Completed Unfounded |
Completed Founded |
Ongoing |
|---|---|---|---|---|---|---|
s.66 External Appointments (Merit, Error, Omission, Improper Conduct) |
14 |
1 |
13 |
0 |
0 |
1 |
s.69 Fraud |
8 |
1 |
2 |
3 |
3 |
2 |
Total |
22 |
2 |
15 |
3 |
3 |
3 |
Note: The numbers may not add up as discontinued cases, cases resolved via early intervention and rare cases are not included in this table.
Staffing and Non-Partisanship Survey Results
Below are key findings from Health Canada’s 2018 Staffing and Non-Partisanship Survey results:
- 58.0% of employees agreed that people hired can do the job, compared to 52.3% in organizations of similar size, and 53.8% in the federal public service;
- 62.7% of managers agreed that the New Direction in Staffing (NDS) has improved the way they hire and appoint persons to and within their organization, compared to 54.4% in organizations of similar size, and 56.1% in the federal public service;
- 77.7% of managers indicated that they understand the NDS, as compared to 60.1% in similar size organizations and 61.4% across all organizations in the federal public service;
- 60% of managers feel staffing is not quick enough, as compared to 64.5% in similar size organizations and 62.4% across all organizations in the federal public service; and
- 88.8% of managers agreed that within their organization, the administrative process to staff a position is burdensome, compared to 88.6% in organizations of similar size, and 87.9% in the federal public service.
Diversity Profile
The workforce availability estimates in the public service for 2019 have been updated in the Diversity Profile although new estimates for organizations will only be released in the coming month. Using data from 2017-2018, HC exceeds the workforce availability for women, visible minorities and aboriginal peoples designated groups, and is lower than the workforce availability for persons with disabilities. However, these findings will be revised when new estimates are released later this month.
Designated Group |
Public Service |
Health Canada |
Representation across the |
|---|---|---|---|
Women |
52.5% |
66.7% |
54.8% |
Aboriginal Peoples |
4% |
7.6% |
5.1% |
Persons with Disabilities |
9% |
5.4% |
5.3% |
Members of Visible Minorities |
15.3% |
22.6% |
15.7% |
Source: Employment Equity in the Public Service of Canada 2017– 2018 Treasury Board of Canada Secretariat
Priority Entitlements and Veterans
From April 1, 2018, to August 26, 2019, HC appointed 24 persons with a priority entitlement (PPE) indeterminately. Of these appointments 10 were their own PPEs and 14 were from other organizations
HC had 41 PPEs activated in Priority Information Management System as of August 26, 2019:
- 31 have the Leave of Absence entitlement;
- 9 have a relocation of spouse entitlement; and
- 1 has a reinstatement entitlement.
Since the coming into force of the Veterans Hiring Act, HC has made 13 appointments of persons with a Canadian Armed Forces Priority Entitlement (6 statutory and 7 regulatory), between July 1, 2015, and July 31, 2019.
Period |
attributable to service (statutory) |
not attributable to service (regulatory) |
total |
|---|---|---|---|
2015 (July 1) - 2016 |
2 |
1 |
3 |
2016 - 2017 |
2 |
3 |
5 |
2017 - 2018 |
1 |
3 |
4 |
2018–2019 |
1 |
0 |
1 |
Total |
6 |
7 |
13 |
Source: PSC Priority Information Management System
Non-Partisanship in the Public Service
The HC Designated Political Activities Representative is Candice Lidstone.
Since April 2015, the PSC has received six requests for permission to be a candidate in an election from HC employees: one federal and five municipal. Currently, one employee received permission and is running in the 2019 federal election; two (2) HC employees are part-time elected municipal officials.
The 2018 Staffing and Non-partisanship Survey results indicate that HC employees' level of awareness regarding their rights and responsibilities for engaging in political activities is 76.5%, which is lower than the 80.1% for the public service as a whole.
Public Service Commission Initiatives
The organization participated in the following PSC-led initiative:
- Position-Specific Assessment for Oral Proficiency at the B Level.
Staffing Support
Public Service Commission Representatives and Organizational Contacts
The Staffing Support Advisor assigned to this organization is Yannick Fortin. The Head of HR is Daryl Gauthier, Director General, Human Resources Services Directorate and the primary organizational contact is Tammy Kardoes, Director, Staffing and Classification Policy Center.
HC and the PSC work in close collaboration with regards to staffing policies, practices and activities. The organization is very active and volunteers regularly for PSC led initiatives and consultation, such as the study on Performance Reviews in the Appointment Process.
Prepared by:
Yannick Fortin
Staffing Support Advisor
Annexes:
- Annex A – A New Direction in Staffing, highlights for deputy heads Placemat
- Annex B - Data on Population and Staffing Activities
New direction in Staffing – A merit-based system that is effective, efficient and fair
Appointment Policy
New focus on core requirements to provide sub-delegated persons greater discretion in making an appointment
- One Appointment Policy, no duplication with legal requirements
- Broader focus on values-based system, away from rules-based system
- Appointments Policy supported by streamlined guidance:
- A roadmap to the requirements in legislation, regulations and policy
- Options and considerations for decision-making where there is discretion
- Clear expectations for priority entitlements
- No restrictions to assessment methods for EX appointments
- Exceptions to National Area of Selection approved by deputy head
Delegation
- New ability to customize organizational staffing system based on unique context and evolving business needs
- Deputy head establish a direction on the use of advertised and non-advertised appointment processes
- Deputy heads to establish requirement(s) for sub-delegated persons to articulate, in writing, their selection decision
- Clarity on requirements related to investigations
- Attestation form to reinforce the accountabilities of sub-delegated persons
All PSC monitoring and reporting requirements now found in the Appointment Delegation and Accountability Instrument
Monitoring and Reporting
Monitoring built by organizations, targeted to their needs
- Annual Departmental Staffing Accountability Report no longer required
- Annual reporting to the PSC limited to:
- Use of Public Service Official Language Exclusion Approval Order
- Exceptions to the National Area of Selection approved by the deputy head
- Results of any internal investigations
- Actions taken following any PSC investigations or audits.
- Deputy head responsible for ongoing monitoring of organizational staffing system based on the organization’s unique context
- Assessment of adherence to requirements, based on organization’s own risks, at the minimum every five years
PSC Oversight
System wide-focus
- Government-wide compliance audit every two years
- Renewed Survey of Staffing administered in alternating years with government-wide audit
- System-wide effectiveness and efficiency reviews to support continuous improvement
- Targeted PSC audits as a result of identified system-wide or organizational risks or at the deputy head request
- Investigations conducted when there is a reason to believe there was political influence, fraud or improper conduct in an appointment process
This document should be read in conjunction with the Public Service Employment Act, the Public Service Employment Regulations, the PSC Appointment Policy and the PSC Appointment Delegation and Accountability Instrument.
Annex B
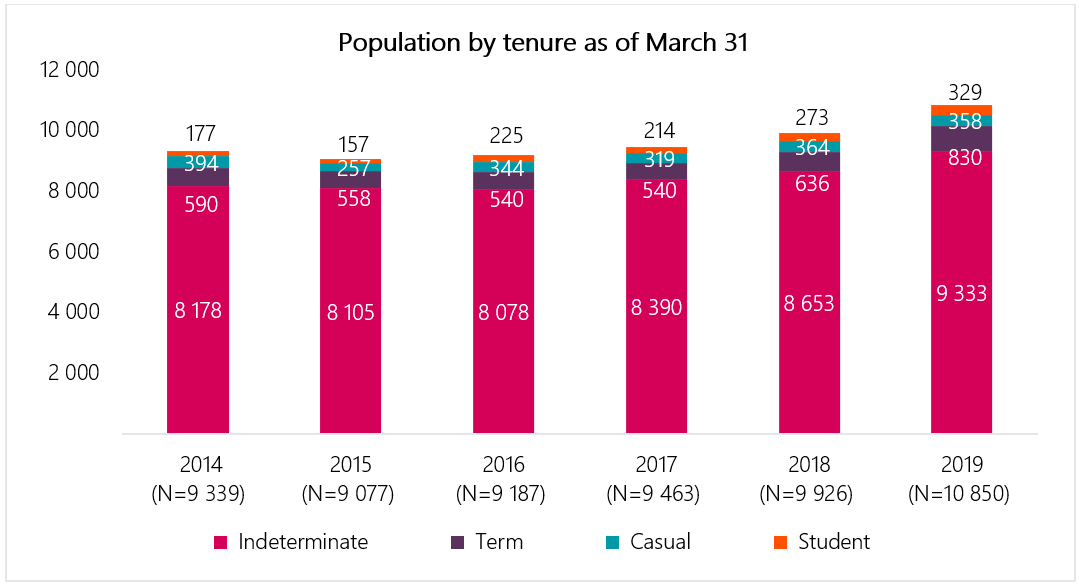
Text version
Year |
Indeterminate population |
Term population |
Casual population |
Student population |
Total population |
|---|---|---|---|---|---|
As of March 31, 2014 |
8 178 |
590 |
394 |
177 |
9 339 |
As of March 31, 2015 |
8 105 |
558 |
257 |
157 |
9 077 |
As of March 31, 2016 |
8 078 |
540 |
344 |
225 |
9 187 |
As of March 31, 2017 |
8 390 |
540 |
319 |
214 |
9 463 |
As of March 31, 2018 |
8 653 |
636 |
364 |
273 |
9 926 |
As of March 31, 2019 |
9 333 |
830 |
358 |
329 |
10 850 |
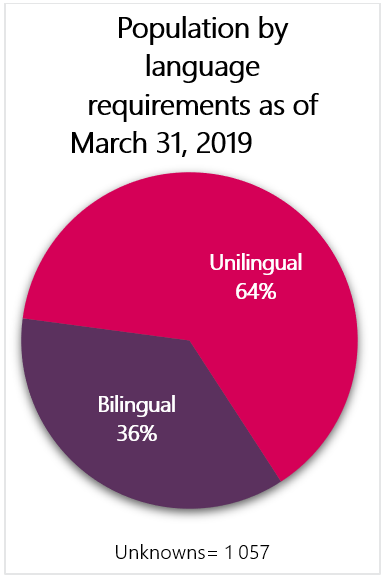
Text version
Linguistic requirements of the position |
Population as of March 31, 2019 |
Percentage of population as of March 31, 2019 |
|---|---|---|
Bilingual |
3552 |
36% |
Unilingual |
6 241 |
64% |
Unknown |
1 057 |
|

Text version
Occupational group |
Population as of March 31, 2019 |
Percentage of population as of March 31, 2019 |
|---|---|---|
AS – Administrative Services |
1 669 |
16% |
EC – Economics and Social Science Services |
1 274 |
12% |
SG – Scientific Regulation |
1 130 |
11% |
BI – Biological Sciences |
1 113 |
11% |
CR – Clerical and Regulatory |
1 023 |
10% |
Other |
4 312 |
41% |
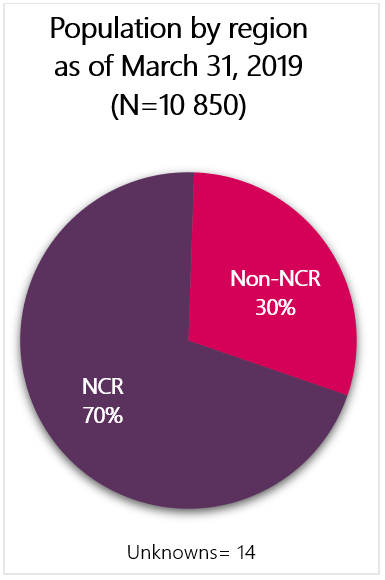
Text version
Region |
Population as of March 31, 2019 |
Percentage of population as of March 31, 2019 |
|---|---|---|
National Capital Region (NCR) |
3 222 |
30% |
Non-NCR |
7 614 |
70% |
Unknown |
14 |
|
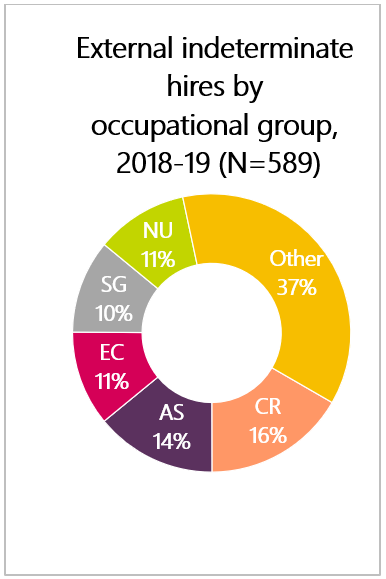
Text version
Occupational group |
Number of indeterminate hiring activities |
Percentage of all indeterminate hiring activities |
|---|---|---|
CR – Clerical and Regulatory |
98 |
17% |
AS – Administrative Services |
83 |
14% |
EC – Economics and Social Science Services |
65 |
11% |
SG – Scientific Regulation |
64 |
11% |
NU – Nursing |
63 |
11% |
Other |
216 |
37% |
Total |
589 |
100% |
Text version
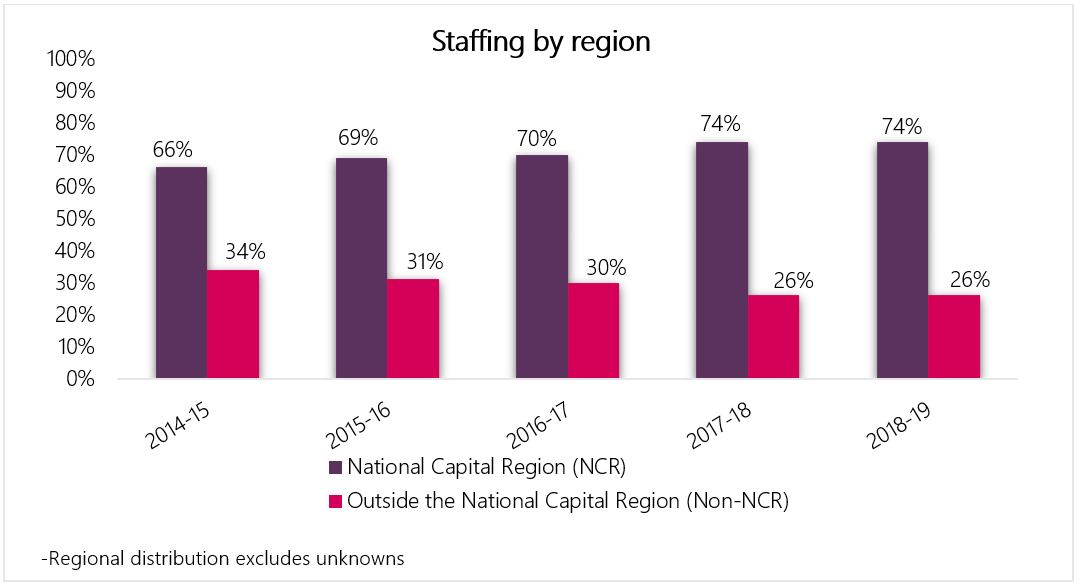
Fiscal year |
Percentage of staffing activities in the National Capital Region (NCR) |
Percentage of staffing activities in all other regions (Non-NCR) |
|---|---|---|
2014 to 2015 |
66% |
34% |
2015 to 2016 |
69% |
31% |
2016 to 2017 |
70% |
30% |
2017 to 2018 |
74% |
26% |
2018 to 2019 |
74% |
26% |

Text version
Fiscal year |
Non-advertised processes (excludes unknowns) |
Advertised processes |
% of Non- advertised processes |
|---|---|---|---|
2014 to 2015 |
430 |
825 |
34% |
2015 to 2016 |
347 |
790 |
31% |
2016 to 2017 |
483 |
1 040 |
32% |
2017 to 2018 |
985 |
1 196 |
45% |
2018 to 2019 |
1 457 |
1 386 |
51% |

Text version
Fiscal year |
Promotions |
Lateral and downward movements |
Appointments to the public service (includes casuals and students) |
Acting appointments (excludes appointments of less than 4 months) |
Total |
|---|---|---|---|---|---|
2014 to 2015 |
509 |
674 |
1 334 |
812 |
3 329 |
2015 to 2016 |
525 |
714 |
1 703 |
801 |
3 743 |
2016 to 2017 |
858 |
1 070 |
1 855 |
638 |
4 421 |
2017 to 2018 |
1 065 |
1 179 |
2 266 |
614 |
5 124 |
2018 to 2019 |
1 356 |
1 423 |
2 783 |
797 |
6 359 |
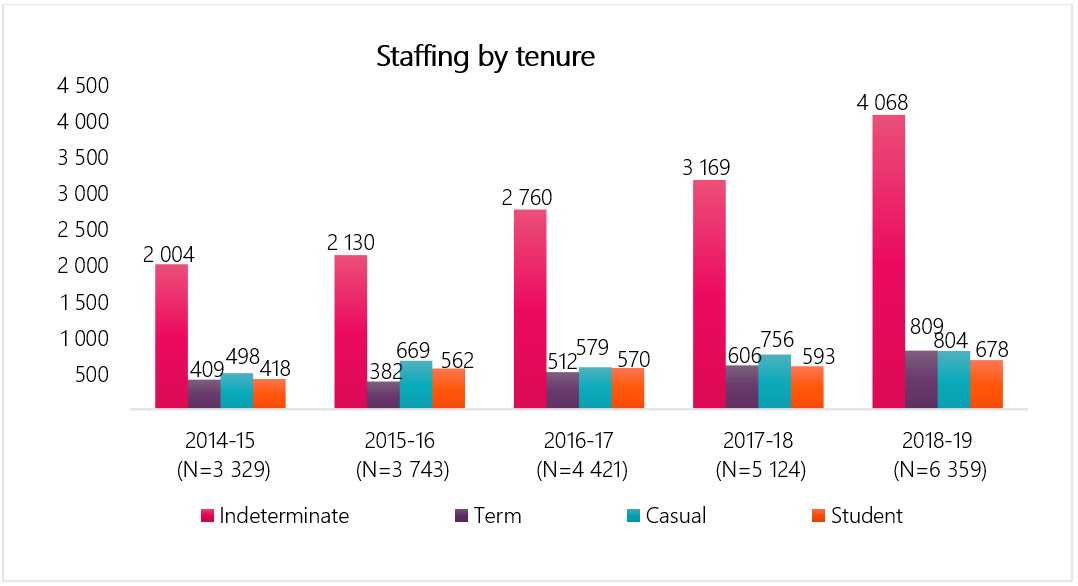
Text version
Fiscal year |
Indeterminate staffing activities |
Term staffing activities |
Casual staffing activities |
Student staffing activities |
Total staffing activities |
2014 to 2015 |
2 004 |
409 |
498 |
418 |
3 329 |
2015 to 2016 |
2 130 |
382 |
669 |
562 |
3 743 |
2016 to 2017 |
2 760 |
512 |
579 |
570 |
4 421 |
2017 to 2018 |
3 169 |
606 |
756 |
593 |
5 124 |
2018 to 2019 |
4 068 |
809 |
804 |
678 |
6 359 |
Key findings - Staffing and non-partisanship survey (2018)
- 58.0% of employees agreed that people hired can do the job, compared to 52.3% in organizations of similar size, and 53.8% in the federal public service
- 62.7% of managers agreed that the New Direction in Staffing has improved the way they hire and appoint persons to and within their organization, compared to 54.4% in organizations of similar size, and 56.1% in the federal public service
- 88.8% of managers agreed that within their organization, the administrative to staff a position is burdensome, compared to 88.6% in organizations of similar size, and 87.9% in the federal public service.
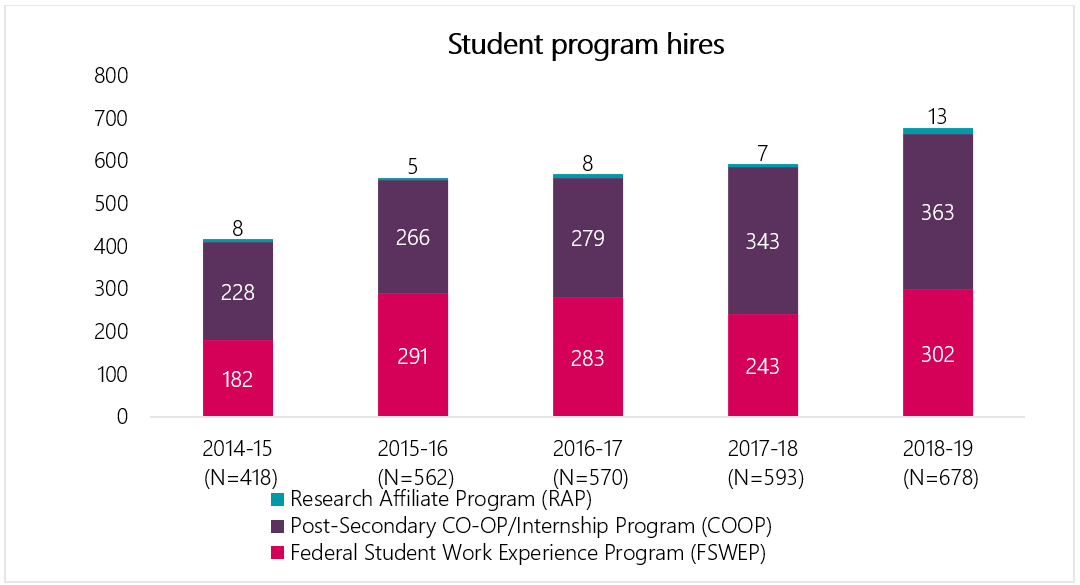
Text version
Fiscal year |
Federal Student Work Experience Program |
Post-Secondary Co-op/Internship Program |
Research Affiliate Program |
Total |
|---|---|---|---|---|
2014 to 2015 |
182 |
228 |
8 |
418 |
2015 to 2016 |
291 |
266 |
5 |
562 |
2016 to 2017 |
283 |
279 |
8 |
570 |
2017 to 2018 |
243 |
343 |
7 |
593 |
2018 to 2019 |
302 |
363 |
13 |
678 |
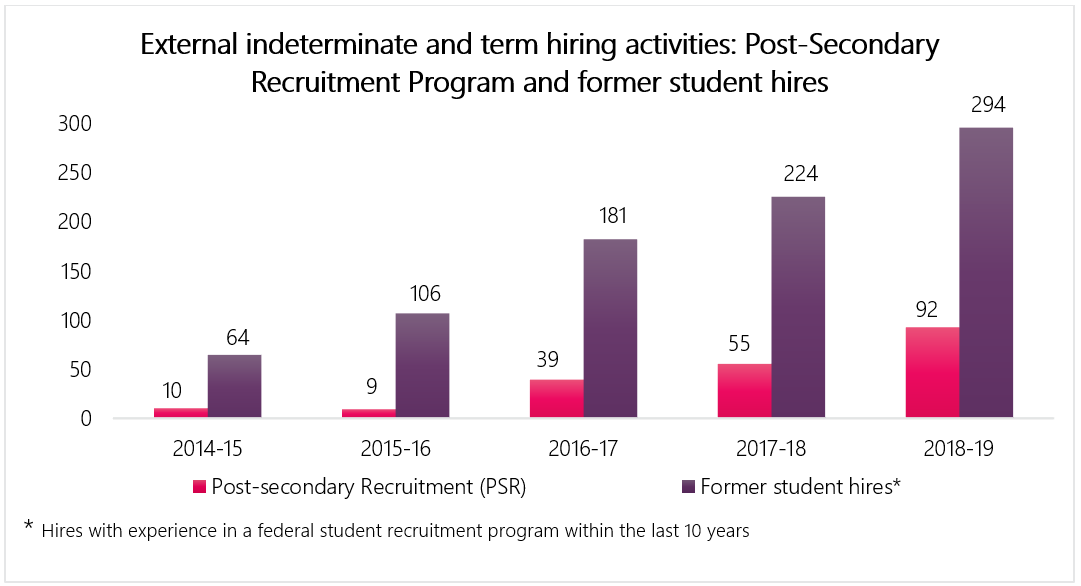
Text version
Fiscal year |
Post-Secondary Recruitment Program hires |
Hiring of former students |
|---|---|---|
2014 to 2015 |
10 |
64 |
2015 to 2016 |
9 |
106 |
2016 to 2017 |
39 |
181 |
2017 to 2018 |
55 |
224 |
2018 to 2019 |
92 |
294 |
The median internal time to staff for the public service (organizations subject to the Public Service Employment Act) for fiscal year 2018 to 2019 is 176 days.
Internal time to staff for fiscal year 2018 to 2019
Health Canada’s median internal time to staff for fiscal year 2018 to 2019 is 201 days
Text version
Number of calendar days |
The number of internal appointments for which the TTS-IA was within the specified number of calendar days for organizations subject to the Public Service Employment Act |
The number of internal appointments for which the TTS-IA was within the specified number of calendar days for the specified organization |
|---|---|---|
0 calendar days |
0 |
0 |
0 to 29 calendar days |
15 |
0 |
30 to 59 calendar days |
130 |
1 |
60 to 89 calendar days |
277 |
12 |
90 to 119 calendar days |
391 |
21 |
120 to 149 calendar days |
367 |
17 |
150 to 179 calendar days |
322 |
15 |
180 to 209 calendar days |
278 |
13 |
210 to 239 calendar days |
241 |
19 |
240 to 269 calendar days |
165 |
8 |
270 to 299 calendar days |
134 |
9 |
300 to 329 calendar days |
107 |
8 |
330 to 359 calendar days |
77 |
4 |
360 to 389 calendar days |
61 |
3 |
390 to 419 calendar days |
53 |
3 |
420 to 449 calendar days |
51 |
0 |
450 to 479 calendar days |
42 |
2 |
480 to 509 calendar days |
40 |
1 |
510 to 539 calendar days |
32 |
3 |
540 to 569 calendar days |
24 |
2 |
570 to 599 calendar days |
21 |
2 |
600 to 629 calendar days |
11 |
1 |
630 to 659 calendar days |
19 |
2 |
660 to 689 calendar days |
3 |
0 |
690 to 719 calendar days |
13 |
1 |
720 to 749 calendar days |
6 |
0 |
750 to 779 calendar days |
5 |
0 |
780 to 809 calendar days |
8 |
1 |
810 to 839 calendar days |
4 |
0 |
840 to 869 calendar days |
10 |
0 |
870 to 899 calendar days |
4 |
1 |
900 to 929 calendar days |
5 |
2 |
930 to 959 calendar days |
5 |
0 |
960 to 989 calendar days |
3 |
0 |
More than 990 calendar days |
23 |
2 |
The median external time to staff for the public service (organizations subject to the Public Service Employment Act) for fiscal year 2018 to 2019 is 186 days.
External time to staff for fiscal year 2018 to 2019
Health Canada’s median external time to staff for fiscal year 2018 to 2019 is 193 days
Text version
Number of calendar days |
The number of external appointment processes for which the TTS-EA was within the specified number of calendar days for organizations subject to the Public Service Employment Act |
The number of external appointment processes for which the TTS-EA was within the specified number of calendar days for the specified organization |
|---|---|---|
0 calendar days |
0 |
0 |
0 to 29 calendar days |
49 |
4 |
30 to 59 calendar days |
82 |
5 |
60 to 89 calendar days |
124 |
5 |
90 to 119 calendar days |
160 |
14 |
120 to 149 calendar days |
181 |
7 |
150 to 179 calendar days |
179 |
3 |
180 to 209 calendar days |
160 |
7 |
210 to 239 calendar days |
139 |
9 |
240 to 269 calendar days |
84 |
4 |
270 to 299 calendar days |
73 |
3 |
300 to 329 calendar days |
61 |
2 |
330 to 359 calendar days |
41 |
3 |
360 to 389 calendar days |
43 |
0 |
390 to 419 calendar days |
49 |
0 |
420 to 449 calendar days |
35 |
2 |
450 to 479 calendar days |
22 |
1 |
480 to 509 calendar days |
27 |
2 |
510 to 539 calendar days |
17 |
3 |
540 to 569 calendar days |
15 |
1 |
570 to 599 calendar days |
14 |
2 |
600 to 629 calendar days |
12 |
1 |
630 to 659 calendar days |
7 |
0 |
660 to 689 calendar days |
5 |
0 |
690 to 719 calendar days |
7 |
0 |
720 to 749 calendar days |
11 |
1 |
750 to 779 calendar days |
3 |
1 |
780 to 809 calendar days |
7 |
0 |
810 to 839 calendar days |
2 |
0 |
840 to 869 calendar days |
2 |
0 |
870 to 899 calendar days |
0 |
0 |
900 to 929 calendar days |
3 |
0 |
930 to 959 calendar days |
1 |
0 |
960 to 989 calendar days |
0 |
0 |
More than 990 calendar days |
0 |
0 |
Technical notes:
- The Time to Staff - Internal Appointments is the median number of calendar days between the opening date of an internal advertisement and the date of the first Notice of Appointment or Proposal of Appointment (NAPA) from the Public Service Resourcing System for internal term and indeterminate positions. As NAPAs are not required for all internal staffing actions, this measure is limited to reporting on internal promotional appointments.
- The Time to Staff - External Appointments is the median number of calendar days between the opening date of an external advertisement and the date of the first estimated appointment of an individual from outside an organization subject to the Public Service Employment Act for term and indeterminate positions. Because data between systems is linked using a probabilistic match, errors in data linkage are a potential source of measurement error.
- Only estimated term and indeterminate appointments/notifications are included (deployments, casual and acting appointments are excluded).
Sources:
- Hiring and staffing activities data are derived from information received from the Treasury Board of Canada Secretariat Incumbent File. The Incumbent File is extracted from the Public Services and Procurement Canada’s pay system. The data constitutes an estimate of hiring and staffing activities to and within organizations.
- Information from the Priority Information Management System and the Public Services Resourcing System is also used to determine if staffing actions are advertised or non-advertised as well as for calculating time to staff.
- The data are not expected to match an organization’s human resources data, due to methodology and timing differences.
- The Time to Staff - Internal Appointments (TTS-IA) is the median number of calendar days between the opening date of an internal advertisement and the date of the first Notice of Appointment or Proposal of Appointment (NAPA) from the Public Service Resourcing System for internal term and indeterminate positions. As NAPAs are not required for all internal staffing actions, this measure is limited to reporting on internal promotional appointments
- Only estimated term and indeterminate appointments/notifications are included (deployments, casual and acting appointments are excluded)
- The Time to Staff - External Appointments (TTS-EA) is the median number of calendar days between the opening date of an external advertisement and the date of the first estimated appointment of an individual from outside an organization subject to the Public Service Employment Act for term and indeterminate positions. Only estimated term and indeterminate appointments/notifications are included (deployments, casual and acting appointments are excluded)
- Because data between systems is linked using a probabilistic match, errors in data linkage are a potential source of measurement error
- Hiring and staffing activities data are derived from information received from the Treasury Board of Canada Secretariat Incumbent File. The Incumbent File is extracted from the Public Services and Procurement Canada’s pay system. The data constitutes an estimate of hiring and staffing activities to and within organizations.
- Information from the Priority Information Management System and the Public Services Resourcing System is also used to determine if staffing actions are advertised or non-advertised as well as for calculating time to staff.
- The data are not expected to match an organization’s human resources data, due to methodology and timing differences.