Overview of public service staffing and trends in EX-03, EX-04 and EX-05 groups
Background
This document summarizes key trends on employment equity of applicants and appointments as well as trends in recruitment, promotions, departures and employment equity representation for the senior executive cadre of the public service. This report also examines movement in and out of senior executive groups, employment equity representation of their members, and the characteristics of the most common senior executive feeder groups.
Overview of public service staffing
Applications to external advertisements
- In 2019-2020 there were 858,128 applications to 3,357 external advertised processes.
- This was a decrease of 11.5% (111,774) in applications and an increase of 2.9% (94) in advertisements from the previous fiscal year.
- Since 2012-2013, the number of applications and external advertised processes have increased by 211% (582,350) and 171% (2,120) respectively.
Applicants by employment equity group
- In 2019-2020, the share of applicants for all employment equity groups increased.
- Persons with disabilities accounted for 3.0% of applicants to external advertised processes, an increase of 0.3 percentage points over the previous year.
- Indigenous peoples accounted for 3.2% of applicants to external advertised processes, an increase of 0.2 percentage points over the previous year.
- Members of visible minorities accounted for 24.3% of applicants to external advertised processes, an increase of 1.0 percentage point over the previous year.
- Women accounted for 55.3% of applicants to external advertised processes, an increase of 0.3 percentage points over the previous year.
- These are the highest shares of applicants for persons with disabilities, members of visible minorities, and women in the last five years. However, for indigenous applicants, their share has trended down over the same period.
- The share of applicants for both women and members of visible minorities are above their workforce availability for the past five years, 52.7% and 15.3% respectively.
- The share of applicants for both indigenous and persons with disabilities are below workforce availability for the past five years, 4.0% and 9.0% respectively.
External hires
- In 2019-2020, there were 61,794 total external hires for organizations subject to the Public Service Employment Act.
- This was an increase of 3.5% (2,077) from the previous fiscal year.
- Since 2012-2013, the number of external hiring has increased by 101% (31,091).
- In 2019-2020, there were 11,360 total external indeterminate hires.
- This was an increase of 2.9% (321) from the previous fiscal year.
- Since 2012-2013, the number of indeterminate hiring has increased by 474% (9,381).
- In 2019-2020, there were 14,836 total external term hires.
- This was an increase of 8.7% (1,183) from the previous fiscal year.
- Since 2012-2013, the number of term hiring has increased by 208% (10,032).
External hires by employment equity group
- In 2018-2019, the share of external hires to indeterminate and terms with a duration of 3 months or more for all employment equity groups increased, with the exception of women. Footnote 1
- In 2018-2019, the share of hiring activities of all external indeterminate and terms greater than three months for each designated group was:
- 3.7% (864) for persons with disabilities, an increase from 3.5% (347) in 2014-2015.
- 4.1% (962) for indigenous peoples, an increase from3.8% (385) in 2014-2015.
- 19.3% (4,507) for members of visible minorities, an increase from 16.1% (1,610) in 2014-2015.
- 56.5% (13,176) for women, a decrease from 56.6% (5,665) in 2014-2015.
- The share of external hires for women and members of visible minorities are above their workforce availability for the past five years, 52.7% and 15.3% respectively.
- For indigenous peoples the share of external hires was above their workforce availability of 4.0% in each of the past four years.
- The share of external hires for persons with disabilities is well below its workforce availability of 9.0% in 2018-2019, as well as the previous workforce availability of 4.4% for the preceding four years.
Trends in EX-03 to EX-05 positions
The federal public service must continue to expand its understanding of the challenges faced by employment equity groups, and of the opportunities a diverse workforce offers. This involves building a deeper understanding of differences within groups, and of intersections with diversity factors within our executive community.
EX population
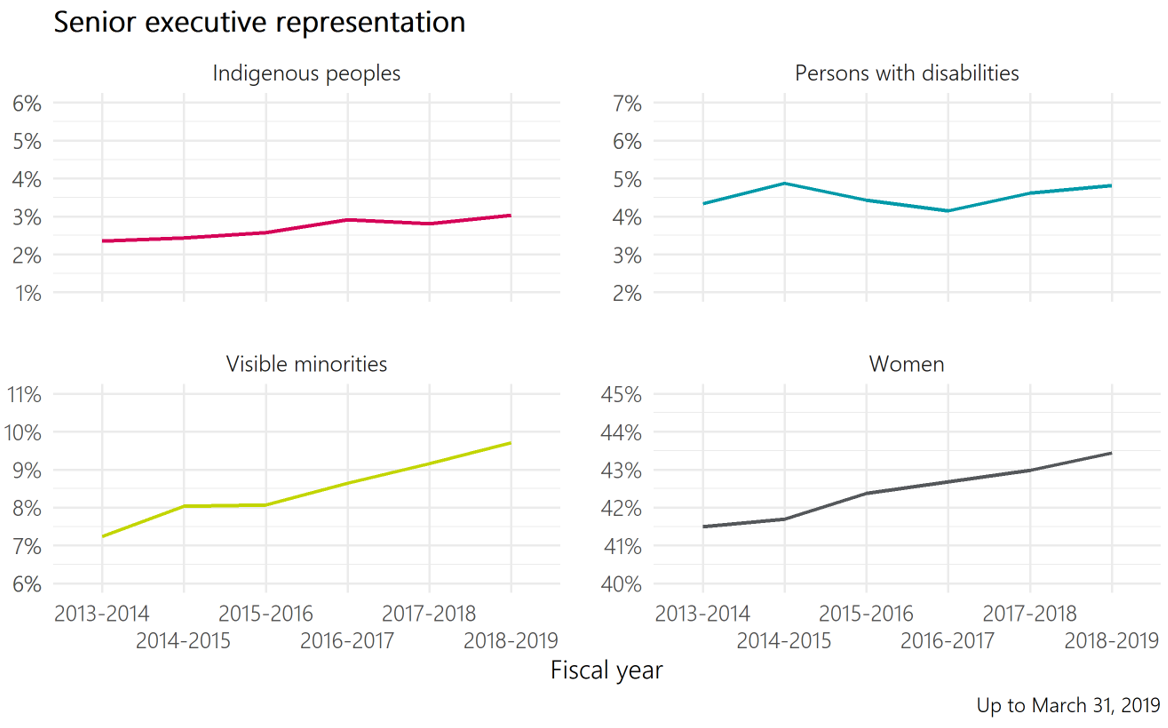
Population trends in the EX-03, EX-04 and EX-05 (“senior executive”) groups are largely driven by the EX-03 group, which accounted for just under 75 percent of such executives in 2018-2019. Among senior executives, the representation in each employment equity group is below the workforce availability of the overall executive cadre. The representation of senior executives is also lower than the representation within the EX-01 and EX-02 feeder groups for all employment equity groups except persons with disabilities. However, employment equity representation for senior executives has generally increased over the past five years.
- The number of senior executives has increased from 1,106 in 2014 to 1,287 in 2019, driven largely by promotions into the EX-03 group.
- As of March 31, 2019 there were 957 EX-03, 229 EX-04, and 101 EX-05 executives subject to the Public Service Employment Act.
- Employment equity representation is strongly influenced by the EX-03 group. Within the EX-04 and EX-05 communities in 2018-2019, there were 10 Indigenous peoples, 16 persons with disabilities and 29 visible minorities.
- The representation for women within senior executive positions was 43.4% in 2018-2019, below workforce availability for female executives (48%).
- The representation for persons with disabilities in senior executive positions was 4.8% in 2018-2019, below workforce availability for executives (5.3%).
- The representation for visible minorities in senior executive positions was 9.7% in 2018-2019, below executive workforce availability (10.6%).
- The representation for Indigenous peoples in senior executive positions was 3.0% in 2018-2019, below workforce availability for executives (5.1%).
- Although workforce availability is not calculated for senior executives, if we use the workforce availability for the executive group at large, there is a gap in senior executive representation for each employment equity group. As of 2018-2019, the senior executive population would need to add 6 persons with disabilities, 27 Indigenous peoples, 11 visible minorities and 59 women to fill that representation gap.
- Although employment equity representation for senior executives falls below workforce availability, representation has generally been increasing since 2014.

Text version
Employment equity group |
2013-2014 |
2014-2015 |
2015-2016 |
2016-2017 |
2017-2018 |
2018-2019 |
|---|---|---|---|---|---|---|
Indigenous peoples |
2.4% |
2.4% |
2.6% |
2.9% |
2.8% |
3.0% |
Persons with disabilities |
4.3% |
4.9% |
4.4% |
4.1% |
4.6% |
4.8% |
Visible minorities |
7.2% |
8.0% |
8.1% |
8.6% |
9.2% |
9.7% |
Women |
41.5% |
41.7% |
42.4% |
42.7% |
43.0% |
43.4% |
Representation within senior executive feeder groups
Given that the majority of movement into senior executive positions is from existing public servants, we evaluated the demographics of the EX-01 and EX-02 groups. These traditional feeder groups tend to be younger and more representative than the EX-03 to EX-05 groups themselves.
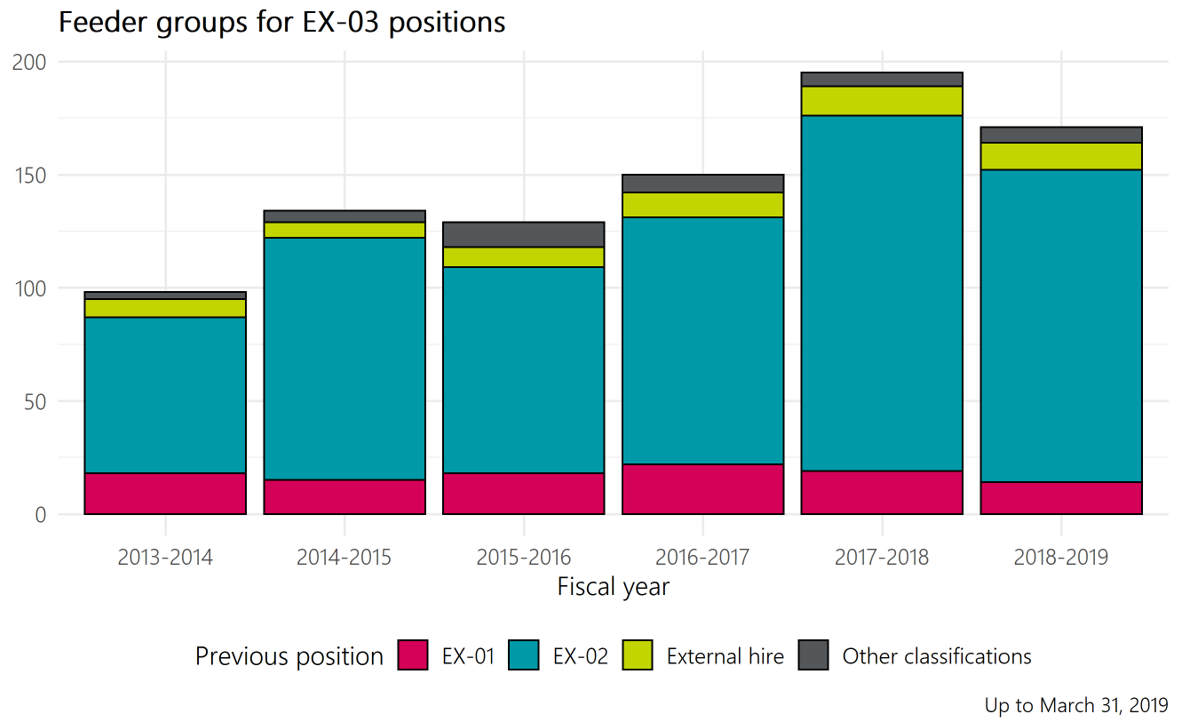
- The primary feeder groups for EX-03, EX-04 and EX-05 positions are existing EX-02 executives and external candidates.
- Since 2014, over three quarters of newly appointed EX-03s came from an EX-02 position. Roughly 11% came from an EX-01 position, and under 7% were hired from outside government.

Text version
Previous positions |
2013-2014 |
2014-2015 |
2015-2016 |
2016-2017 |
2017-2018 |
2018-2019 |
|---|---|---|---|---|---|---|
EX-01 |
18 |
15 |
18 |
22 |
19 |
14 |
EX-02 |
69 |
107 |
91 |
109 |
157 |
138 |
External hire |
8 |
7 |
9 |
11 |
13 |
12 |
Other classifications |
3 |
5 |
11 |
8 |
6 |
7 |
- In 2018-2019, employment equity representation within the EX-02 group was higher than within the EX-03 to EX-05 group, with the exception of persons with disabilities (4.8% in EX-03 to EX-05; 4.3% in the EX-02 feeder group).
Staffing
Staffing activities, which include both hires from outside the public service and internal promotions, for EX-03 to EX-05 positions have increased in recent years, outpacing departures from these positions.
- Annual staffing activities into senior executive positions increased from 151 in 2013-2014 to 239 in 2018-2019.
- Most EX-03, EX-04 and EX-05 executives arrive in those groups via promotion. In 2018-2019, 13% of EX-03 to EX-05 staffing activities were from outside the public service, whereas 87% resulted from promotions of existing public servants.
- Given the limited number of EX-04 and EX-05 positions, over 65 percent of movement into senior executive positions has been into the EX-03 group. In 2018-2019, 71.5% of new senior executives were appointed into the EX-03 group.
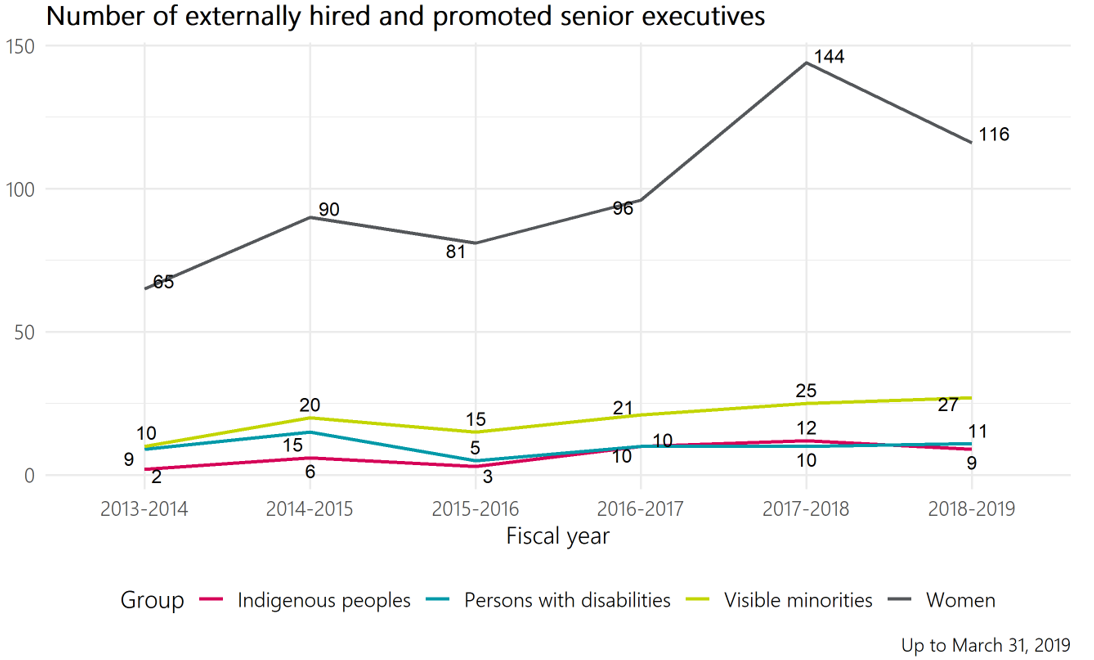
- Employment equity representation of staffing actions into senior executive positions has fluctuated in recent years, but is trending up for all groups.
- In the past five years, between 5 and 11 persons with disabilities have been newly appointed into senior executive positions per year. In 2018-2019, the share of senior executive staffing actions was 4.6% (11).
- In the past five years, between 2 and 12 Indigenous peoples have been newly appointed into senior executive positions per year. In 2018-2019, the share of senior executive staffing actions was 3.8% (9).
- In the past five years, between 10 and 27 visible minorities have been newly appointed into senior executive positions per year. In 2018-2019, the share of senior executive staffing actions was 11.3% (27).
- In the past five years, between 65 and 144 women have been newly appointed into senior executive positions per year. In 2018-2019, the share of senior executive staffing actions was 48.7% (116).

Text version
Employment equity group |
2013-2014 |
2014-2015 |
2015-2016 |
2016-2017 |
2017-2018 |
2018-2019 |
|---|---|---|---|---|---|---|
Indigenous peoples |
2 |
6 |
3 |
10 |
12 |
9 |
Persons with disabilities |
9 |
15 |
5 |
10 |
10 |
11 |
Visible minorities |
10 |
20 |
15 |
21 |
25 |
27 |
Women |
65 |
90 |
81 |
96 |
144 |
116 |
Departures
Departures from EX-03 to EX-05 positions are generally lower than recruitment volumes, which contributes to the increase in employment equity representation seen in these executive groups over the past five years. There is some evidence to suggest that senior executives may be leaving the public service later than in previous years.
- The number of total departures from senior executive positions has decreased slightly, from 154 in 2013-2014 to 111 in 2018-2019.
- Most departures from EX-03, EX-04 and EX-05 positions are retirements. In 2018-2019, nearly 65% of departures were classified as retirements.
- Most of these departures are from EX-03 positions, due to that group’s larger share of senior executive positions.
- Within all employment equity groups in 2018-2019, the number of newly appointed senior executives exceeded the number of departures. The table below illustrates the difference between inflows and outflows for senior executives:
Employment equity group |
Inflow (promotions+ new hires) |
Inflows who were not previously in the EX-03 to EX-05 groups |
Outflow (retirements + other separations) |
Population representation |
Workforce availability for all EX |
Gap |
|---|---|---|---|---|---|---|
Persons with disabilities |
11 |
9 |
3 |
4.8% (62 executives) |
5.3% |
6 senior executives |
Indigenous peoples |
9 |
8 |
2 |
3.0% (39 executives) |
5.1% |
27 senior executives |
Visible minorities |
27 |
24 |
4 |
9.7% (125 executives) |
10.6% |
11 senior executives |
Women |
116 |
90 |
53 |
43.4% (559 executives) |
48% |
59 senior executives |