
President meeting with Christine Hogan, Deputy Minister of Environment and Climate Change Canada December 16, 2019
Introduction
Deputy Head
Ms. Christine Hogan was appointed as the Deputy Minister, Environment and Climate Change Canada (ECCC) on September 30, 2019.
Ms. Hogan is exercising the Public Service Commission’s (PSC) authority for the first time as Deputy Head (DH). A copy of the New Direction in Staffing (NDS) highlights for DHs is attached as Annex A.
Deputy Minister University Champion
Ms. Hogan has not been identified as a Deputy Minister University Champion. However, please note that Martine Dubuc, Associate Deputy Minister of Environment and Climate Change, is the champion of L’École Polytechnique de Montréal.
ECCC is very active in job fairs, promoting jobs within their organization and hiring students. More specifically, the PSC is currently working with ECCC to organize a career fair with multiple departments and universities. This event is to be hosted in the Montreal area. The objective of the fair is to quickly identify resources to staff positions in the science and technology field while encouraging labor market representativeness within participating departments. ECCC will host an interdepartmental speed staffing event that engages multiple universities in the Quebec region. Communications associated with this event will promote and encourage persons with disabilities, visible minorities, women and aboriginal peoples to participate and apply. The fair is planned for February 2020.
Organizational Context
Mandate
ECCC is the lead federal department for a wide range of environmental issues. The department addresses these issues through various actions including the implementation of the Pan-Canadian Framework on Clean Growth and Climate Change; engaging with strategic partners including provinces, territories and Indigenous peoples; monitoring science-based research; policy and regulatory development; and, through the enforcement of environmental laws. The department's programs focus on minimizing threats to Canadians and their environment from pollution; equipping Canadians to make informed decisions on weather, water and climate conditions; and conserving and restoring Canada's natural environment.
Priorities
In 2019-2020, ECCC will continue to implement its action plan to promote equity, diversity and inclusion work towards addressing areas of under-representation in its workforce.
To respond quickly to new priorities and expectations, ECCC will continue to recruit and develop a skilled workforce, particularly in the area of highly specialized personnel and focus on retention.
Experimentation
ECCC is continuously looking for innovative approaches in staffing. For example, along with eight other federal scientific departments and agencies, ECCC advertised a process on jobs.gc.ca and twitter (#iwantasciencejob) to staff positions for various entry level scientific positions across Canada. ECCC received over 3,700 applicants for this process and are currently at the assessment stage.
Following this initiative and in order to recognize their innovation and their efforts in relation to this project, the ECCC human resources (HR) team received the Michelle C. Comeau Award in 2019.
Population and Staffing Activities
Population
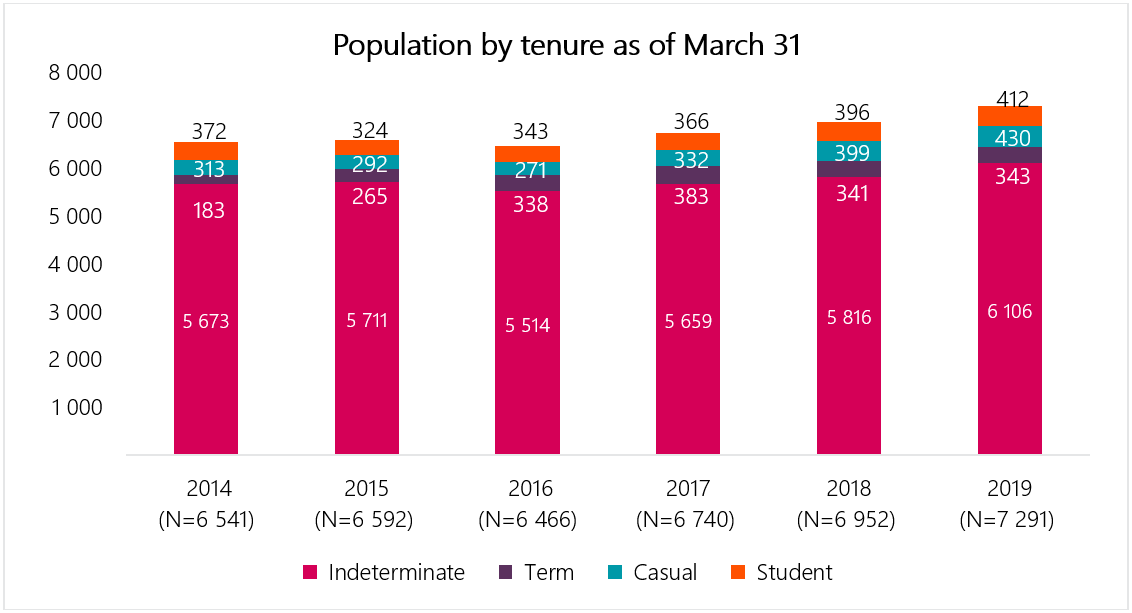
ECCC is a large organization that has a population of 7,291 employees (as of March 31, 2019).
Staffing Activities
In 2019-2020, ECCC proceeded with a total of 4494 staffing activities:
- 2484 appointments to the public service (includes 885 casuals and 898 students);
- 951 promotions;
- 318 acting appointments (excluding appointments less than 4 months); and
- 741 lateral and downward movements.
Please refer to Annex B for additional details on staffing activities.
Time to Staff
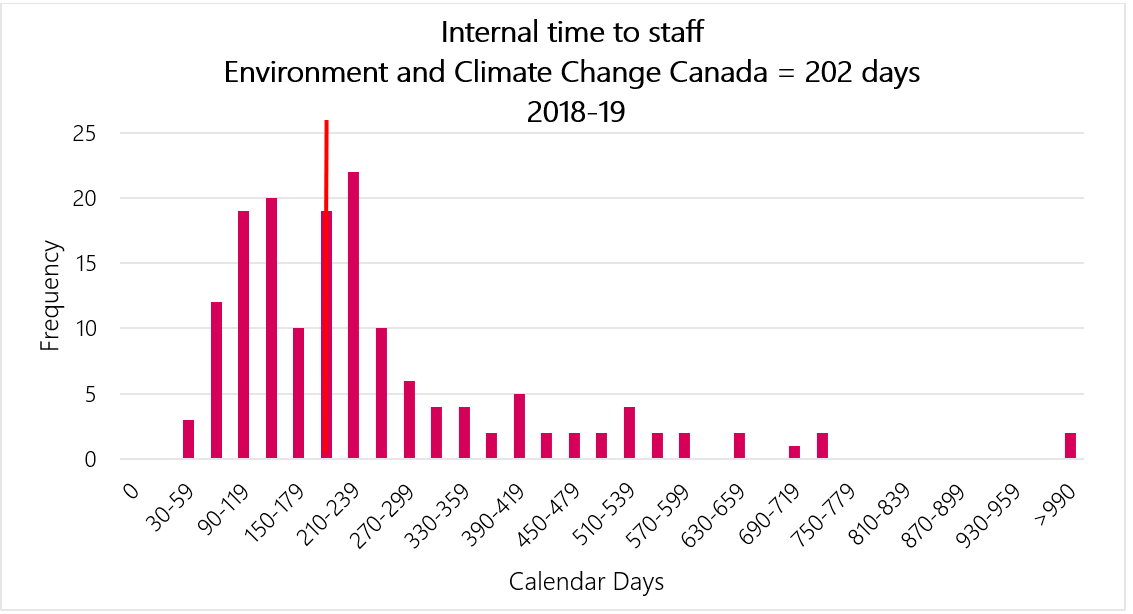
ECCC has a median time to staff of 202 days for internal appointment processes. This is higher than the median time to staff for the public service standing at 176 days.
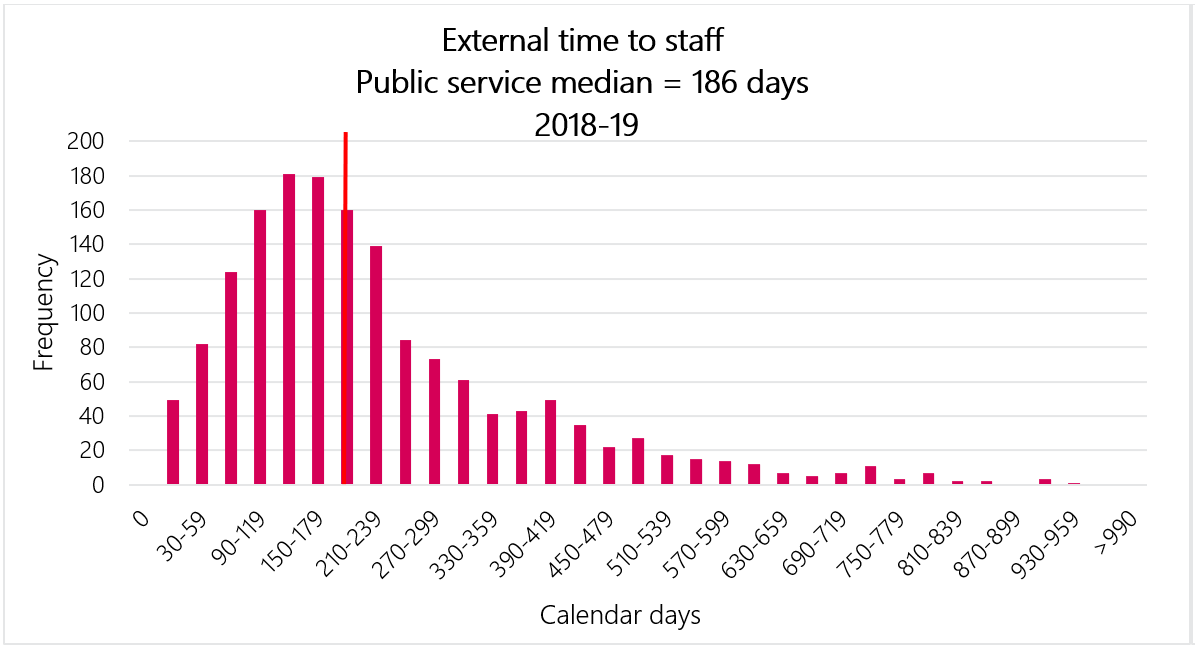
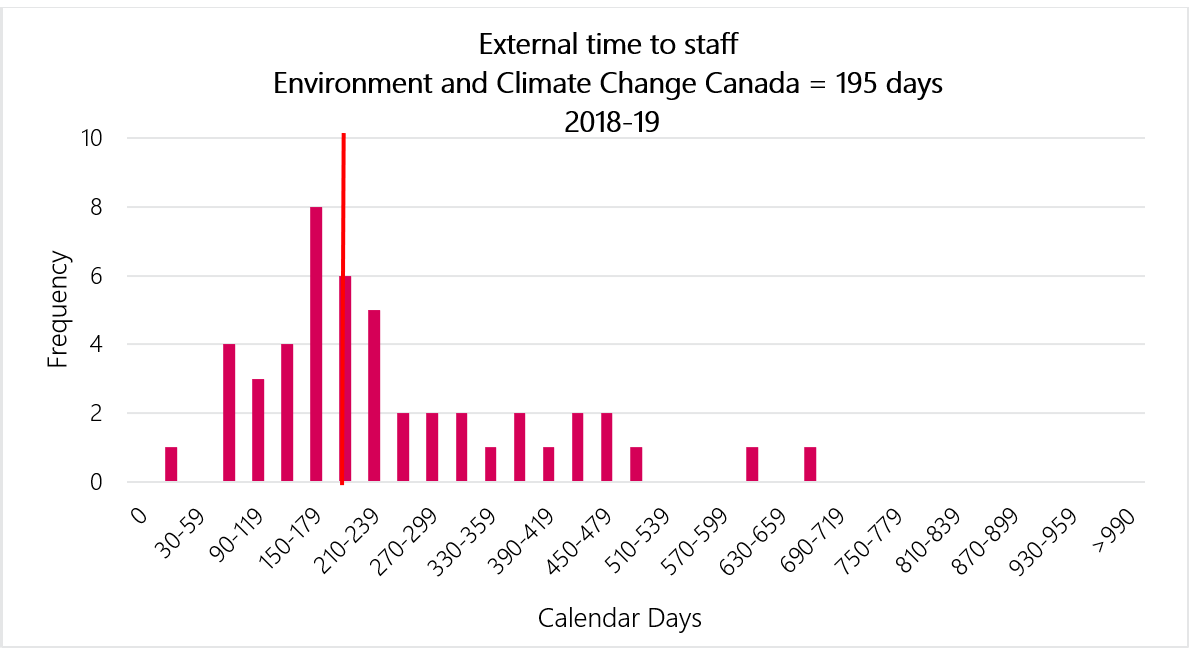
ECCC has a median time of 195 days for external appointment processes. This is also higher than the median for the public service standing at 186 days.
Staffing Framework
New Direction in Staffing Implementation
ECCC has put in place the requirements related to the NDS for April 1, 2016.
ECCC’s staffing policy includes all of the PSC’s Appointment Delegation and Accountability Instrument (ADAI) requirements including:
- direction for the determination of the area of selection;
- the use of advertised and non-advertised appointment processes; and
- the articulation of the selection decision.
All sub-delegated managers have received training on NDS and have signed the required attestation form. ECCC has also shared their appointment framework with the PSC. It should be noted that ECCC’s Appointment Staffing Policy encourages sub-delegated managers to engage their HR Advisor in strategic discussions concerning their staffing needs, discuss key points of considerations and obtain expert advice in articulating the decision for selection of candidates.
With the coming into force of the NDS, ECCC has revised its staffing sub-delegation instrument. However, with the arrival of a new Deputy Minister, the revision of the instrument may be required. The question is currently being analyzed with corporate staffing.
Another ongoing improvement is to promote the use of the staffing manual which was recently developed to help support managers with the development of merit criteria; rating guides and identifying values-based considerations for various staffing options, amongst other things.
Appointment Delegation and Accountability Instrument Annex D Reporting
Use of the Public Service Official Languages Exclusion Approval Order and the Public Service Official Languages Appointment Regulations
ECCC reported that the organization made no use of the Public Service Official Languages Exclusion Approval Order. However, 6 cases were reported on the use of the Public Service Official Languages Appointment Regulations for the periods of April 1, 2018 and March 31, 2019. ECCC HR Services is monitoring these cases while following-up with managers and employees on a case-by-case basis. For the moment, no action is required by the PSC.
Approved Deputy Head Exceptions to the National Area of Selection Requirements for External Advertised Appointment Process
ECCC reported that the DH approved 1 exception to the National Area of Selection. The positions to staff are EG-03 Junior Technologist, Monitoring/Data Services. The advertisement is published for continuous intake until September 24, 2020 with the following area of selection: AREA 1: "Persons residing or employed in Stony Plain (AB) and within an 80 kilometer radius of Stony Plain (AB), extending to, amongst others, Westlock (AB), Bruderheim (AB), Wetaskiwin (AB), Entwistle (AB)." AREA 2: Should an insufficient number of applications be retained from Area 1, applications received from "persons residing in Canada and Canadian citizens residing abroad" (Area 2) will be considered.
No appointment has yet been made from this ongoing advertised process.
Results of Organizational Cyclical Assessment
As per the ADAI requirement to submit a cyclical assessment report every five years at a minimum (first cohort due by May 1, 2021), ECCC is presently drafting their organizational cyclical assessment report to be submitted to the PSC in May 2020.
Inquiries and Trends
Since the implementation of the NDS, ECCC has consulted the PSC on a variety of topics, mostly regarding assessment, legislation interpretations (Public Service Employment Act (PSEA)), monitoring and reporting- more specifically with regards to cyclical assessment reporting.
ECCC has demonstrated openness and willingness to share their staffing tools with the PSC and other requesting organizations. The Staffing Support Advisor (SSA) is often invited to participate in meetings with human resources advisors to answer staffing questions and to provide updates on PSC projects and initiatives.
Oversight
Audits
In 2017, ECCC conducted a collaborative audit with the PSC on staffing. The resulting conclusions or observations were that most key elements for the organizational staffing framework were in place and the sampled appointments under review were generally in compliance with the PSEA and other statutory and regulatory instruments.
Recommendations were made in the following areas:
- encourage the reinforcement of compliance for the application of the sub-delegation staffing instrument with the authorities outlined in Annex A of the ADAI;
- improve compliance of appointments regarding:
- the documentation and demonstration of merit;
- respecting priority entitlements;
- ensuring translation equivalence between the French and English versions of Statements of Merit Criteria; and
- ensuring that the administration of the oath or solemn affirmation is performed on or before the date of appointment.
- enhance the monitoring of staffing activities by targeting items that would allow the DH to be informed of the overall state of ECCC’s staffing framework and activities.
The organization was one of the 15 organizations covered by the Horizontal Audit on Credential Validation. The final report for this audit was published in May 29, 2019. ECCC is also among the 30 organizations selected for the Audit of Employment Equity Representation in Recruitment that is currently underway.
Investigations
Over the last three years (from September 23, 2016 to September 23, 2019) the PSC received 13 cases requesting an investigation for ECCC, one of them being referred to the PSC by the organization.
During the same period in question:
- 10 cases have been closed (not accepted);
- 27 cases were completed (20 were deemed founded and 7 unfounded); and
- 1 case remains ongoing.
Nature of Issue |
Cases Received |
Cases Referred by Organization |
Closed – Not Accepted |
Completed Unfounded |
Completed Founded |
Ongoing |
|---|---|---|---|---|---|---|
s.66 External Appointments (Merit, Error, Omission, Improper Conduct |
9 |
0 |
9 |
0 |
0 |
0 |
s.67.2 Internal Appointment – Deputy Head Request |
0 |
0 |
0 |
0 |
0 |
0 |
s.68 Political Influence |
0 |
0 |
0 |
0 |
0 |
0 |
s.69 Fraud |
1 |
1 |
1 |
7 |
19 |
0 |
s.118 Improper Political Activities – Employees |
2 |
0 |
0 |
0 |
1 |
1 |
Total |
12 |
1 |
10 |
7 |
20 |
1 |
Note: The numbers may not add up as discontinued cases, cases resolved via early intervention and rare cases (s.119, s.67.1) are not included in this table.
Note: Each column is an independent calculation of the others. Cases received are cases received in the time period, cases completed are those completed in the period, not necessarily cases completed out of those received.
Although the number of founded cases appears to be high, there is no issue or problem to report. All situations were addressed by corrective measures, including training, recommendations regarding the assessment and the appointment process and, in cases of fraud, revocation. Please note that the 13 cases received do not add up to the numbers of closed and completed cases since these closed and completed cases were not necessarily received in the same period.
Staffing and Non-Partisanship Survey Results
Overall, ECCC’s Staffing and Non-Partisanship Survey (SNPS) results are similar in comparison to other large organizations and the overall public service.
Below are key findings from ECCC’s 2018 SNPS results:
- 66.7% of employees agreed that people hired can do the job, compared to 52.3% in organizations of similar size, and 53.8% in the federal public service;
- 53.4% of managers agreed that the NDS has improved the way they hire and appoint persons to and within their organization, compared to 54.4% in organizations of similar size, and 56.1% in the federal public service;
- 89.6% of managers agreed that within their organization, the administrative process to staff a position is burdensome, compared to 88.6% in organizations of similar size, and 87.9% in the federal public service;
- 58.1% of employees agreed that the process used for selecting persons for positions in their work units is done fairly, compared to 45% in organizations of similar size, and 46.4% in the federal public service; and
- 64.5% of managers indicated that staffing options available to them within their organizations provide them with the flexibility to appoint persons who are a good fit within their work units, compared to 58.2% in organizations of similar size, and 60% in the deferral public service.
Diversity Profile
Employment Equity (EE)
The statistics from 2017-2018 reveal that ECCC was above public service workforce availability for persons with disabilities and visible minorities. However, gaps were identified for women and aboriginal peoples. More specifically:
- women are under-represented at 48.9% of the workforce, while the Public Service workforce availability is at 52.5%;
- Aboriginal peoples are also under-represented at 3.0% of the workforce, while the public service workforce availability is at 3.4%;
- ECCC is above workforce availability for persons with disabilities at 4.6%; and
- ECCC is above workforce availability for members of visible minorities at 18%.
The representativeness of the four designated groups will have to be reviewed once the new data on the Public Service Work Force Availability are released in 2019.
Designated Group |
Public Service |
Environment and Climate Change Canada |
Representation across the Public Service of Canada |
|---|---|---|---|
Women |
52.5% |
48.9% |
54.8% |
Aboriginal Peoples |
3.4% |
3.0% |
5.1% |
Persons with Disabilities |
4.4% |
4.6% |
5.3% |
Members of Visible Minorities |
13.0% |
16.7% |
15.7% |
Source:Employment Equity in the Public Service of Canada 2017- 2018Treasury Board of Canada Secretariat
Strategies
The following array of solutions may be useful as ECCC continues to build a representative and diverse organization:
- The PSEA includes provisions that enable managers to:
- target designated group members through the area of selection for advertised appointment processes;
- establish and apply an organizational need to appoint designated group members; and
- use external and internal non-advertised appointment to appoint designated group members.
- The PSC offers recruitment solutions that target designated group members:
- request referrals of designated group members when using student programs such as the Federal Student Work Experience Program and Post-Secondary Co-op and Internship Program, with a plan that could include eventually recruiting students into the public service;
- advertising through the student program Research Affiliate Program to recruit students of designated group members; and
- request referrals of designated group members when using certain inventories, such as Post-Secondary Recruitment (PSR).
Priority Entitlements and Veterans
Since the coming into force of the Veterans Hiring Act, the Priority Information Management System data indicates that ECCC has appointed 6 members of the Canadian Armed Forces released for medical reasons, of which 3 were released for reasons attributable to service and 3 released for reasons not attributable to service.
Period |
Attributable To Service (Statutory) |
Not Attributable To Service (Regulatory) |
Total |
|---|---|---|---|
2015 (July 1) - 2016 |
0 |
1 |
1 |
2016 - 2017 |
1 |
0 |
1 |
2017 - 2018 |
2 |
0 |
2 |
2018-2019 |
0 |
2 |
2 |
2019-2020 |
0 |
0 |
0 |
Total |
3 |
3 |
6 |
Source: PSC Priority Information Management System
Non-Partisanship in the Public Service
Since April 1, 2015, the PSC has received 14 candidacy requests from employees:
- 7 requests for permission for federal elections (3 for the 2015 election and 4 for the 2019 election);
- 7 requests for permission for municipal elections. 3 employees were elected (1 in 2016; 2 in 2017); and
- to be noted that no candidacy requests were received for provincial/territorial elections.
The PSC's 2018 SNPS results indicate that most ECCC employees (80.3%) understand their rights and obligations for engaging in political activities, as compared to 79.4% in similar size organizations and 80.1% across all organizations in the federal public service.
Public Service Commission Initiatives
ECCC participated in the PSC Anonymized Recruitment initiative. The PSC is in the midst of reviewing the Public Service Employment Regulations. ECCC is a key stakeholder as they are one of the departments that staff positions using Incumbent-Based processes. Consultations with organizations on these proposed changes will be conducted in January 2020.
Recruitment Programs
ECCC participated in different employment opportunities for students:
- in 2019, ECCC hired 2 students of the employment opportunity for students with disabilities and 3 students of the Indigenous student employment opportunity;
- ECCC is one of our top five users of the inventories that were created from the PSR 2018-2019. Most of their requests (a total of 46) are from the sciences, nursing and engineering inventories and the administrative services inventory; and
- since 2017, ECCC hired 2 candidates from the Recruitment Policy Leader.
Staffing Support
Public Service Commission Representatives and Organizational Contacts
The SSA assigned to this organization is Caroline Fortin-Beaudry.
The primary organizational contact is Annie Létourneau, Manager, Corporate Staffing and Official Languages Solutions. Annie is also the co-chair for the National Staffing Council.
The Head of HR for this organization is Sylvain Paradis, Chief Human Resources Management Officer. Mr. Paradis was a Michelle C. Comeau Award nominee last year.
Prepared by:
- Caroline Fortin-Beaudry,
- Staffing Support Advisor
Annexes:
- Annex A – A New Direction in Staffing (NDS) highlights for DHs
- Annex B - Data on Population and Staffing Activities
Annex A
A New direction in Staffing – A merit-based system that is effective, efficient and fair
Appointment Policy
New focus on core requirements to provide sub-delegated persons greater discretion in making an appointment
- One Appointment Policy, no duplication with legal requirements
- Broader focus on values-based system, away from rules-based system
- Appointments Policy supported by streamlined guidance:
- A roadmap to the requirements in legislation, regulations and policy
- Options and considerations for decision-making where there is discretion
- Clear expectations for priority entitlements
- No restrictions to assessment methods for EX appointments
- Exceptions to National Area of Selection approved by deputy head
Delegation
- New ability to customize organizational staffing system based on unique context and evolving business needs
- Deputy head establish a direction on the use of advertised and non-advertised appointment processes
- Deputy heads to establish requirement(s) for sub-delegated persons to articulate, in writing, their selection decision
- Clarity on requirements related to investigations
- Attestation form to reinforce the accountabilities of sub-delegated persons
All PSC monitoring and reporting requirements now found in the Appointment Delegation and Accountability Instrument
Monitoring and Reporting
Monitoring built by organizations, targeted to their needs
- Annual Departmental Staffing Accountability Report no longer required
- Annual reporting to the PSC limited to:
- Use of Public Service Official Language Exclusion Approval Order
- Exceptions to the National Area of Selection approved by the deputy head
- Results of any internal investigations
- Actions taken following any PSC investigations or audits.
- Deputy head responsible for ongoing monitoring of organizational staffing system based on the organization’s unique context
- Assessment of adherence to requirements, based on organization’s own risks, at the minimum every five years
PSC Oversight
System wide-focus
- Government-wide compliance audit every two years
- Renewed Survey of Staffing administered in alternating years with government-wide audit
- System-wide effectiveness and efficiency reviews to support continuous improvement
- Targeted PSC audits as a result of identified system-wide or organizational risks or at the deputy head request
- Investigations conducted when there is a reason to believe there was political influence, fraud or improper conduct in an appointment process
This document should be read in conjunction with the Public Service Employment Act, the Public Service Employment Regulations, the PSC Appointment Policy and the PSC Appointment Delegation and Accountability Instrument.
Annex B
Text Alternative
Year |
Indeterminate population |
Term population |
Casual population |
Student population |
Total population |
|---|---|---|---|---|---|
As of March 31, 2014 |
5 673 |
183 |
313 |
372 |
6 541 |
As of March 31, 2015 |
5 711 |
265 |
292 |
324 |
6 592 |
As of March 31, 2016 |
5 514 |
338 |
271 |
343 |
6 466 |
As of March 31, 2017 |
5 659 |
383 |
332 |
366 |
6 740 |
As of March 31, 2018 |
5 816 |
341 |
399 |
396 |
6 952 |
As of March 31, 2019 |
6 106 |
343 |
430 |
412 |
7 291 |
Text Alternative
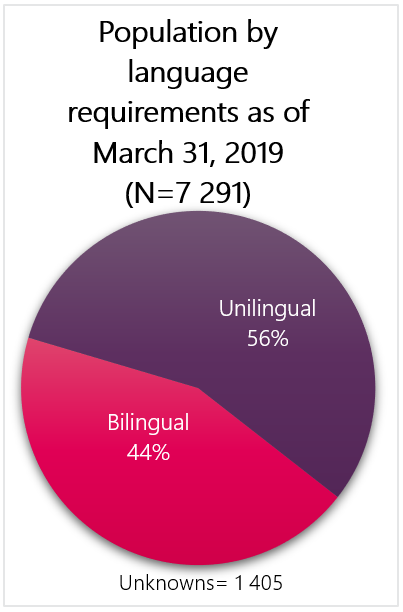
Linguistic requirements of the position |
Population as of March 31, 2019 |
Percentage of population as of March 31, 2019 |
|---|---|---|
Bilingual |
2 592 |
44% |
Unilingual |
3 294 |
56% |
Unknown |
1 405 |
0% |
Text Alternative
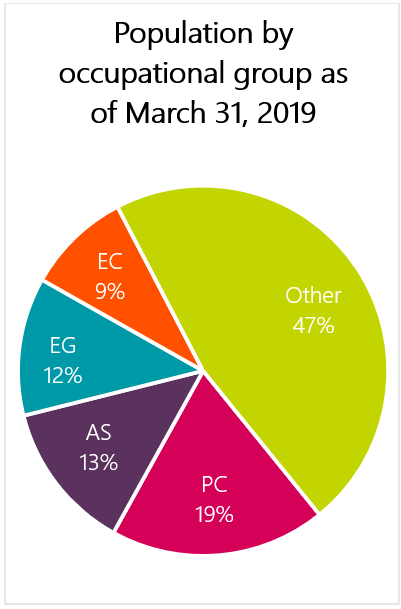
Occupational group |
Population as of March 31, 2019 |
Percentage of population as of March 31, 2019 |
|---|---|---|
PC – Physical Sciences |
1 299 |
19% |
AS – Administrative Services |
898 |
13% |
EG – Engineering and Scientific Support |
831 |
12% |
EC – Economics and Social Science Services |
630 |
9% |
Other |
3 221 |
47% |
Text Alternative
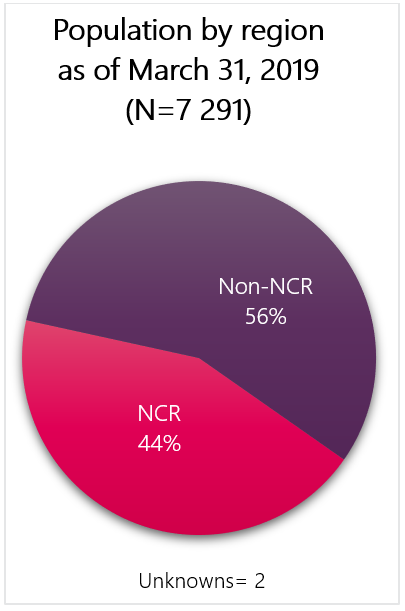
Region |
Population as of March 31, 2019 |
Percentage of population as of March 31, 2019 |
|---|---|---|
National Capital Region (NCR) |
3 186 |
44% |
Non-NCR |
4 103 |
56% |
Unknown |
2 |
0% |
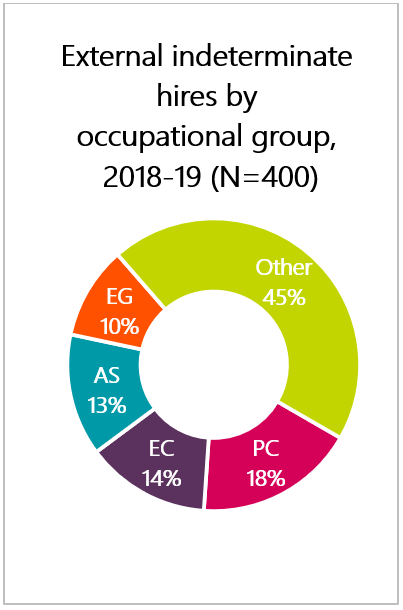
Text Alternative
Occupational group |
Number of indeterminate hiring activities |
Percentage of all indeterminate hiring activities |
|---|---|---|
PC – Physical Sciences |
71 |
18% |
EC – Economics and Social Science Services |
55 |
14% |
AS – Administrative Services |
54 |
14% |
EG – Engineering and Scientific Support |
41 |
10% |
Other |
179 |
45% |
Total |
400 |
100% |
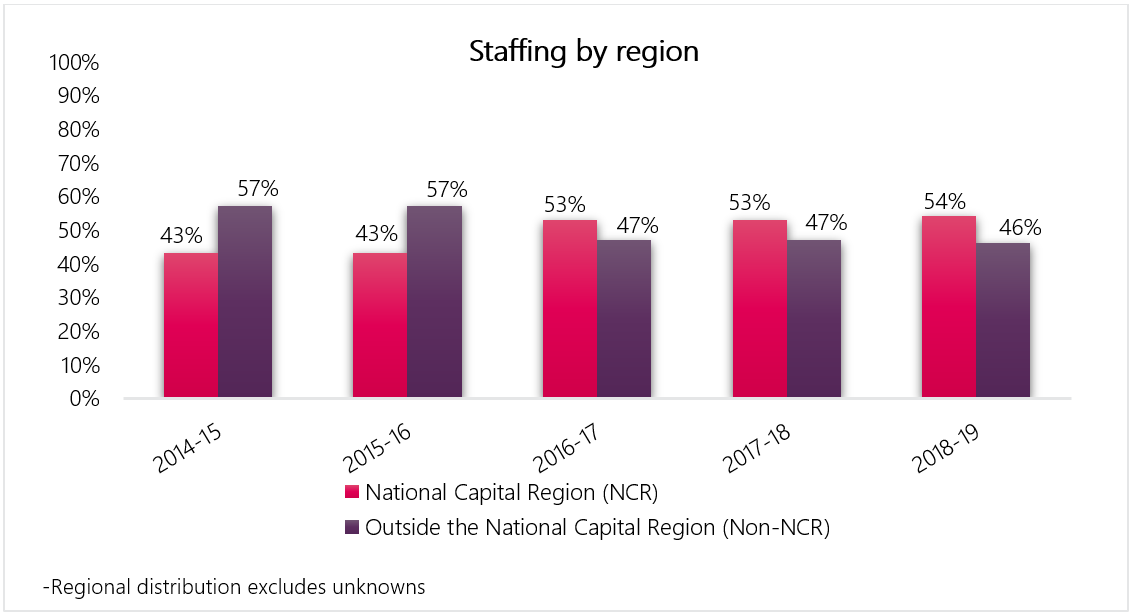
Text Alternative
Fiscal year |
% of staffing activities in the National Capital Region (NCR) |
% of staffing activities in all other regions (Non-NCR) |
|---|---|---|
2014 to 2015 |
43% |
57% |
2015 to 2016 |
43% |
57% |
2016 to 2017 |
53% |
47% |
2017 to 2018 |
53% |
47% |
2018 to 2019 |
54% |
46% |
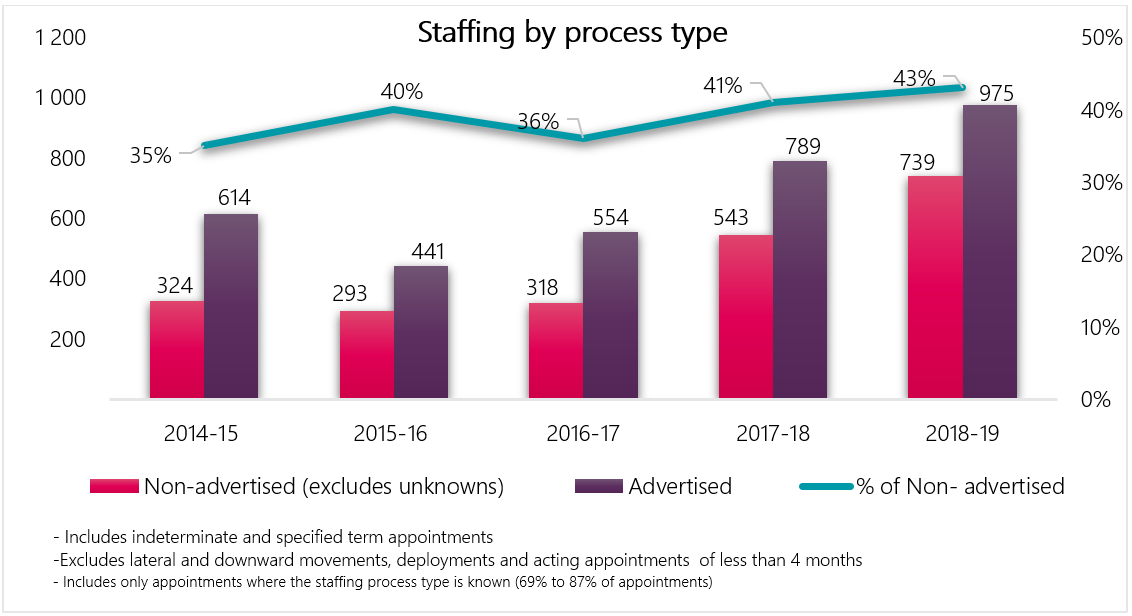
Text Alternative
Fiscal year |
Non-advertised processes (excludes unknowns) |
Advertised processes |
% of Non- advertised processes |
|---|---|---|---|
2014 to 2015 |
324 |
614 |
35% |
2015 to 2016 |
293 |
441 |
40% |
2016 to 2017 |
318 |
554 |
36% |
2017 to 2018 |
543 |
789 |
41% |
2018 to 2019 |
739 |
975 |
43% |
- Includes indeterminate and specified term appointments
- Excludes lateral and downward movements, deployments and acting appointments of less than 4 months
- Includes only appointments where the staffing process type is known (69% to 87% of appointments)
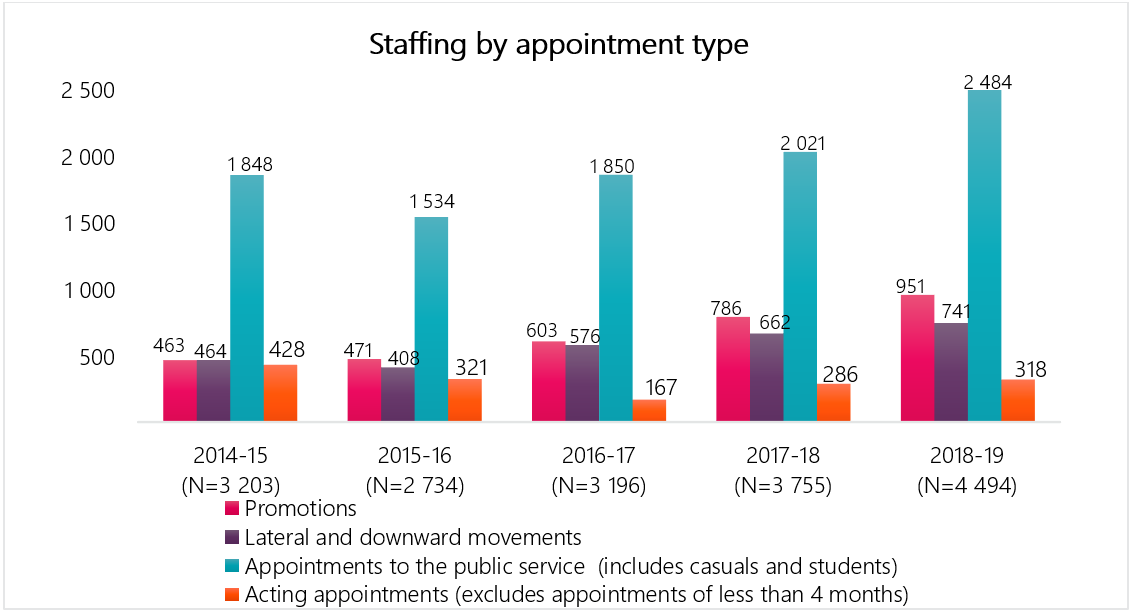
Text Alternative
Fiscal year |
Promotions |
Lateral and downward movements |
Appointments to the public service (includes casuals and students) |
Acting appointments (excludes appointments of less than 4 months) |
Total |
|---|---|---|---|---|---|
2014 to 2015 |
463 |
464 |
1 848 |
428 |
3 203 |
2015 to 2016 |
471 |
408 |
1 534 |
321 |
2 734 |
2016 to 2017 |
603 |
576 |
1 850 |
167 |
3 196 |
2017 to 2018 |
786 |
662 |
2 021 |
286 |
3 755 |
2018 to 2019 |
951 |
741 |
2 484 |
318 |
4 494 |
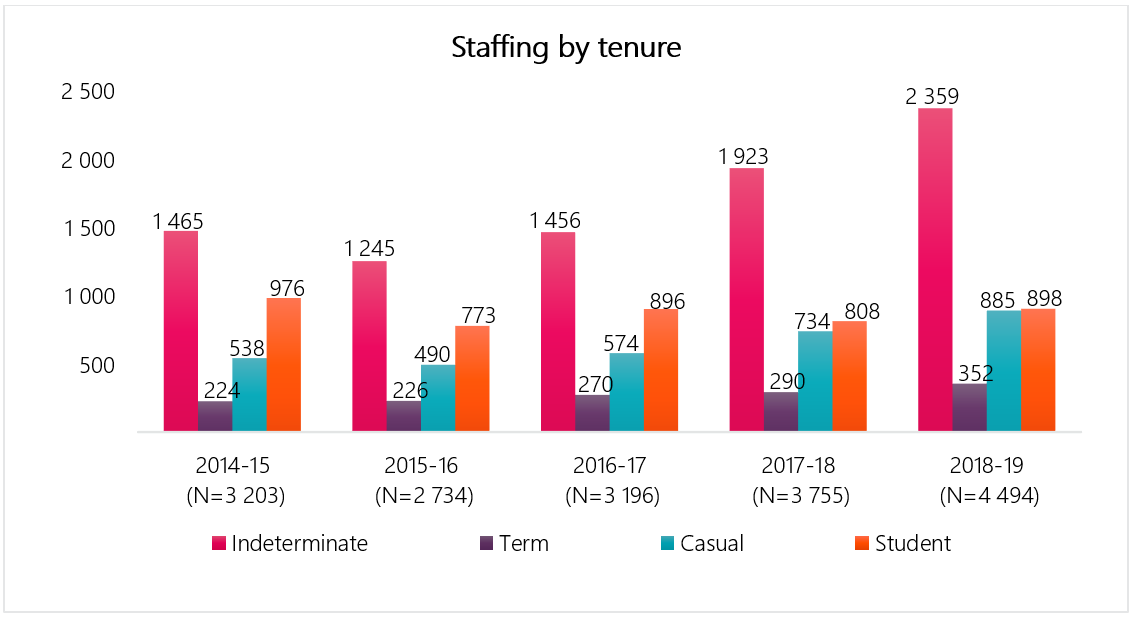
Text Alternative
Fiscal year |
Indeterminate staffing activities |
Term staffing activities |
Casual staffing activities |
Student staffing activities |
Total staffing activities |
|---|---|---|---|---|---|
2014 to 2015 |
1 465 |
224 |
538 |
976 |
3 203 |
2015 to 2016 |
1 245 |
226 |
490 |
773 |
2 734 |
2016 to 2017 |
1 456 |
270 |
574 |
896 |
3 196 |
2017 to 2018 |
1 923 |
290 |
734 |
808 |
3 755 |
2018 to 2019 |
2 359 |
352 |
885 |
898 |
4 494 |
Key findings - Staffing and non-partisanship survey (2018)
- 66.7% of employees agreed that people hired can do the job, compared to 52.3% in organizations of similar size, and 53.8% in the federal public service
- 53.4% of managers agreed that the New Direction in Staffing has improved the way they hire and appoint persons to and within their organization, compared to 54.4% in organizations of similar size, and 56.1% in the federal public service
- 89.6% of managers agreed that within their organization, the administrative to staff a position is burdensome, compared to 88.6% in organizations of similar size, and 87.9% in the federal public service.
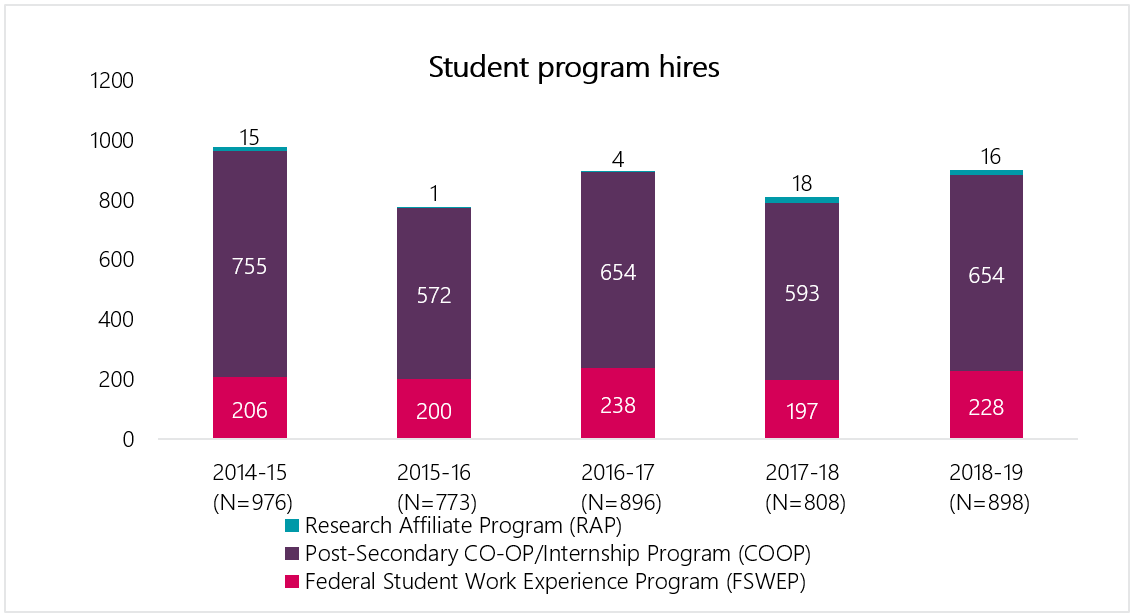
Text Alternative
Fiscal year |
Federal Student Work Experience Program |
Post-Secondary Co-op/Internship Program |
Research Affiliate Program |
Total |
|---|---|---|---|---|
2014 to 2015 |
206 |
755 |
15 |
976 |
2015 to 2016 |
200 |
572 |
1 |
773 |
2016 to 2017 |
238 |
654 |
4 |
896 |
2017 to 2018 |
197 |
593 |
18 |
808 |
2018 to 2019 |
228 |
654 |
16 |
898 |
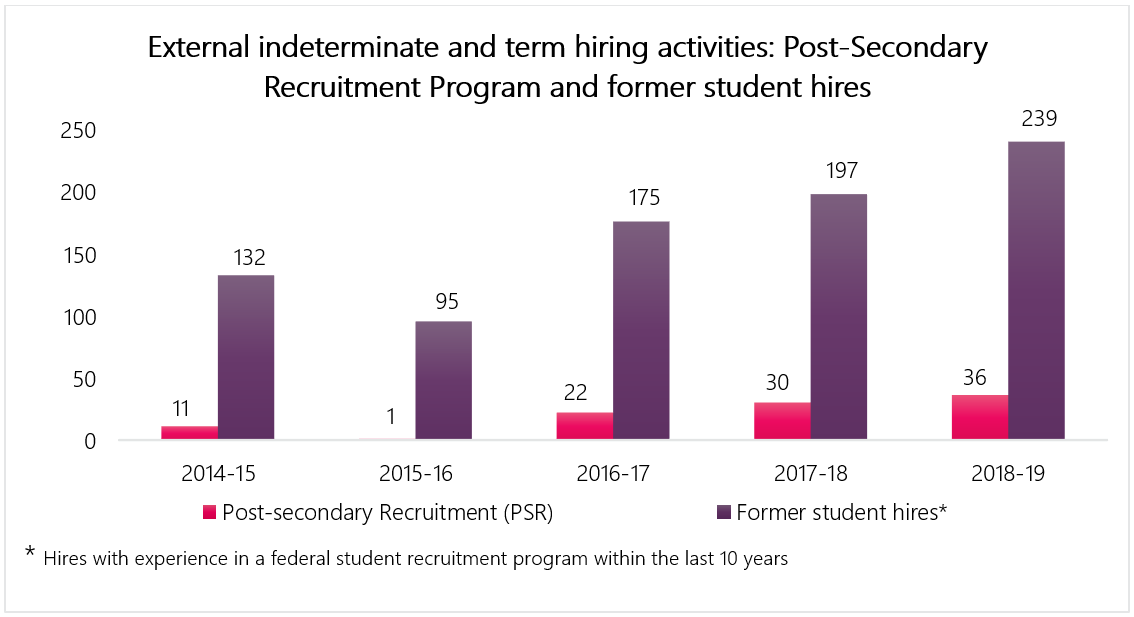
Text Alternative
Fiscal year |
Post-Secondary Recruitment Program hires |
Hiring of former students |
2014 to 2015 |
11 |
132 |
2015 to 2016 |
1 |
95 |
2016 to 2017 |
22 |
175 |
2017 to 2018 |
30 |
197 |
2018 to 2019 |
36 |
239 |
Hiring of former students includes indeterminate and term hires with experience in a federal student recruitment program within the last 10 years.
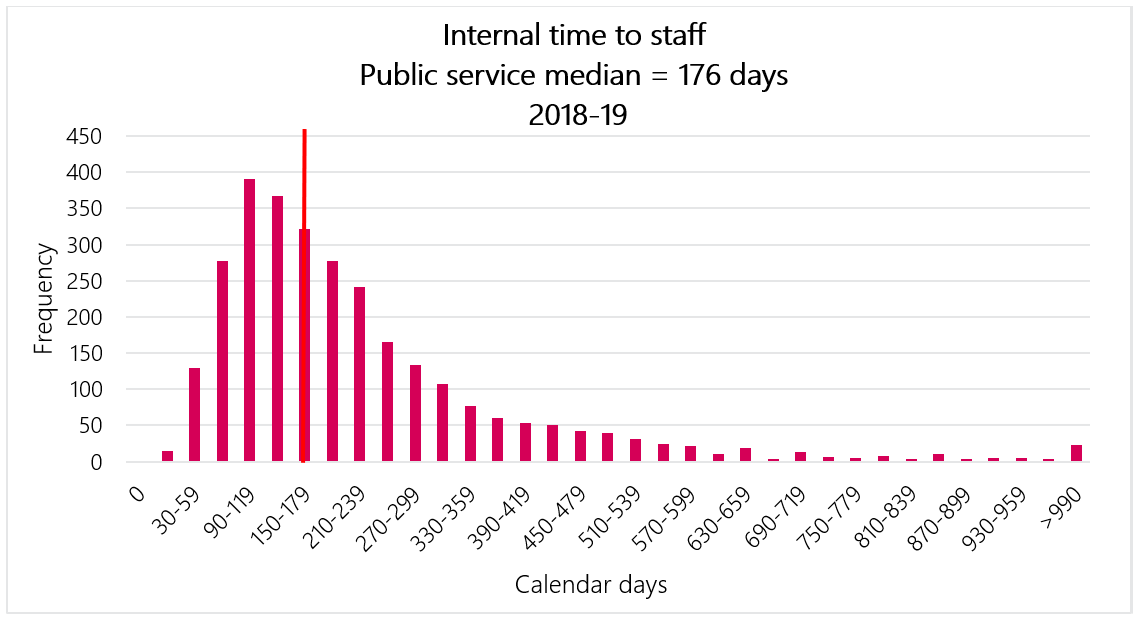
Text Alternative
Number of calendar days |
The number of internal appointments for which the TTS-IA was within the specified number of calendar days for organizations subject to the Public Service Employment Act |
The number of internal appointments for which the TTS-IA was within the specified number of calendar days for the specified organization |
|---|---|---|
0 calendar days |
0 |
0 |
0 to 29 calendar days |
15 |
0 |
30 to 59 calendar days |
130 |
3 |
60 to 89 calendar days |
277 |
12 |
90 to 119 calendar days |
391 |
19 |
120 to 149 calendar days |
367 |
20 |
150 to 179 calendar days |
322 |
10 |
180 to 209 calendar days |
278 |
19 |
210 to 239 calendar days |
241 |
22 |
240 to 269 calendar days |
165 |
10 |
270 to 299 calendar days |
134 |
6 |
300 to 329 calendar days |
107 |
4 |
330 to 359 calendar days |
77 |
4 |
360 to 389 calendar days |
61 |
2 |
390 to 419 calendar days |
53 |
5 |
420 to 449 calendar days |
51 |
2 |
450 to 479 calendar days |
42 |
2 |
480 to 509 calendar days |
40 |
2 |
510 to 539 calendar days |
32 |
4 |
540 to 569 calendar days |
24 |
2 |
570 to 599 calendar days |
21 |
2 |
600 to 629 calendar days |
11 |
0 |
630 to 659 calendar days |
19 |
2 |
660 to 689 calendar days |
3 |
0 |
690 to 719 calendar days |
13 |
1 |
720 to 749 calendar days |
6 |
2 |
750 to 779 calendar days |
5 |
0 |
780 to 809 calendar days |
8 |
0 |
810 to 839 calendar days |
4 |
0 |
840 to 869 calendar days |
10 |
0 |
870 to 899 calendar days |
4 |
0 |
900 to 929 calendar days |
5 |
0 |
930 to 959 calendar days |
5 |
0 |
960 to 989 calendar days |
3 |
0 |
More than 990 calendar days |
23 |
2 |
Internal time to staff is calculated as the number of calendar days between the opening date of the advertisement and the date of the first notification.
Internal time to staff for fiscal year 2018 to 2019
The median internal time to staff for the public service (organizations subject to the Public Service Employment Act) for fiscal year 2018 to 2019 is 176 days. Environment and Climate Change Canada’s median internal time to staff for fiscal year 2018 to 2019 is 202 days.
Text Alternative
Number of calendar days |
The number of external appointment processes for which the TTS-EA was within the specified number of calendar days for organizations subject to the Public Service Employment Act |
The number of external appointments for which the TTS-IA was within the specified number of calendar days for the specified organization |
|---|---|---|
0 calendar days |
0 |
0 |
0 to 29 calendar days |
49 |
1 |
30 to 59 calendar days |
82 |
0 |
60 to 89 calendar days |
124 |
4 |
90 to 119 calendar days |
160 |
3 |
120 to 149 calendar days |
181 |
4 |
150 to 179 calendar days |
179 |
8 |
180 to 209 calendar days |
160 |
6 |
210 to 239 calendar days |
139 |
5 |
240 to 269 calendar days |
84 |
2 |
270 to 299 calendar days |
73 |
2 |
300 to 329 calendar days |
61 |
2 |
330 to 359 calendar days |
41 |
1 |
360 to 389 calendar days |
43 |
2 |
390 to 419 calendar days |
49 |
1 |
420 to 449 calendar days |
35 |
2 |
450 to 479 calendar days |
22 |
2 |
480 to 509 calendar days |
27 |
1 |
510 to 539 calendar days |
1 |
0 |
540 to 569 calendar days |
7 |
0 |
570 to 599 calendar days |
15 |
0 |
600 to 629 calendar days |
14 |
1 |
630 to 659 calendar days |
12 |
0 |
660 to 689 calendar days |
7 |
1 |
690 to 719 calendar days |
5 |
0 |
720 to 749 calendar days |
7 |
0 |
750 to 779 calendar days |
11 |
0 |
780 to 809 calendar days |
3 |
0 |
810 to 839 calendar days |
7 |
0 |
840 to 869 calendar days |
2 |
0 |
870 to 899 calendar days |
2 |
0 |
900 to 929 calendar days |
0 |
0 |
930 to 959 calendar days |
3 |
0 |
960 to 989 calendar days |
1 |
0 |
More than 990 calendar days |
0 |
0 |
External time to staff is calculated as the number of calendar days between the opening date of the advertisement and the date of the first estimated external hire.
External time to staff for fiscal year 2018 to 2019
The median external time to staff for the public service (organizations subject to the Public Service Employment Act) for fiscal year 2018 to 2019 is 186 days. Environment and Climate Change Canada’s median external time to staff for fiscal year 2018 to 2019 is 195 days.
Technical Notes:
- The Time to Staff - Internal Appointments (TTS-IA) is the median number of calendar days between the opening date of an internal advertisement and the date of the first Notice of Appointment or Proposal of Appointment (NAPA) from the Public Service Resourcing System for internal term and indeterminate positions. As NAPAs are not required for all internal staffing actions, this measure is limited to reporting on internal promotional appointments
- Only estimated term and indeterminate appointments/notifications are included (deployments, casual and acting appointments are excluded)
- The Time to Staff - External Appointments (TTS-EA) is the median number of calendar days between the opening date of an external advertisement and the date of the first estimated appointment of an individual from outside an organization subject to the Public Service Employment Act for term and indeterminate positions. Only estimated term and indeterminate appointments/notifications are included (deployments, casual and acting appointments are excluded)
- Because data between systems is linked using a probabilistic match, errors in data linkage are a potential source of measurement error
Sources:
- Hiring and staffing activities data are derived from information received from the Treasury Board of Canada Secretariat Incumbent File. The Incumbent File is extracted from the Public Services and Procurement Canada’s pay system. The data constitutes an estimate of hiring and staffing activities to and within organizations
- Information from the Priority Information Management System and the Public Services Resourcing System is also used to determine if staffing actions are advertised or non-advertised as well as for calculating time to staff
- The data are not expected to match an organization’s human resources data, due to methodology and timing differences