
President meeting with David McGovern, President, Impact Assessment Agency of Canada November 28, 2019
Introduction
Deputy Head
Mr. David McGovern was appointed as the President, Impact Assessment Agency of Canada (IAAC) on August 28, 2019. This organization was formerly named the Canadian Environmental Assessment Agency (CEAA).
Mr. McGovern is exercising the Public Service Commission’s (PSC) authority for the first time as DH. A copy of the New Direction in Staffing (NDS) highlights for DHs is attached as Annex A.
Organizational Context
Mandate
On August 28, 2019, the Impact Assessment Act, the Canadian Energy Regulator Act, and the Canadian Navigable Waters Act came into force. The Impact Assessment Act created the new IAAC (formerly known as the CEAA). This change repeals the Canadian Environmental Assessment Act, created in 2012.
The IAAC is a federal body accountable to the Minister of Environment and Climate Change.
The IAAC delivers high-quality impact assessments that contribute to informed decision-making on major environmental projects, in support of sustainable development. Through its delivery of impact assessments, the IAAC serves Canadians by looking at both positive and negative environmental, economic, social and health impacts of potential projects of federal interest.
More specifically, the IAAC:
- Leads and manages the impact assessment process for all federally designated major projects;
- Leads Crown engagement and serves as the single point of contact for consultation and engagement with Indigenous peoples during impact assessments for designated projects;
- Provides opportunities and funding to support public participation in impact assessments;
- Works to ensure that mitigation measures are applied and are working as intended;
- Promotes uniformity and coordination of impact assessment practices across Canada through research, guidance and ongoing discussion with stakeholders and partners; and
- Works with a range of international jurisdictions and organizations to exchange best practices in terms of impact assessment.
The IAAC works with other bodies like the Canadian Energy Regulator (formerly the National Energy Board), the Canadian Nuclear Safety Commission, Offshore Boards and other federal departments and agencies. The IAAC also works in cooperation with provinces and territories, Indigenous jurisdictions, environmental organizations and industry.
Challenges
Ensuring steady growth of the organization as a result of legislative changes in support of new impact assessment and regulatory processes will be a challenge due to the current scarcity of competent labor market talent and resources in the area of impact assessment on climate change.
For 2019-2020, the IAAC plans to have 446 FTEs, an increase of 117 employees from March 31, 2019.
Experimentation
In support of the organization’s need to increase flexibilities on matters of staffing, a presentation regarding the use of performance assessments in the context of staffing was conducted by the Staffing Support Advisor (SSA) in February 2019. As such, the previous CEAA and the new IAAC is continuing to plan to apply performance appraisals as a common assessment method (for competencies assessment and validation) for all upcoming appointment processes.
Population and Staffing Activities
Population
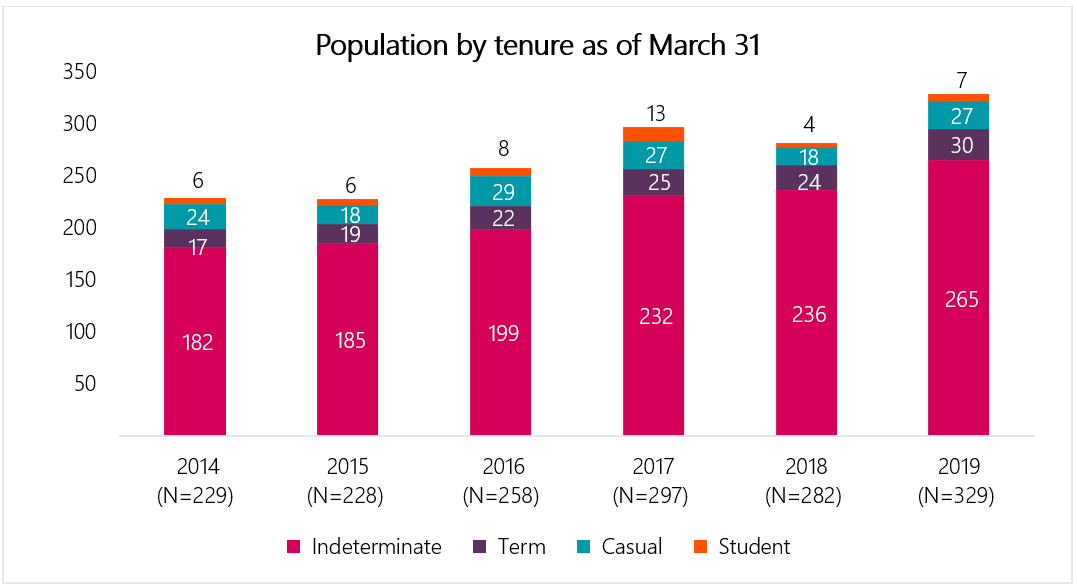
The IAAC (formerly the CEAA-will be referenced herein for the purposes of data sourcing in support of this briefing) is a small organization that has a population of 329 employees as of March 31, 2019.
Staffing Activities
In 2018-2019, the CEAA processed a total of 284 staffing actions composed of the following:
- 136 appointments to the public service (includes casual and students);
- 64 promotions;
- 32 acting appointments (excluding appointments less than 4 months); and
- 52 lateral and downward movements.
Please refer to Annex B for additional details on staffing activities.
Time to Staff
The median time of the public service for internal appointment processes is 176 days and for external appointments processes, it is 186 days.
The data is insufficient for providing results on internal and external processes times for the Impact Assessment Agency of Canada.
Staffing Framework
New Direction in Staffing Implementation
The CEAA has had a Policy on the Appointment Process which includes the use of advertised and non-advertised processes, the articulation of selection decision and a section on the area of selection. This policy came into effect on April 13, 2016. The SSA has been informed that the former CEAA staffing policies will be adapted to reflect the new name and scope of mandate of the new IAAC.
The CEAA had their sub-delegation instrument revised by PSC representatives and the latest version of this instrument was approved in May 2016.
In terms of monitoring, the PSC met with the CEAA on November 10, 2018, to discuss monitoring for staffing. The SSA shared some information with regards to ongoing monitoring and cyclical assessment reporting in April 2019. The CEAA indicated at that time that they planned on reviewing their monitoring framework for staffing activities in the near future.
As it is for all new Deputy Heads, the new IAAC President has full discretion to review and update these staffing instruments to reflect current and emerging needs of the organization.
Appointment Delegation and Accountability Instrument Annex D Reporting
Use of the Public Service Official Languages Exclusion Approval Order and the Public Service Official Languages Appointment Regulations
The CEAA reported that the organization made no use of the Public Service Official Languages Exclusion Approval Orderand one use of the Public Service Official Languages Appointment Regulationsfor the period of April 1, 2018, and March 31, 2019. The PSC is supporting the organization on the management of the outstanding case.
Approved Deputy Head Exceptions to the National Area of Selection Requirements for External Advertised Appointment Process
The CEAA reported one exceptionto the National Area of Selection approved by the DH. The exception was approved in support of an external advertised PC-03 process. The organization anticipated sufficient candidates in the St. John’s area who would meet the education and the experience requirements.
Inquiries and Trends
Since the implementation of the NDS, the CEAA’s human resources advisors have consulted the PSC on a variety of topics, mostly regarding assessment, the Appointment Delegation and Accountability Instrument (ADAI) and the Appointment Policy. The CEAA has demonstrated openness and willingness to share their tools with other organizations. Other topics of discussion between the CEAA and the SSA involved the articulation of the selection decision, the hiring of former students, reassessing official languages within the same appointment process and questions surrounding sub-delegated authorities and its conditions.
Oversight
Audits
No audits have occurred for both the IAAC and the CEAA since NDS. However, the PSC did conduct an audit of the CEAA in 2013 (pre-NDS). In November 2016, the PSC determined that it was satisfied with the CEAA’s progress in implementing the audit recommendations.
As a smaller organization, the IAAC may consult the PSC on the possibility of establishing an arrangement to generate a cyclical assessment report on its behalf, as per section 3 of the ADAI. It is our understanding, however, that the organization plans to conduct and submit their cyclical assessment report by May 1, 2021.
Investigations
Between September 2016 and September 2019, one case of fraud has been referred to the PSC, from the CEAA. This case was unfounded and the file closed.
Nature of Issue |
Cases |
Cases Referred by Organization |
Closed – |
Completed |
Completed |
Ongoing |
|---|---|---|---|---|---|---|
s.66 External Appointments (Merit, Error, Omission, Improper Conduct) |
0 |
0 |
0 |
0 |
0 |
0 |
s.67.2 Internal Appointment - Deputy Head Request |
0 |
0 |
0 |
0 |
0 |
0 |
s.68 Political Influence |
0 |
0 |
0 |
0 |
0 |
0 |
s.69 Fraud |
1 |
1 |
0 |
1 |
0 |
0 |
s.118 Improper Political Activities - Employees |
0 |
0 |
0 |
0 |
0 |
0 |
Total |
1 |
1 |
0 |
1 |
0 |
0 |
Note: The numbers may not add up as discontinued cases, cases resolved via early intervention and rare cases (s.119, s.67.1) are not included in this table.
Note: Each column is an independent calculation of the others. Cases received are cases received in the time period, cases completed are those completed in the period, not necessarily cases completed out of those received.
Staffing and Non-Partisanship Survey Results
Overall, the CEAA’s Staffing and Non-Partisanship Survey (SNPS) results are generally more favourable in comparison to other small organizations and the public service overall.
Below are some of the key findings of the CEAA SNPS results:
- 84% of employees indicated that people hired in their work unit can do the job, as compared to 67.1% in similar size organizations and 53.8% across all organizations in the federal public service;
- 81.7% of managers agreed that the NDS has improved the way they hire and appoint persons to and within their organization as compared to 69.7% in similar size organizations and 56.1% across all organizations in the federal public service;
- 79% of managers feel staffing is burdensome, as compared to 79.3% in similar size organizations and 87.9% across all organizations in the federal public service;
- 39% of managers agreed that they felt external pressure to select a particular employee, as compared to 9% in similar size organizations and 12.7% across all organizations in the federal public service;
- 0% of managers felt a sense of personal indebtedness to one or more employees, as compared to 5.5% in similar size organizations and 6.4% across all organizations in the federal public service; and
- 27.2% of managers’ reported no or minimal understanding of the provisions that help veterans gain employment in the federal public service, as compared to 30.4% in similar size organizations and 34.2% across all organizations in the federal public service.
Diversity Profile
Employment Equity
Using data from 2017-2018, the statistics reveal that the CEAA was above public service workforce availability for women and Aboriginals. However, gaps were observed for persons with disabilities and visible minorities. The representativeness of the four designated groups will have to be reviewed once the new data on the Public Service Work Force Availability are released in 2019.
Designated Group |
Impact Assessment Agency of Canada (IAAC)* |
Representation across the |
|---|---|---|
Women |
65.1% |
54.8% |
Aboriginal Peoples |
6.2% |
5.1% |
Persons with Disabilities |
3.5% |
5.3% |
Members of Visible Minorities |
10.5% |
15.7% |
Source: Employment Equity in the Public Service of Canada 2017- 2018 Treasury Board of Canada Secretariat.
*IAAC replaced the Canadian Environmental Assessment Agency on August 28, 2019. Consequently, data provided is for the latter. The following analysis applies to IAAC.
The following array of solutions may be useful as the IAAC continues to build a representative and diverse workforce:
The Public Service Employment Act includes provisions that enable managers to:
- Target designated group members through the area of selection for advertised appointment processes;
- Establish and apply an organizational need to appoint designated group members; and
- Use external and internal non-advertised appointment to appoint designated group members.
The PSC offers recruitment solutions that target designated group members such as:
- Request referrals of designated group members when using student programs such as the FSWEP and Post-Secondary Co-op and Internship Program, with a plan that could include eventually recruiting students into the public service;
- Advertising through the student program Research Affiliate Program to recruit students of designated group members; and
- Request referrals of designated group members when using certain inventories, such as Post-Secondary Recruitment.
Priority Entitlements and Veterans
The IAAC currently has two (2) persons with priority entitlement (PPE) identified in the Priority Information Management System. Both have been identified as Leave of Absence Returnee Priorities. Since April 1, 2018, the CEAA appointed one (1) PPE. This PPE was an employee of this organization and as such, had a statutory priority entitlement.
Since the coming into force of the Veterans Hiring Act on July 1, 2015, priority persons with a former Canadian Armed Forces member entitlement have yet to be appointed to a position within the organization.
From April 1, 2018 to September 5, 2019, the CEAA submitted 309 requests for priority clearance.
Non-Partisanship in the Public Service
The IAAC’s Designated Political Activities Representative is Elaine Mignault. Over the years, the PSC has not received many political candidacy requests from the CEAA employees. Since April 1, 2015, the PSC has not received nor processed any requests from the organization in this regard.
The 2018 Staffing and Non-partisanship Survey results indicate that the CEAA employees' level of awareness regarding their legal rights and responsibilities for engaging in political activities is 84.1%, compared to 80.1% for the public service as a whole
PSC Initiatives
The IAAC has participated and submitted requests for the employment opportunity for Aboriginal students and employment opportunity for students with disabilities. In summary, the organization hired:
- In 2016-2017, 2 Aboriginal students;
- In 2019-2020, 1 Aboriginal student and 1 student with disabilities.
The IAAC has not participated in the Federal internship program for Canadians with disabilities (FIPCD). Although the FIPCD is at-capacity at this time, there will be opportunities for new clients/organizations to participate in cohorts planned for 2020/21.
Staffing Support
Public Service Commission Representatives and Organizational Contacts
The SSA assigned to this organization is Caroline Fortin-Beaudry. The Head of Human Resources is Sylvain Campeau, Director, Human Resources and the main organizational contact is Marie-Claude Lemieux, Manager, Human Resources.
Prepared by:
Caroline Fortin-Beaudry,
Staffing Support Advisor
Annexes:
- Annex A – The New Direction in Staffing (NDS) highlights for DHs
- Annex B - Data on Population and Staffing Activities
Annex A
A New direction in Staffing – A merit-based system that is effective, efficient and fair
Appointment Policy
New focus on core requirements to provide sub-delegated persons greater discretion in making an appointment
- One Appointment Policy, no duplication with legal requirements
- Broader focus on values-based system, away from rules-based system
- Appointments Policy supported by streamlined guidance:
- A roadmap to the requirements in legislation, regulations and policy
- Options and considerations for decision-making where there is discretion
- Clear expectations for priority entitlements
- No restrictions to assessment methods for EX appointments
- Exceptions to National Area of Selection approved by deputy head
Delegation
- New ability to customize organizational staffing system based on unique context and evolving business needs
- Deputy head establish a direction on the use of advertised and non-advertised appointment processes
- Deputy heads to establish requirement(s) for sub-delegated persons to articulate, in writing, their selection decision
- Clarity on requirements related to investigations
- Attestation form to reinforce the accountabilities of sub-delegated persons
All PSC monitoring and reporting requirements now found in the Appointment Delegation and Accountability Instrument
Monitoring and Reporting
Monitoring built by organizations, targeted to their needs
- Annual Departmental Staffing Accountability Report no longer required
- Annual reporting to the PSC limited to:
- Use of Public Service Official Language Exclusion Approval Order
- Exceptions to the National Area of Selection approved by the deputy head
- Results of any internal investigations
- Actions taken following any PSC investigations or audits.
- Deputy head responsible for ongoing monitoring of organizational staffing system based on the organization’s unique context
- Assessment of adherence to requirements, based on organization’s own risks, at the minimum every five years
PSC Oversight
System wide-focus
- Government-wide compliance audit every two years
- Renewed Survey of Staffing administered in alternating years with government-wide audit
- System-wide effectiveness and efficiency reviews to support continuous improvement
- Targeted PSC audits as a result of identified system-wide or organizational risks or at the deputy head request
- Investigations conducted when there is a reason to believe there was political influence, fraud or improper conduct in an appointment process
This document should be read in conjunction with the Public Service Employment Act, the Public Service Employment Regulations, the PSC Appointment Policy and the PSC Appointment Delegation and Accountability Instrument.
Annex B
Text version
Year |
Indeterminate |
Term |
Casual |
Student |
Total |
|---|---|---|---|---|---|
As of March 31, 2014 |
182 |
17 |
24 |
6 |
229 |
As of March 31, 2015 |
185 |
19 |
18 |
6 |
228 |
As of March 31, 2016 |
199 |
22 |
29 |
8 |
258 |
As of March 31, 2017 |
232 |
25 |
27 |
13 |
297 |
As of March 31, 2018 |
236 |
24 |
18 |
4 |
282 |
As of March 31, 2019 |
265 |
30 |
27 |
7 |
329 |

Text version
Linguistic requirements of the position |
Population as of March 31, 2019 |
Percentage of population as of March 31, 2019 |
Bilingual |
149 |
57% |
Unilingual |
112 |
43% |
Unknown |
68 |
|

Text version
Occupational group |
Population as of March 31, 2019 |
Percentage of population as of March 31, 2019 |
|---|---|---|
PC – Physical Sciences |
114 |
35% |
EC – Economics and Social Science Services |
55 |
17% |
AS – Administrative Services |
39 |
12% |
CR – Clerical and Regulatory |
25 |
8% |
Other |
89 |
28% |
Text version
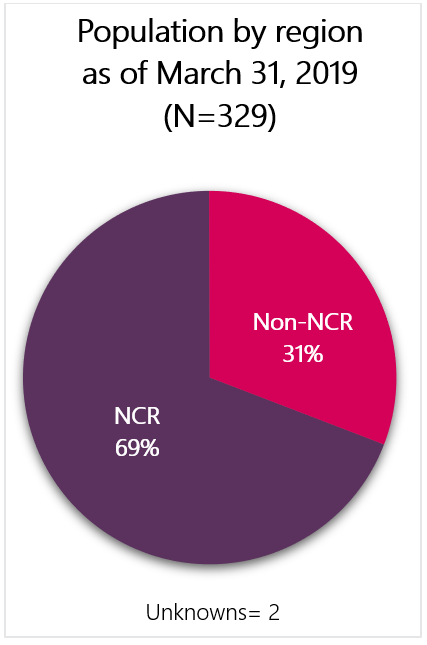
Region |
Population as of March 31, 2019 |
Percentage of population as of March 31, 2019 |
|---|---|---|
National Capital Region (NCR) |
226 |
69% |
Non-NCR |
101 |
31% |
Unknown |
2 |
|
Text version
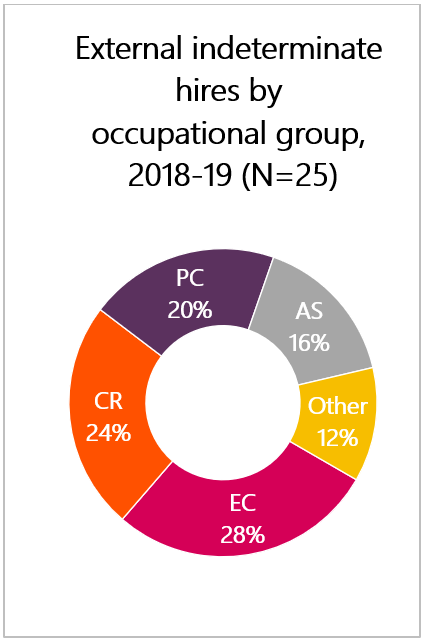
Occupational group |
Number of indeterminate hiring activities |
Percentage of all indeterminate hiring activities |
|---|---|---|
EC – Economics and Social Science Services |
7 |
28% |
CR – Clerical and Regulatory |
6 |
24% |
PC – Physical Sciences |
5 |
20% |
AS – Administrative Services |
4 |
16% |
Other |
3 |
12% |
Total |
25 |
100% |
Text version
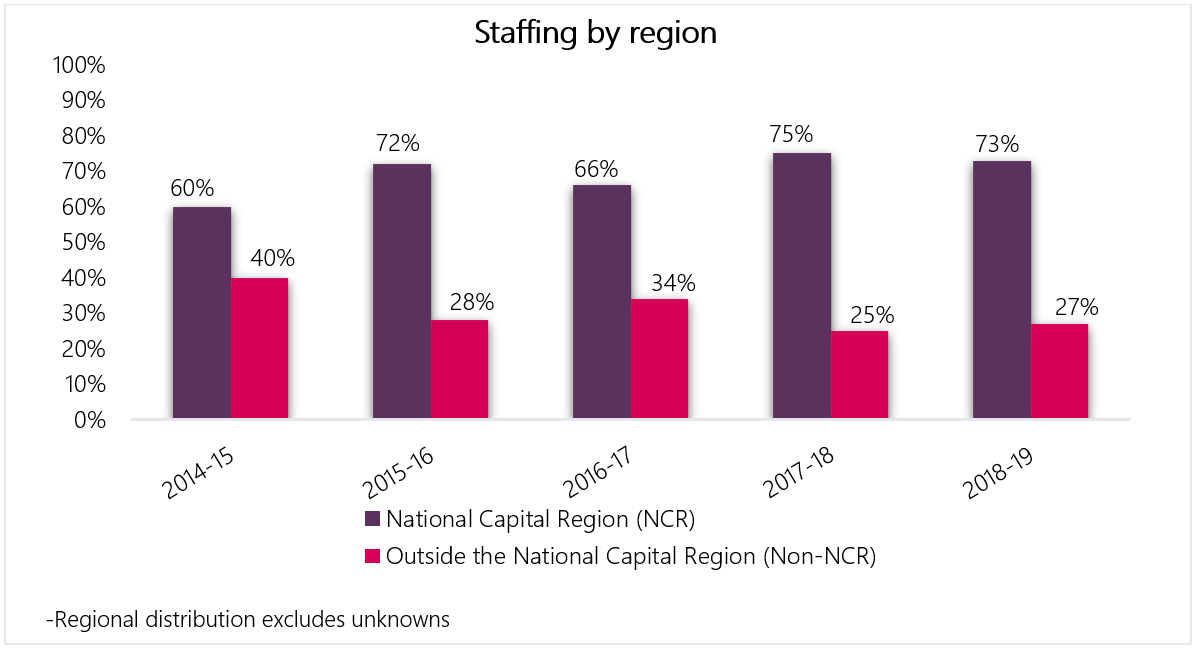
Fiscal year |
Percentage of staffing activities in the National Capital Region (NCR) |
Percentage of staffing activities in all other regions (Non-NCR) |
|---|---|---|
2014 to 2015 |
60% |
40% |
2015 to 2016 |
72% |
28% |
2016 to 2017 |
66% |
34% |
2017 to 2018 |
75% |
25% |
2018 to 2019 |
73% |
27% |
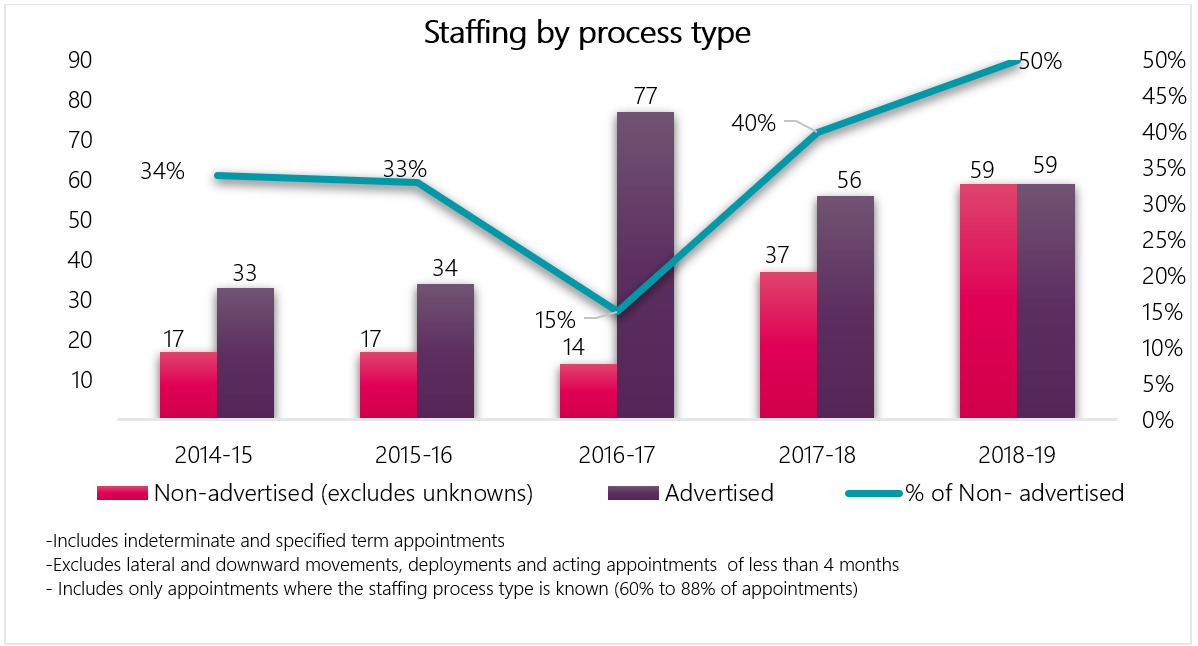
Text version
Fiscal year |
Non-advertised processes (excludes unknowns) |
Advertised processes |
% of Non- advertised processes |
|---|---|---|---|
2014 to 2015 |
17 |
33 |
34% |
2015 to 2016 |
17 |
34 |
33% |
2016 to 2017 |
14 |
77 |
15% |
2017 to 2018 |
37 |
56 |
40% |
2018 to 2019 |
59 |
59 |
50% |
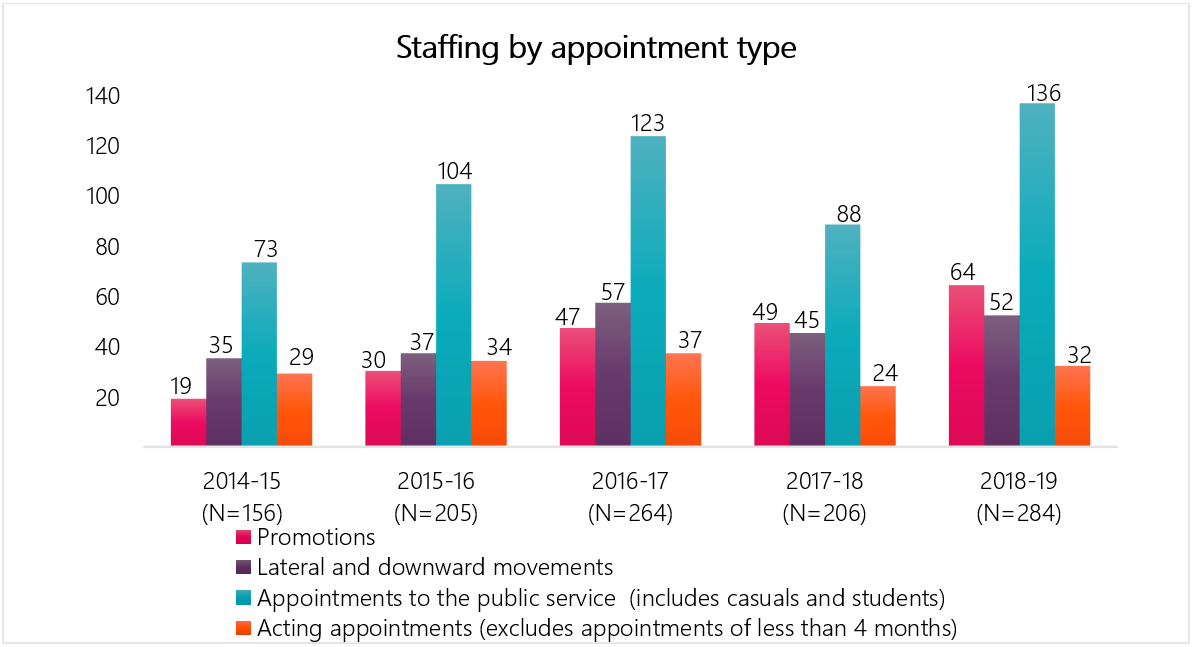
Text version
Fiscal year |
Promotions |
Lateral and downward movements |
Appointments to the public service (includes casuals and students) |
Acting appointments (excludes appointments of less than 4 months) |
Total |
|---|---|---|---|---|---|
2014 to 2015 |
19 |
35 |
73 |
29 |
156 |
2015 to 2016 |
30 |
37 |
104 |
34 |
205 |
2016 to 2017 |
47 |
57 |
123 |
37 |
264 |
2017 to 2018 |
49 |
45 |
88 |
24 |
206 |
2018 to 2019 |
64 |
52 |
136 |
32 |
284 |

Text version
Fiscal year |
Indeterminate staffing activities |
Term staffing activities |
Casual staffing activities |
Student staffing activities |
Total staffing activities |
|---|---|---|---|---|---|
2014 to 2015 |
75 |
22 |
42 |
17 |
156 |
2015 to 2016 |
97 |
25 |
61 |
22 |
205 |
2016 to 2017 |
147 |
39 |
55 |
23 |
264 |
2017 to 2018 |
128 |
23 |
39 |
16 |
206 |
2018 to 2019 |
166 |
41 |
53 |
24 |
284 |
Key findings - Staffing and non-partisanship survey (2018)
- 84.0% of employees agreed that people hired can do the job, compared to 67.1% in organizations of similar size, and 53.8% in the federal public service
- 81.7% of managers agreed that the New Direction in Staffing has improved the way they hire and appoint persons to and within their organization, compared to 69.7% in organizations of similar size, and 56.1% in the federal public service
- 79.0% of managers agreed that within their organization, the administrative to staff a position is burdensome, compared to 79.3% in organizations of similar size, and 87.9% in the federal public service
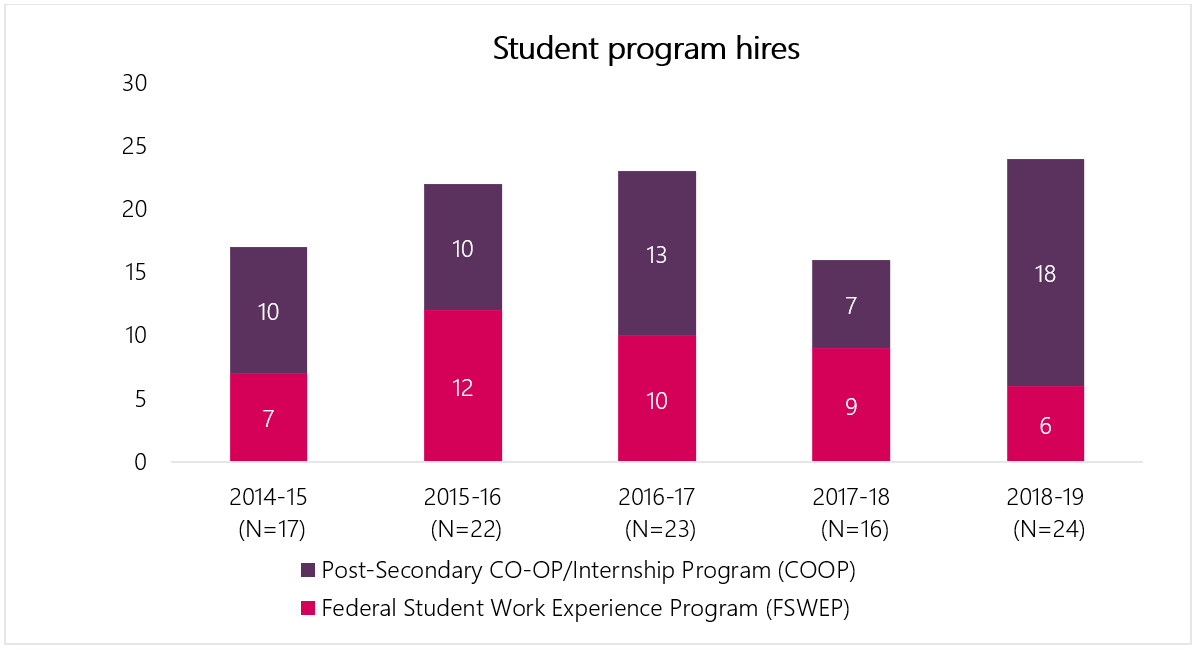
Text version
Fiscal year |
Federal Student Work Experience Program |
Post-Secondary Co-op/Internship Program |
Research Affiliate Program |
Total |
|---|---|---|---|---|
2014 to 2015 |
7 |
10 |
0 |
17 |
2015 to 2016 |
12 |
10 |
0 |
22 |
2016 to 2017 |
10 |
13 |
0 |
23 |
2017 to 2018 |
9 |
7 |
0 |
16 |
2018 to 2019 |
6 |
18 |
0 |
24 |
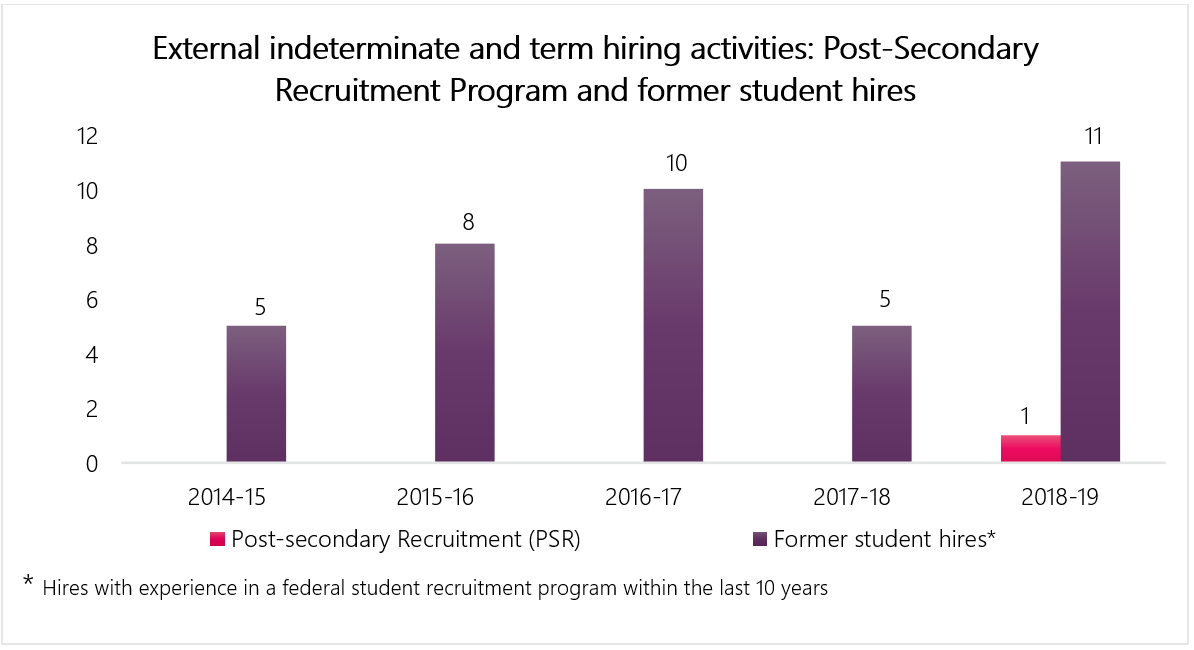
Text version
Fiscal year |
Post-Secondary Recruitment Program hires |
Hiring of former students |
|---|---|---|
2014 to 2015 |
0 |
5 |
2015 to 2016 |
0 |
8 |
2016 to 2017 |
0 |
10 |
2017 to 2018 |
0 |
5 |
2018 to 2019 |
1 |
11 |
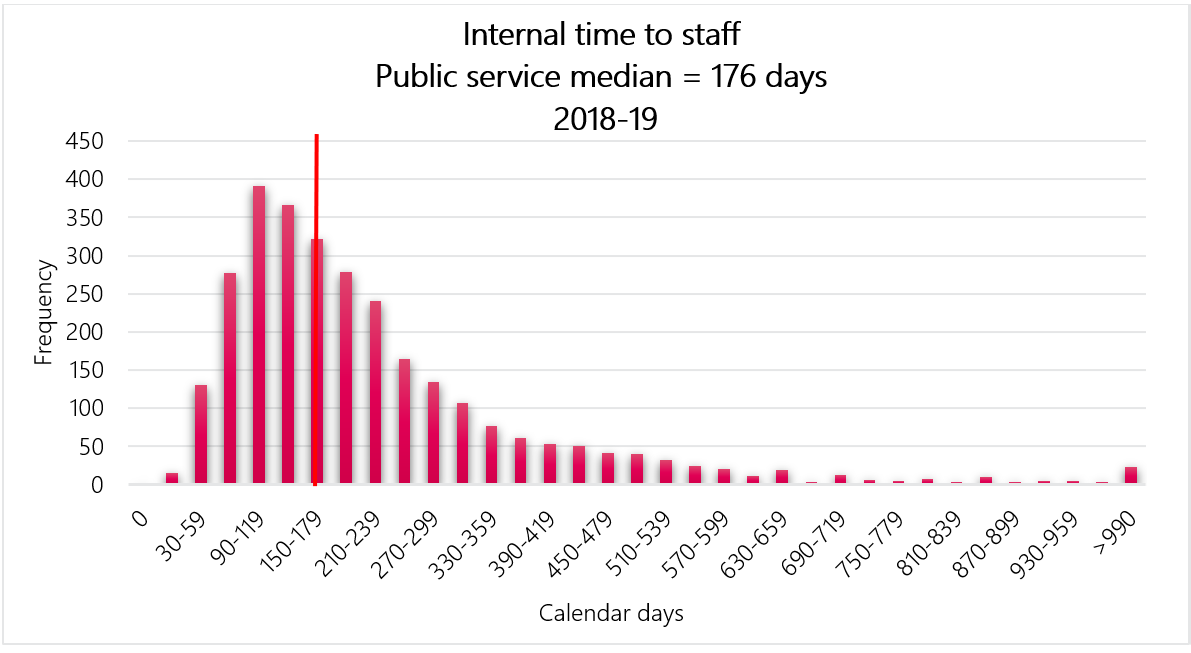
Internal Time to Staff
The data is insufficient for providing results on internal process times for the Impact Assessment Agency of Canada.
Internal time to staff is calculated as the number of calendar days between the opening date of the advertisement and the date of the first notification.
Internal time to staff for fiscal year 2018 to 2019
The median internal time to staff for the public service (organizations subject to the Public Service Employment Act) for fiscal year 2018 to 2019 is 176 days.
The data is insufficient for providing results on internal process times for the Impact Assessment Agency of Canada
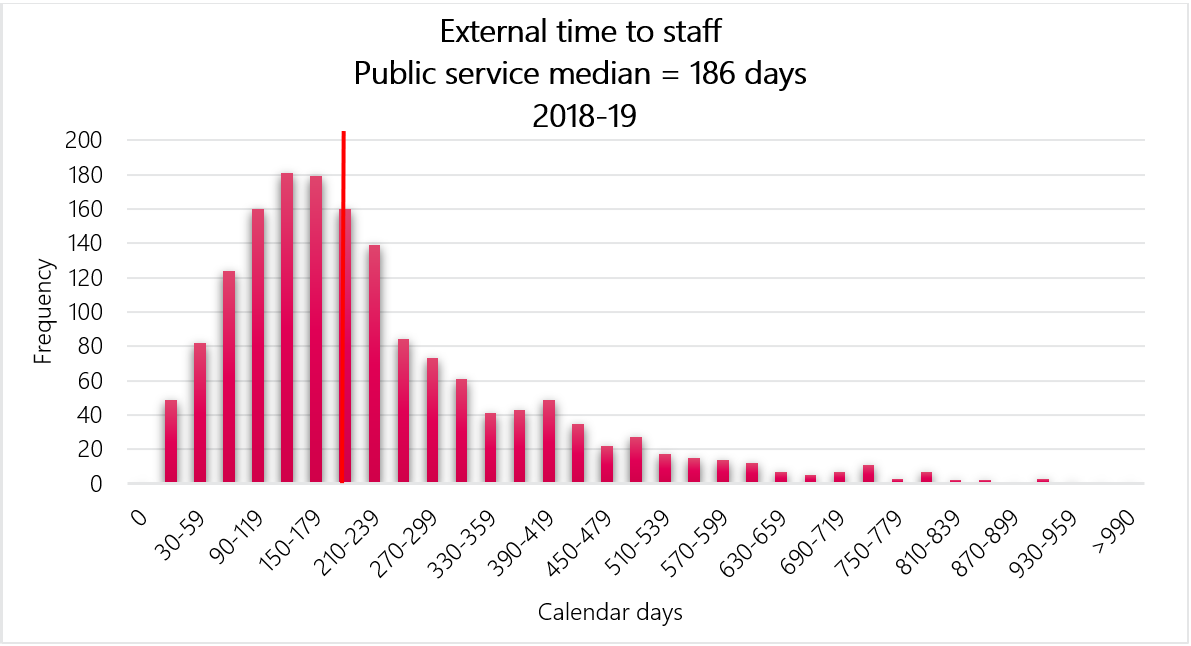
External Time to Staff
The data is insufficient for providing results on external process times for the Impact Assessment Agency of Canada.
External time to staff is calculated as the number of calendar days between the opening date of the advertisement and the date of the first estimated external hire.
External time to staff for fiscal year 2018 to 2019
The median external time to staff for the public service (organizations subject to the Public Service Employment Act) for fiscal year 2018 to 2019 is 186 days.
The data is insufficient for providing results on external process times for the Impact Assessment Agency of Canada.
Text version
Number of calendar days |
The number of internal appointments for which the TTS-IA was within the specified number of calendar days for organizations subject to the Public Service Employment Act |
The number of external appointment processes for which the TTS-EA was within the specified number of calendar days for organizations subject to the Public Service Employment Act |
|---|---|---|
0 calendar days |
0 |
0 |
0 to 29 calendar days |
15 |
49 |
30 to 59 calendar days |
130 |
82 |
60 to 89 calendar days |
277 |
124 |
90 to 119 calendar days |
391 |
160 |
120 to 149 calendar days |
367 |
181 |
150 to 179 calendar days |
322 |
179 |
180 to 209 calendar days |
278 |
160 |
210 to 239 calendar days |
241 |
139 |
240 to 269 calendar days |
165 |
84 |
270 to 299 calendar days |
134 |
73 |
300 to 329 calendar days |
107 |
61 |
330 to 359 calendar days |
77 |
41 |
360 to 389 calendar days |
61 |
43 |
390 to 419 calendar days |
53 |
49 |
420 to 449 calendar days |
51 |
35 |
450 to 479 calendar days |
42 |
22 |
480 to 509 calendar days |
40 |
27 |
510 to 539 calendar days |
32 |
17 |
540 to 569 calendar days |
24 |
15 |
570 to 599 calendar days |
21 |
14 |
600 to 629 calendar days |
11 |
12 |
630 to 659 calendar days |
19 |
7 |
660 to 689 calendar days |
3 |
5 |
690 to 719 calendar days |
13 |
7 |
720 to 749 calendar days |
6 |
11 |
750 to 779 calendar days |
5 |
3 |
780 to 809 calendar days |
8 |
7 |
810 to 839 calendar days |
4 |
2 |
840 to 869 calendar days |
10 |
2 |
870 to 899 calendar days |
4 |
0 |
900 to 929 calendar days |
5 |
3 |
930 to 959 calendar days |
5 |
1 |
960 to 989 calendar days |
3 |
0 |
More than 990 calendar days |
23 |
0 |
Technical Notes
- The Time to Staff - Internal Appointments (TTS-IA) is the median number of calendar days between the opening date of an internal advertisement and the date of the first Notice of Appointment or Proposal of Appointment (NAPA) from the Public Service Resourcing System for internal term and indeterminate positions. As NAPAs are not required for all internal staffing actions, this measure is limited to reporting on internal promotional appointments
- Only estimated term and indeterminate appointments/notifications are included (deployments, casual and acting appointments are excluded)
- The Time to Staff - External Appointments (TTS-EA) is the median number of calendar days between the opening date of an external advertisement and the date of the first estimated appointment of an individual from outside an organization subject to the Public Service Employment Act for term and indeterminate positions. Only estimated term and indeterminate appointments/notifications are included (deployments, casual and acting appointments are excluded)
- Because data between systems is linked using a probabilistic match, errors in data linkage are a potential source of measurement error
Sources
- Hiring and staffing activities data are derived from information received from the Treasury Board of Canada Secretariat Incumbent File. The Incumbent File is extracted from the Public Services and Procurement Canada’s pay system. The data constitutes an estimate of hiring and staffing activities to and within organizations.
- Information from the Priority Information Management System and the Public Services Resourcing System is also used to determine if staffing actions are advertised or non-advertised as well as for calculating time to staff.
- The data are not expected to match an organization’s human resources data, due to methodology and timing differences.