
President meeting with Ms. Kristina Namiesniowski, President Public Health Agency of Canada September 13, 2019
Introduction
Deputy Head
Ms. Kristina Namiesniowski was appointed as the President of the Public Health Agency of Canada (PHAC), effective May 6, 2019.
As Ms. Namiesniowski is exercising the Public Service Commission’s (PSC) authority for the first time as Deputy Head (DH). A copy of the New Direction in Staffing (NDS) highlights for DHs is attached as Annex A.
Deputy Minister University Champion
Ms. Namiesniowski is not a Deputy Minister University Champion.
Organizational Context
Mandate
The PHAC helps protect the health and safety of all Canadians. Its activities focus on preventing chronic diseases, such as cancer and heart disease, preventing injuries, and responding to public health emergencies and infectious disease outbreaks. The PHAC is responsible for emergency preparedness and response for issuing public health notices, and for immunization and vaccines. Through research, programs and services, the PHAC’s goals are to bring about healthier Canadians, reduced health disparities, and a stronger capacity to deliver on and support public health activities. As part of the PHAC’s program activities, it uses grants and contributions to fund community, volunteer and not-for-profit agencies to support government policies and priorities.
Challenges
In its 2019-2020 departmental plan, the PHAC focuses on three aspects of public health: health promotion and chronic disease prevention; infectious disease prevention and control; and health security.
To achieve expected results, the organization is seeking to attract and retain the best possible medical and scientific candidates. As the PHAC is competing with other governments and the industry, hiring and promotion practices are continuously reviewed. As the more classic recruitment approaches proved to be a deterrent to valuable candidates, the organization is looking at more innovative and simplified application procedures, and using talent management to promote individuals, as it is the practice by employers in scientific and medical industries.
The PHAC will continue to examine the level of resources required for priority initiatives. The organization does not foresee any major staffing initiative nor does it anticipate any group specific initiatives.
The PHAC is in search of the best and brightest public health specialists and pandemic prevention authorities. In the recruitment of these professionals, obtaining timely confirmation of bilingualism and recognition of foreign education credentials has been a challenge.
The PHAC must also ensure an agile approach to recruitment when facing with emergency situations.
Experimentation
The PHAC is working on making talent management and performance appraisal practices more compatible for use in staffing processes, as valuable information to assess merit.
For the hiring of doctors (MD group), the PHAC has adapted its advertisement approach. They now simply ask candidates to submit their resume, and the hiring manager contacts them to ask for any pertinent additional information. Putting the responsibility on the hiring manager has increased the number of applying candidates for the MD group. The approach has proven successful, leading to increased recruitment.
Population and Staffing Activities
Population
The PHAC is a large organization that has a population of 2,395 employees as of March 31, 2019.
Most of the PHAC’s employees are located in the National Capital Region. It also has a large regional presence in Manitoba, Ontario, Quebec, the Prairies and Western provinces. The relatively high employee population in Manitoba is explained with the location of the Winnipeg Common Business Centre for Infectious Disease Prevention and Control.
Please refer to annex B for additional details on staffing activities.
Staffing Activities
In 2018-2019, the PHAC proceeded with a total of 1,383 staffing activities (excluding appointments of less than 4 months):
Types of staffing action:
- 728 appointments to the public service;
- 242 promotions;
- 230 lateral and downward movements; and
- 183 acting appointments.
Tenure:
- 717 Indeterminate appointments;
- 160 Term appointments;
- 253 casuals; and
- 253 students.
Time to Staff
The PHAC has a median time of 213 days for internal appointments, which is higher than the median of the public service, which is 176 days.
The data is insufficient for providing results on external appointments for the PHAC, and to compare it to the public service median of 186 days.
Staffing Framework
New Direction in Staffing Implementation
As the PHAC is becoming more familiar in experimenting the NDS, there is less risk aversion from HR advisors and hiring managers. The organization is currently reviewing all its staffing training modules, and has developed a train the trainer program to have their staff deliver NDS information sessions to managers and staff within the PHAC.
The organization would like to continue implementing the NDS culture, and help more HR advisors to think “outside the box”, and foster creativity in staffing processes. To support this cultural change, the PHAC has implemented a “Safe Space” innovation corner to give all HR advisors of the organization across Canada to share their ideas. The goal is to foster innovation and fight the aversion for creativity.
The PHAC staffing policies (direction for the choice of appointment process, policy on the area of selection, and requirements for the articulation of the selection decision) were updated in 2016 following NDS.
As part of an overall department policy review initiative that will occur in 2019, the PHAC is planning to take this opportunity to refresh their staffing policies. They have identified a need to better clarify the DH direction on the choice of appointment process and provide additional guidance to hiring managers concerning advertised and non-advertised appointment processes.
In February 2019, at the request of the organization, the PSC examined the PHAC’s sub-delegation instruments. The PSC identified some compliance issues. PHAC’s HR services Directorate implemented PSC’s suggestions when updating their sub-delegation instruments, which was approved by the PHAC’s president in June 2019 further to a final review by the PSC.
The PSC also identified areas for improvement in terms of simplicity, efficiency and effectiveness with their current sub-delegation instrument. While the PHAC is not ready to conduct a major review their instrument for efficiency purpose at this time, they are open to the PSC’s suggestions on how an instrument could be simplified in the future.
Appointment Delegation and Accountability Instrument Annex D Reporting
Use of the Public Service Official Languages Exclusion Approval Order and the Public Service Official Languages Appointment Regulations
The PHAC reported that the organization made no use of the Public Service Official Languages Exclusion Approval Order for the period of April 1, 2018 and March 31, 2019.
Approved Deputy Head Exceptions to the National Area of Selection Requirements for External Advertised Appointment Process
The PHAC reported not having used the DH exception to the National Area of Selection.
Results of Organizational Cyclical Assessment
The first PHAC cyclical assessment is due by May 1, 2021.
Inquiries and Trends
In 2018-2019, inquiries were concerning various staffing matters, with the largest portion of questions regarding assessment (16.2%), followed by questions on values (9.9%). The organization shows a high level of collaboration with the PSC as it relates to using the Staffing Support Advisor (SSA) support and advice.
Oversight
Audits
The PHAC had previously been identified for an organizational audit in the PSC’s 2015-2016 audit plan. Due to the transition to the new appointment policy framework, the PSC chose to complete a Staffing Assessment of the PHAC in lieu of an organizational audit. The purpose of this was to support the organization in implementing the NDS. The PSC completed this exercise in 2017, and concluded that the organization was on track for meeting the PSC’s appointment framework requirements stemming from the NDS. Further to this audit, the PHAC is monitoring areas considered more at risk and has implemented recommendations made by the PSC.
The PHAC was included in the pilot System-Wide Staffing Audit, for which the final report was published in December 2018. The PHAC was also one of the 15 organizations selected for the Horizontal Audit on Credential Validation. The final report of this audit was published in May 2019.
Investigations
Between April 1, 2017 and February 10, 2019, the PSC received 5 requests for investigations: 4 on external appointment processes and 1 on political activities.
The 4 cases on external processes were closed, and the case on political activity is still ongoing.
Public Health Agency of Canada |
Cases Received |
Cases Referred by Organization |
Closed - Not Accepted |
Completed Unfounded |
Completed Founded |
Ongoing |
|---|---|---|---|---|---|---|
s.66 External Appointments (Merit, Error, Omission, Improper Conduct) |
4 |
0 |
4 |
0 |
0 |
0 |
s.118 Improper Political Activities - Employees |
1 |
0 |
0 |
0 |
0 |
1 |
Total |
5 |
0 |
4 |
0 |
0 |
1 |
Note: The number of received cases may not add up to the number of completed/closed cases as completed/closed cases are not necessarily cases that were received in the same period. Some cases can also be discontinued or resolved via early intervention.
Staffing and Non-Partisanship Survey Results
The survey results for the PHAC shows that managers are less satisfied than similar size organizations and the overall public service concerning the quality of services they received from their HR advisor.
Below are key findings from the PHAC’s 2018 Staffing and Non-Partisanship Survey (SNPS) results:
- 59% of employees indicated that people hired in their work unit can do the job, as compared to 52.3% in similar size organizations and 53.8% across all organizations in the federal public service.
- 9.6% of managers agreed that that they felt external pressure to select a particular employee, as compared to 13.3% in similar size organizations and 12.7% across all organizations in the federal public service.
- 57.3% of managers reported understanding of the provisions that help veterans gain employment in the federal public service, as compared to 65.6% in similar size organizations and 65.8% across all organizations in the federal public service.
- 90.5% of managers felt that staffing is burdensome, as compared to 88.6% in similar size organizations and 87.9% across all organizations in the federal public service.
- 67.3% of managers feel staffing is not quick enough, as compared to 64.5% in similar size organizations and 62.4% across all organizations in the federal public service.
Diversity Profile
The organization is above workforce availability for women, persons with disabilities and members of visible minorities. However, the organization would like to focus on addressing certain employment equity gaps in specialized fields, such as in the MD and SE (Scientific Researchers) groups.
Aboriginal Peoples are under-represented at 3.1% of the Agency’s workforce, while the Public Service workforce availability is at 3.4%. The organization may wish to take action to close the gap to ensure ongoing representativeness of its workforce.
Designated Group |
Public Service |
Public Health Agency of Canada |
Representation across the Public Service of Canada |
New WFA 2019 |
|---|---|---|---|---|
Women |
52.5% |
68% |
54.8% |
52.6% |
Aboriginal Peoples |
3.4% |
3.1% |
5.1% |
4.0% |
Persons with Disabilities |
4.4% |
5.5% |
5.3% |
9.0% |
Members of Visible Minorities |
13.0% |
20.3% |
15.7% |
15.3% |
Source: Employment Equity in the Public Service of Canada 2017- 2018
Treasury Board of Canada Secretariat
Priority Entitlements and Veterans
As of April 15, 2019, the PHAC had registered 12 persons with priority entitlement.
From April 1, 2018 to March 31, 2019, the PHAC made 601 priority clearance requests and appointed 2 persons with priority entitlement.
The PHAC has not appointed any medically released veterans with a priority entitlement since July 1, 2015.
Priority Type |
Carry-Over from Previous FY |
New Cases |
Total |
Appointed |
Resigned / Retired |
Expired |
Organization Rescinded |
* Other Removal |
Priority Type Updates |
Active at run date of report |
|---|---|---|---|---|---|---|---|---|---|---|
Leave of absence Returnee - PSEA 41(1)(a) |
10 |
2 |
12 |
0 |
0 |
0 |
0 |
0 |
0 |
13 |
Reinstatement - PSER 10 |
0 |
1 |
1 |
0 |
0 |
0 |
0 |
0 |
0 |
1 |
Relocation of Spouse - PSER 9 |
2 |
1 |
3 |
0 |
0 |
0 |
0 |
0 |
1 |
2 |
Total |
12 |
4 |
16 |
0 |
0 |
0 |
0 |
0 |
1 |
16 |
Note: This table represents a snapshot in time. Any discrepancies between the individual values and the totals results from the system data not being updated in real time.
*Appointments made of organization’s own priority population either within or to other organizations.
Non-Partisanship in the Public Service
The PHAC employees are not active in regards to interactions with the PSC about political activities, compared to employees of other organizations. Only one PHAC employee requested permission, in 2018-2019, for a municipal election (not elected). Also, the on-line Self-Assessment Questionnaire was used about 20 times per year by employees of the PHAC, slightly less than the average 31 times for all organizations.
The results of the SNPS demonstrate that the PHAC employees have similar awareness and understanding of political activities and non-partisanship (89%) compared to the public service as a whole (88.9%).
PSC Initiatives
The organization participated in the Position-Specific Assessment for Oral Proficiency at the B Level.
Staffing Support
Public Service Commission Representatives and Organizational Contacts
The SSA assigned to this organization is Yannick Fortin. The Head of Human Resources is Daryl Gauthier, Director General, Human Resources Services Directorate and the primary organizational contact is Tammy Kardoes, Director, Staffing and Classification Policy Center.
Prepared by:
Yannick Fortin
Staffing Support Advisor
Annexes:
- Annex A – The New Direction in Staffing (NDS) highlights for DHs
- Annex B - Data on Population and Staffing Activities
Annex A
New direction in Staffing – A merit-based system that is effective, efficient and fair
Appointment Policy
New focus on core requirements to provide sub-delegated persons greater discretion in making an appointment
- One Appointment Policy, no duplication with legal requirements
- Broader focus on values-based system, away from rules-based system
- Appointments Policy supported by streamlined guidance:
- A roadmap to the requirements in legislation, regulations and policy
- Options and considerations for decision-making where there is discretion
- Clear expectations for priority entitlements
- No restrictions to assessment methods for EX appointments
- Exceptions to National Area of Selection approved by deputy head
Delegation
- New ability to customize organizational staffing system based on unique context and evolving business needs
- Deputy head establish a direction on the use of advertised and non-advertised appointment processes
- Deputy heads to establish requirement(s) for sub-delegated persons to articulate, in writing, their selection decision
- Clarity on requirements related to investigations
- Attestation form to reinforce the accountabilities of sub-delegated persons
All PSC monitoring and reporting requirements now found in the Appointment Delegation and Accountability Instrument
Monitoring and Reporting
Monitoring built by organizations, targeted to their needs
- Annual Departmental Staffing Accountability Report no longer required
- Annual reporting to the PSC limited to:
- Use of Public Service Official Language Exclusion Approval Order
- Exceptions to the National Area of Selection approved by the deputy head
- Results of any internal investigations
- Actions taken following any PSC investigations or audits.
- Deputy head responsible for ongoing monitoring of organizational staffing system based on the organization’s unique context
- Assessment of adherence to requirements, based on organization’s own risks, at the minimum every five years
PSC Oversight
System wide-focus
- Government-wide compliance audit every two years
- Renewed Survey of Staffing administered in alternating years with government-wide audit
- System-wide effectiveness and efficiency reviews to support continuous improvement
- Targeted PSC audits as a result of identified system-wide or organizational risks or at the deputy head request
- Investigations conducted when there is a reason to believe there was political influence, fraud or improper conduct in an appointment process
This document should be read in conjunction with the Public Service Employment Act, the Public Service Employment Regulations, the PSC Appointment Policy and the PSC Appointment Delegation and Accountability Instrument.
Annexe B
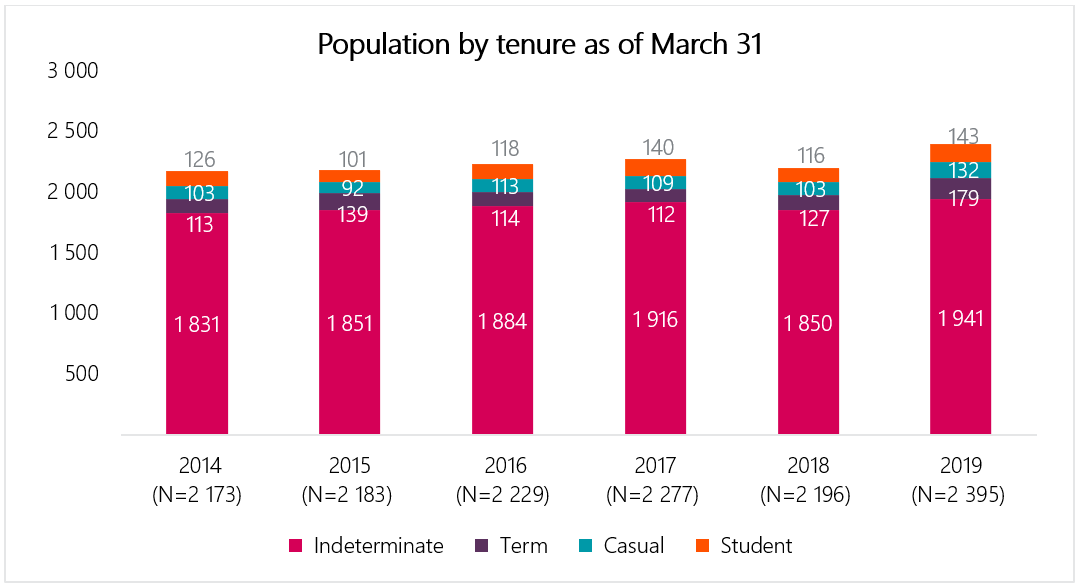
Text version
Year |
Indeterminate population |
Term population |
Casual population |
Student population |
Total population |
|---|---|---|---|---|---|
As of March 31, 2014 |
1 831 |
113 |
103 |
126 |
2 173 |
As of March 31, 2015 |
1 851 |
139 |
92 |
101 |
2 183 |
As of March 31, 2016 |
1 884 |
114 |
113 |
118 |
2 229 |
As of March 31, 2017 |
1 916 |
112 |
109 |
140 |
2 277 |
As of March 31, 2018 |
1 850 |
127 |
103 |
116 |
2 196 |
As of March 31, 2019 |
1 941 |
179 |
132 |
143 |
2 395 |
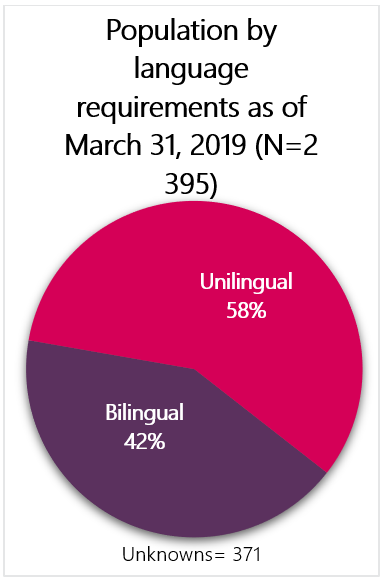
Text version
Linguistic requirements of the position |
Population as of March 31, 2019 |
Percentage of population as of March 31, 2019 |
|---|---|---|
Bilingual |
854 |
42% |
Unilingual |
1 170 |
58% |
Unknown |
371 |
|
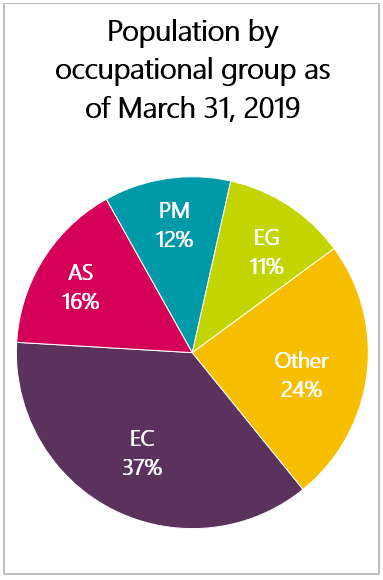
Text version
Occupational group |
Population as of March 31, 2019 |
Percentage of population as of March 31, 2019 |
|---|---|---|
EC – Economics and Social Science Services |
828 |
37% |
AS – Administrative Services |
359 |
16% |
PM – Programme administration |
262 |
12% |
EG – Engineering and Scientific Support 257 11% |
257 |
11% |
Other |
546 |
24% |
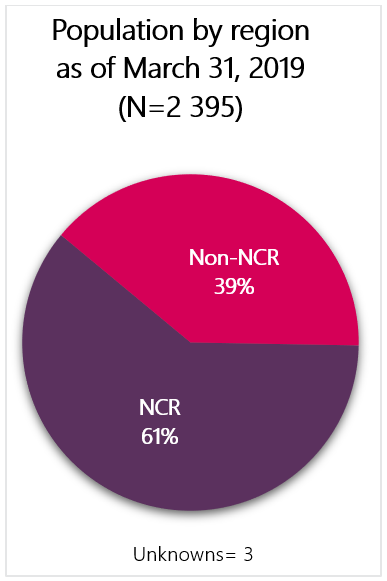
Text version
Region |
Population as of March 31, 2019 |
Percentage of population as of March 31, 2019 |
|---|---|---|
National Capital Region (NCR) |
1 453 |
61% |
Non-NCR |
939 |
39% |
Unknown |
3 |
|
Text version
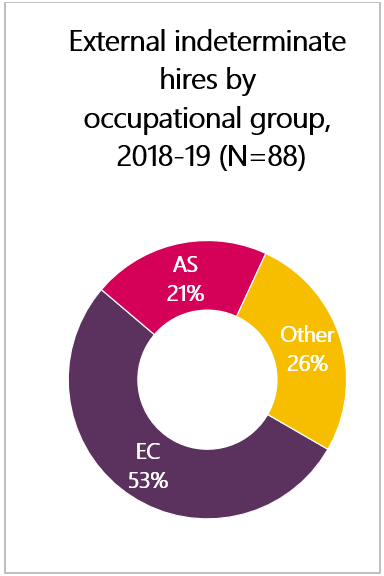
Occupational group |
Number of indeterminate hiring activities |
Percentage of all indeterminate hiring activities |
|---|---|---|
EC – Economics and Social Science Services |
46 |
52% |
AS – Administrative Services 18 21% |
18 |
21% |
Other |
23 |
26% |
Total |
88 |
100% |
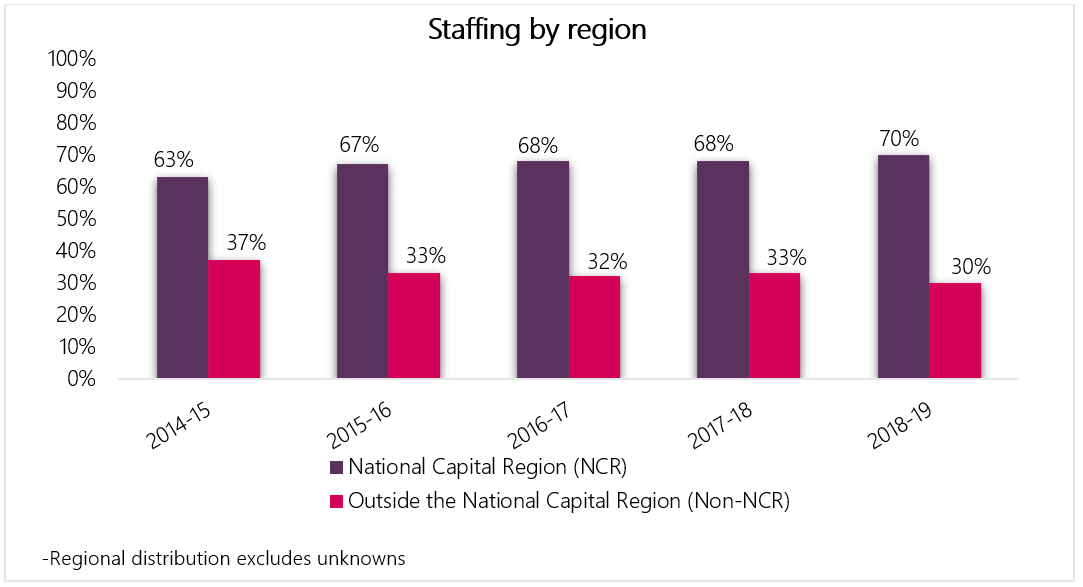
Text version
Fiscal year |
Percentage of staffing activities in the National Capital Region (NCR) |
Percentage of staffing activities in all other regions (Non-NCR) |
|---|---|---|
2014 to 2015 |
63% |
37% |
2015 to 2016 |
67% |
33% |
2016 to 2017 |
68% |
32% |
2017 to 2018 |
68% |
32% |
2018 to 2019 |
70% |
30% |
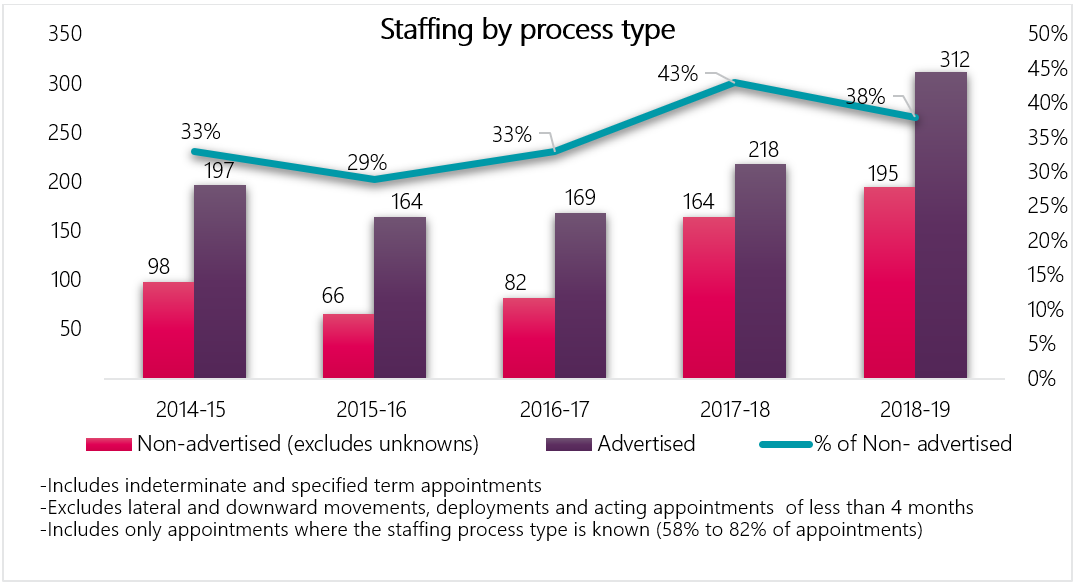
Text version
Fiscal year |
Non-advertised processes (excludes unknowns) |
Advertised processes |
% of Non- advertised processes |
|---|---|---|---|
2014 to 2015 |
98 |
197 |
33% |
2015 to 2016 |
66 |
164 |
29% |
2016 to 2017 |
82 |
169 |
33% |
2017 to 2018 |
164 |
218 |
43% |
2018 to 2019 |
195 |
312 |
38% |
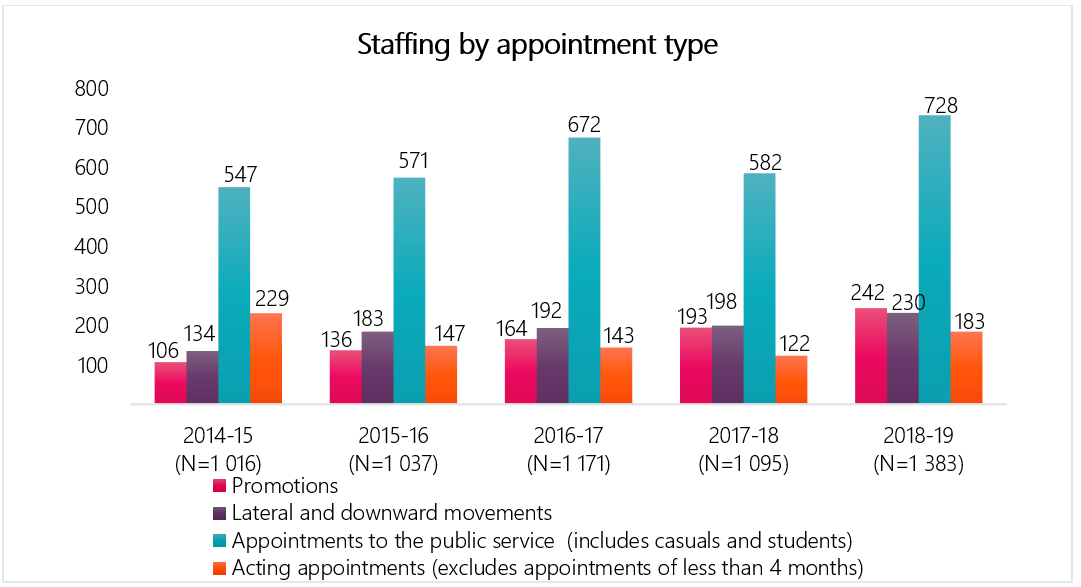
Text version
Fiscal year |
Promotions |
Lateral and downward movements |
Appointments to the public service (includes casuals and students) |
Acting appointments (excludes appointments of less than 4 months) |
Total |
|---|---|---|---|---|---|
2014 to 2015 |
106 |
134 |
547 |
229 |
1 016 |
2015 to 2016 |
136 |
183 |
571 |
147 |
1 037 |
2016 to 2017 |
164 |
192 |
672 |
143 |
1 171 |
2017 to 2018 |
193 |
198 |
582 |
122 |
1 095 |
2018 to 2019 |
242 |
230 |
728 |
183 |
1 383 |
Text version
Fiscal year |
Indeterminate staffing activities |
Term staffing activities |
Casual staffing activities |
Student staffing activities |
Total staffing activities |
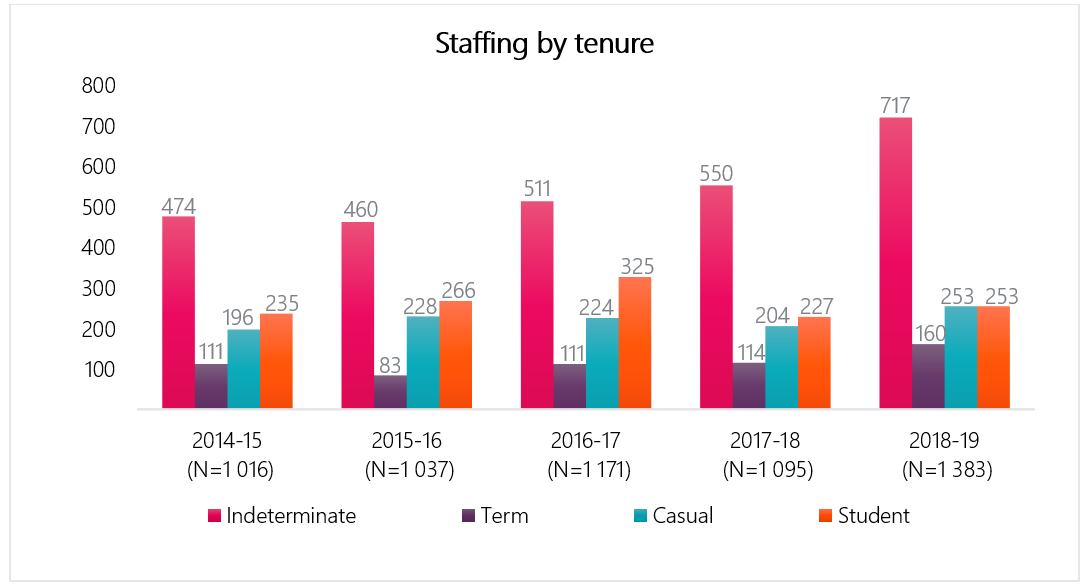
|---|---|---|---|---|---|
2014 to 2015 |
474 |
111 |
196 |
235 |
1 016 |
2015 to 2016 |
460 |
83 |
228 |
266 |
1 037 |
2016 to 2017 |
511 |
111 |
224 |
325 |
1 171 |
2017 to 2018 |
550 |
114 |
204 |
227 |
1 095 |
2018 to 2019 |
717 |
160 |
253 |
253 |
1 383 |
Key findings - Staffing and non-partisanship survey (2018)
- 59.0% of employees agreed that people hired can do the job, compared to 52.3% in organizations of similar size, and 53.8% in the federal public service
- 56.7% of managers agreed that the New Direction in Staffing has improved the way they hire and appoint persons to and within their organization, compared to 54.4% in organizations of similar size, and 56.1% in the federal public service
- 90.5% of managers agreed that within their organization, the administrative to staff a position is burdensome, compared to 88.6% in organizations of similar size, and 87.9% in the federal public service
Text version
Fiscal year |
Federal Student Work Experience Program |
Post-Secondary Co-op/Internship Program |
Research Affiliate Program |
Total |
|---|---|---|---|---|
2014 to 2015 |
105 |
123 |
7 |
235 |
2015 to 2016 |
119 |
142 |
5 |
266 |
2016 to 2017 |
166 |
158 |
1 |
325 |
2017 to 2018 |
122 |
102 |
3 |
227 |
2018 to 2019 |
144 |
106 |
3 |
253 |
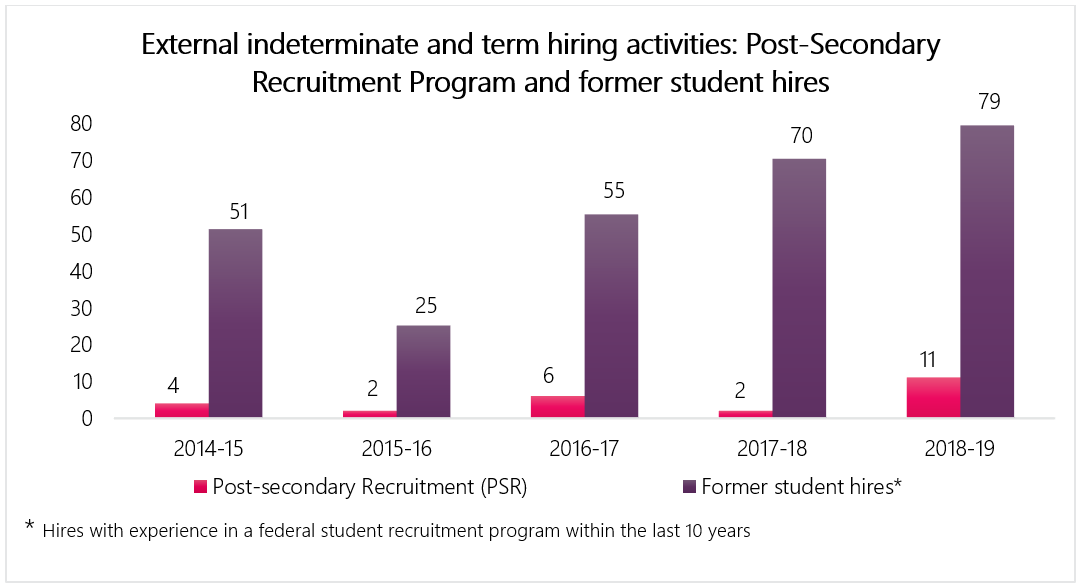
Text version
Fiscal year |
Post-Secondary Recruitment Program hires |
Hiring of former students |
|---|---|---|
2014 to 2015 |
4 |
51 |
2015 to 2016 |
2 |
25 |
2016 to 2017 |
6 |
55 |
2017 to 2018 |
2 |
70 |
2018 to 2019 |
11 |
79 |
Text version
Number of calendar days |
The number of internal appointments for which the TTS-IA was within the specified number of calendar days for organizations subject to the Public Service Employment Act |
The number of internal appointments for which the TTS-IA was within the specified number of calendar days for the specified organization |
|---|---|---|
0 calendar days |
0 |
0 |
0 to 29 calendar days |
15 |
0 |
30 to 59 calendar days |
130 |
1 |
60 to 89 calendar days |
277 |
0 |
90 to 119 calendar days |
391 |
7 |
120 to 149 calendar days |
367 |
3 |
150 to 179 calendar days |
322 |
4 |
180 to 209 calendar days |
278 |
8 |
210 to 239 calendar days |
241 |
5 |
240 to 269 calendar days |
165 |
6 |
270 to 299 calendar days |
134 |
2 |
300 to 329 calendar days |
107 |
1 |
330 to 359 calendar days |
77 |
1 |
360 to 389 calendar days |
61 |
1 |
390 to 419 calendar days |
53 |
2 |
420 to 449 calendar days |
51 |
0 |
450 to 479 calendar days |
42 |
0 |
480 to 509 calendar days |
40 |
1 |
510 to 539 calendar days |
32 |
1 |
540 to 569 calendar days |
24 |
1 |
570 to 599 calendar days |
21 |
0 |
600 to 629 calendar days |
11 |
0 |
630 to 659 calendar days |
19 |
0 |
660 to 689 calendar days |
3 |
1 |
690 to 719 calendar days |
13 |
0 |
720 to 749 calendar days |
6 |
0 |
750 to 779 calendar days |
5 |
1 |
780 to 809 calendar days |
8 |
0 |
810 to 839 calendar days |
4 |
1 |
840 to 869 calendar days |
10 |
0 |
870 to 899 calendar days |
4 |
0 |
900 to 929 calendar days |
5 |
1 |
930 to 959 calendar days |
5 |
0 |
960 to 989 calendar days |
3 |
0 |
More than 990 calendar days |
23 |
1 |
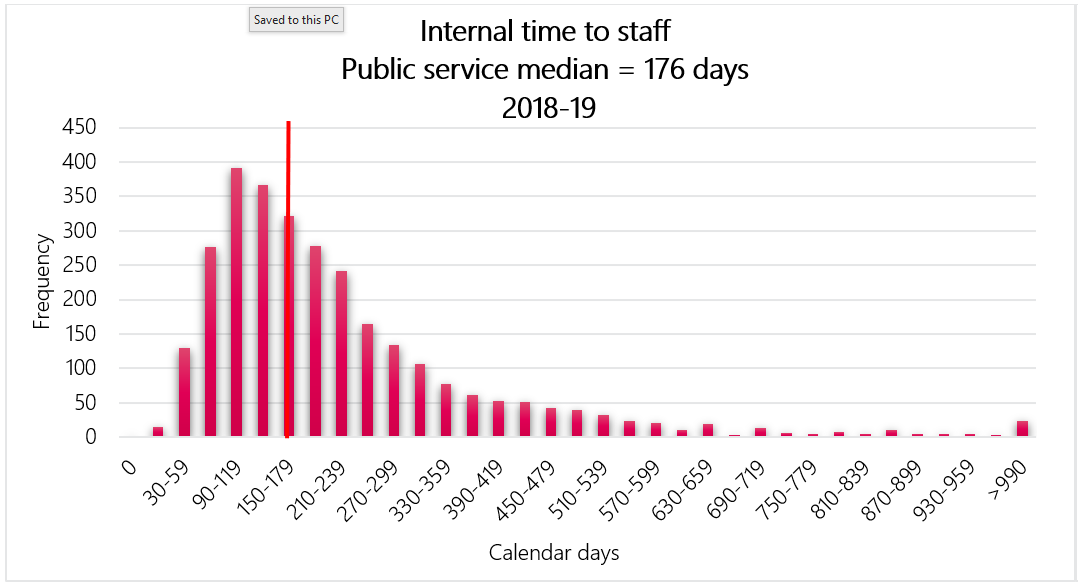
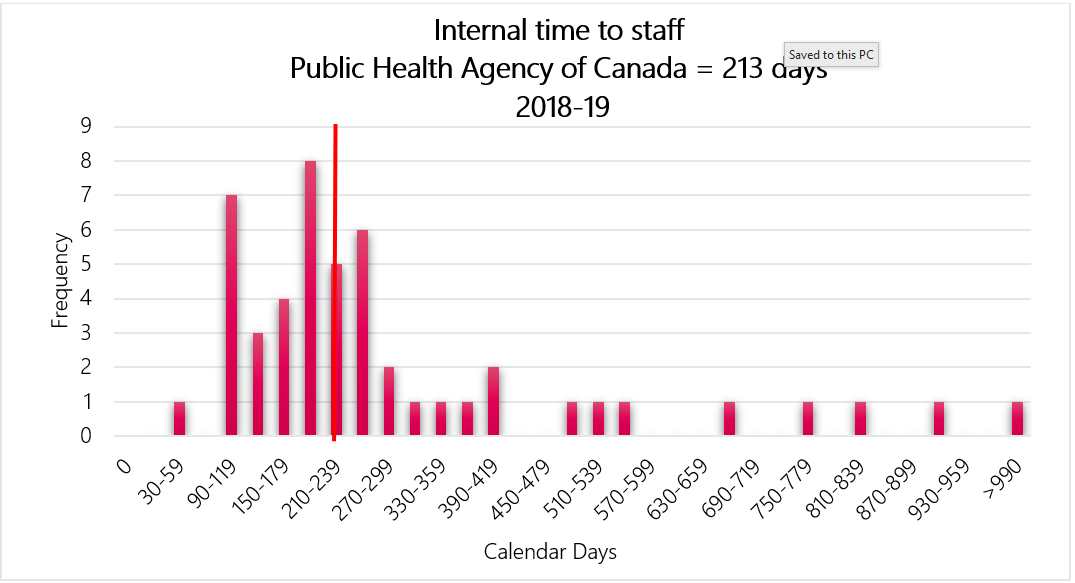
Internal time to staff is calculated as the number of calendar days between the opening date of the advertisement and the date of the first notification.
Internal time to staff for fiscal year 2018 to 2019
The median internal time to staff for the public service (organizations subject to the Public Service Employment Act) for fiscal year 2018 to 2019 is 176 days. Public Health Agency of Canada’s median internal time to staff for fiscal year 2018 to 2019 is 213 days.
Text version
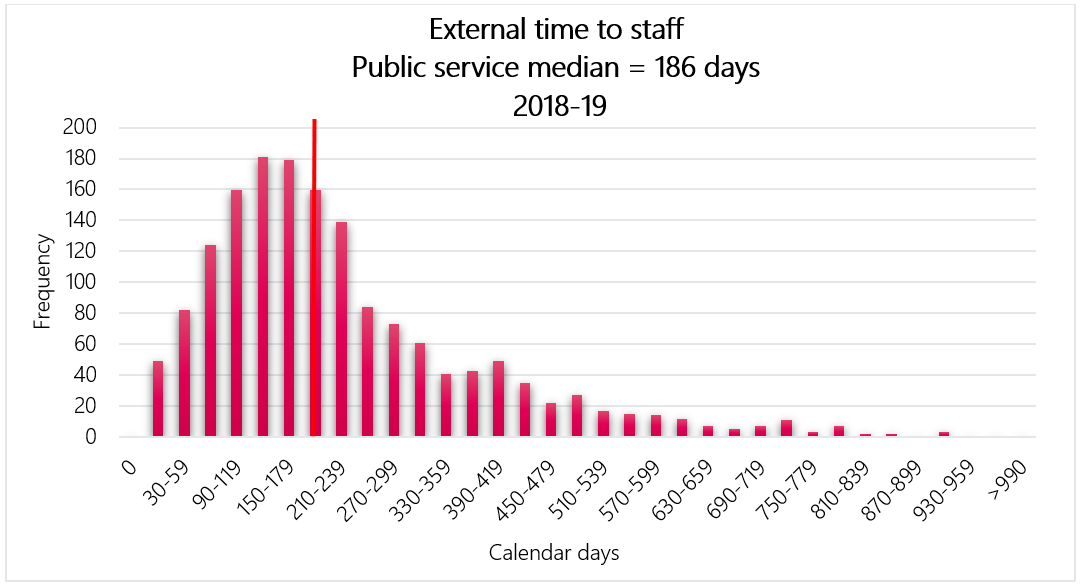
Number of calendar days |
The number of external appointment processes for which the TTS-EA was within the specified number of calendar days for organizations subject to the Public Service Employment Act |
|---|---|
0 calendar days |
0 |
0 to 29 calendar days |
49 |
30 to 59 calendar days |
82 |
60 to 89 calendar days |
124 |
90 to 119 calendar days |
160 |
120 to 149 calendar days |
181 |
150 to 179 calendar days |
179 |
180 to 209 calendar days |
160 |
210 to 239 calendar days |
139 |
240 to 269 calendar days |
84 |
270 to 299 calendar days |
73 |
300 to 329 calendar days |
61 |
330 to 359 calendar days |
41 |
360 to 389 calendar days |
43 |
390 to 419 calendar days |
49 |
420 to 449 calendar days |
35 |
450 to 479 calendar days |
22 |
480 to 509 calendar days |
27 |
510 to 539 calendar days |
17 |
540 to 569 calendar days |
15 |
570 to 599 calendar days |
14 |
600 to 629 calendar days |
12 |
630 to 659 calendar days |
7 |
660 to 689 calendar days |
5 |
690 to 719 calendar days |
7 |
720 to 749 calendar days |
11 |
750 to 779 calendar days |
3 |
780 to 809 calendar days |
7 |
810 to 839 calendar days |
2 |
840 to 869 calendar days |
2 |
870 to 899 calendar days |
0 |
900 to 929 calendar days |
3 |
930 to 959 calendar days |
1 |
960 to 989 calendar days |
0 |
More than 990 calendar days |
0 |
External Time to Staff
External time to staff is calculated as the number of calendar days between the opening date of the advertisement and the date of the first estimated external hire.
The data is insufficient for providing results on external process times for Public Health Agency of Canada.
External time to staff for fiscal year 2018 to 2019
The median external time to staff for the public service (organizations subject to the Public Service Employment Act) for fiscal year 2018 to 2019 is 186 days. The data is insufficient for providing results on external process times for the Public Health Agency of Canada.
Technical notes:
- The Time to Staff - Internal Appointments is the median number of calendar days between the opening date of an internal advertisement and the date of the first Notice of Appointment or Proposal of Appointment (NAPA) from the Public Service Resourcing System for internal term and indeterminate positions. As NAPAs are not required for all internal staffing actions, this measure is limited to reporting on internal promotional appointments.
- The Time to Staff - External Appointments is the median number of calendar days between the opening date of an external advertisement and the date of the first estimated appointment of an individual from outside an organization subject to the Public Service Employment Act for term and indeterminate positions. Because data between systems is linked using a probabilistic match, errors in data linkage are a potential source of measurement error.
- Only estimated term and indeterminate appointments/notifications are included (deployments, casual and acting appointments are excluded).