
President Meeting with Dr. Pierre Béland, Commissioner, International Joint Commission August 26, 2019
Introduction
Deputy Head
Dr. Pierre Béland was appointed as the Commissioner of the International Joint Commission (IJC) on May 9, 2019.
Dr. Pierre Béland is exercising the Public Service Commission’s (PSC) authority for the first time as Deputy Head (DH). A copy of the New Direction in Staffing (NDS) highlights for DHs is attached as Annex A.
Organizational Context
Mandate
Canada and the United States created the IJC because they recognized that each country is affected by the other’s actions in lake and river systems along the border. The two countries cooperate to manage these waters wisely and protect them for the benefit of today’s citizens and future generations.
The IJC has two main responsibilities: approving projects that affect water levels and flows across the boundary and investigating transboundary issues and recommending solutions. The IJC’s recommendations and decisions take into account the needs presented by a wide range of water uses, including drinking water, commercial shipping, hydroelectric power generation, agriculture, industry, fishing, recreational boating and shoreline property.
Population and Staffing Activities
Population
IJC is a very small organization that has a population of 30 employees (as of March 31, 2019).
Staffing Activities
In the 2018–2019 fiscal year, the organization performed 17staffing actions through its service provider, Public Service and Procurement Canada, detailed as follows:
- 12 appointments to the public service (including the hiring of 1 casual employee and 7 students;
- 4 promotions;
- 1 lateral and downward movements
Please refer to Annex B for additional detail on staffing activities.
Time to Staff
The data is insufficient for providing results on internal and external process times for the IJC.
Staffing Framework
New Direction in Staffing Implementation
Following the implementation of the New Direction in Staffing (NDS), the IJC developed its appointment and staffing policy. This policy, which has been in effect since July 2016, was shared with the PSC.
In January 2019, the IJC shared its sub-delegation instrument and guidelines with the PSC. The PSC provided feedback and commended the IJC for its work on the documents. It should be noted that its instrument meets all the requirements of the Appointment Delegation and Accountability Instrument (ADAI).
Appointment Delegation and Accountability Instrument Annex D Reporting
Use of the Public Service Official Languages Exclusion Approval Order and the Public Service Official Languages Appointment Regulations
IJC reported that the organization made no useof the PSOLEAO and no use of the PSOLAR for the period of April 1, 2018,and March 31, 2019.
Approved Deputy Head Exceptions to the National Area of Selection Requirements for External Advertised Appointment Process
IJC reported that the DH approved 0 exceptionsto the NAOS.
Results of Organizational Cyclical Assessment
The IJC expressed interest in participating in the PSC’s pilot project to perform cyclical assessments of smaller organizations.
Inquiries and Trends
The PSC received a total of 15 requests for information between April 1, 2018, and January 31, 2019. There is a very good relationship between the staffing support advisor (SSA) and the organization’s contacts.
Oversight
Investigations
No investigation for IJC.
Staffing and Non-Partisanship Survey Results (SNPS)
For certain questions, the IJC’s SNPS results diverge with those of other very small organizations and the public service as a whole. It should be noted that the IJC did not receive results for every SNPS question because results are only provided for questions with at least 10 respondents.
Below are the main findings of the IJC’s 2018 SNPS results:
- 93.4% of employees indicated that individuals hired to their work unit were able to do the job, compared to 69.8% in organizations of a similar size and 53.8% across the federal public service.
- 93.3% of employees indicated that the process used for selecting persons for positions in their work units is done fairly, compared to 61.7% in organizations of a similar size and 46.4% across the federal public service.
- 53.3% of employees did not agree with the statement that appointments in their work units depend on who you know, compared to 35.2% in organizations in similar size and 23.5% across the federal public service.
- 80% of employees indicated that staffing activities in their work units are carried out in a transparent way, compared to 60.9% in organizations of a similar size and 44.3% in the federal public service as a whole.
Diversity Profile
Due to the organizations small number of employees, the employment equity statistics have been removed from this report to protect the confidentiality of individual respondents.
Priority Entitlements and Veterans
From April 1, 2018, to July 10, 2019, the IJC appointed one person with a priority entitlement. Over the same period, the IJC submitted 11 requests for priority clearance.
As at June 30, 2019, the IJC had not appointed any member of the Canadian Armed Forces medically released for reasons attributable or not attributable to service since the Veterans Hiring Act came into effect on July 1, 2015.
On July 23, 2019, the IJC had no “active” persons with a priority entitlement in the PSC priority system.
Non-Partisanship in the Public Service
Nick Heisler is the IJC Designated Political Activities Representative (DPAR). The DPAR liaises with the PSC on issues related to political activities and non‑partisanship.
In past years, the PSC has not received any request to stand in an election from an IJC employee. Since April 1, 2015, the PSC has received no federal, provincial, territorial or municipal requests from this organization.
The 2018 SNPS results indicated that 87.5% of IJC employees were aware of their rights and obligations for engaging in political activities, compared to 80.1% across the public service. In addition, 93.8% of employees indicated that they are able to make informed decisions about engaging in political activities, compared to 92.9% in organizations of a similar size and 87.9% in the public service as a whole.
PSC Initiatives
IJC is not part of any PSC-led initiatives at this moment.
Staffing Support
Public Service Commission Representatives and Organizational Contacts
The Staffing Support Advisor (SSA) assigned to this organization is Muriel Ngombo and the primary organizational contacts are Isabelle Reid, Executive Assistant, and Céline Desjardins, Administrative Officer, Human Resources.
Prepared by:
Gaétane Clément,
Staffing Support Advisor
Annexes:
- Annex A – The New Direction in Staffing (NDS) highlights for DHs
- Annex B - Data on Population and Staffing Activities
Annex A
A New Direction in Staffing - A merit-based system that is effective, efficient and fair
Appointment Policy
New focus on core requirements to provide sub-delegated persons greater discretion in making an appointment
- One Appointment Policy, no duplication with legal requirements
- Broader focus on values-based system, away from rules-based system
- Appointment Policy supported by streamlined guidance:
- A roadmap to the requirements in legislation, regulations and policy
- Options and considerations for decision-making where there is discretion
- Clear expectations for priority entitlements
- No restrictions to assessment methods for EX appointments
- Exceptions to National Area of Selection approved by deputy head
Delegation
- New ability to customize organizational staffing system based on unique context and evolving business needs
- Deputy head to establish a direction on the use of advertised and non-advertised appointment processes
- Deputy head to establish requirement(s) for sub-delegated persons to articulate, in writing, their selection decision
- Clarity on requirements related to investigations
- Attestation form to reinforce the accountabilities of sub-delegated persons
All PSC monitoring and reporting requirements now found in the Appointment Delegation and Accountability Instrument
Monitoring and Reporting
Monitoring built by organizations, targeted to their needs
- Annual Departmental Staffing Accountability Report no longer required
- Annual reporting to the PSC limited to:
- use of Public Service Official Languages Exclusion Approval Order
- exceptions to the National Area of Selection approved by the deputy head
- results of any internal investigations
- Actions taken following any PSC investigations or audits.
- Deputy head responsible for ongoing monitoring of organizational staffing system based on the organization’s unique context
- Assessment of adherence to requirements, based on organization’s own risks, at a minimum every five years
PSC Oversight
System-wide focus
- Government-wide compliance audit every two years
- Renewed Survey of Staffing administered in alternating years with government-wide audit
- System-wide effectiveness and efficiency reviews to support continuous improvement
- Targeted PSC audits as a result of identified system-wide or organizational risks or at deputy head request
- Investigations conducted when there is reason to believe there was political influence, fraud or improper conduct in an appointment process
This document should be read in conjunction with the Public Service Employment Act, the Public Service Employment Regulations, the PSC Appointment Policy and the PSC Appointment Delegation and Accountability Instrument.
Annex B
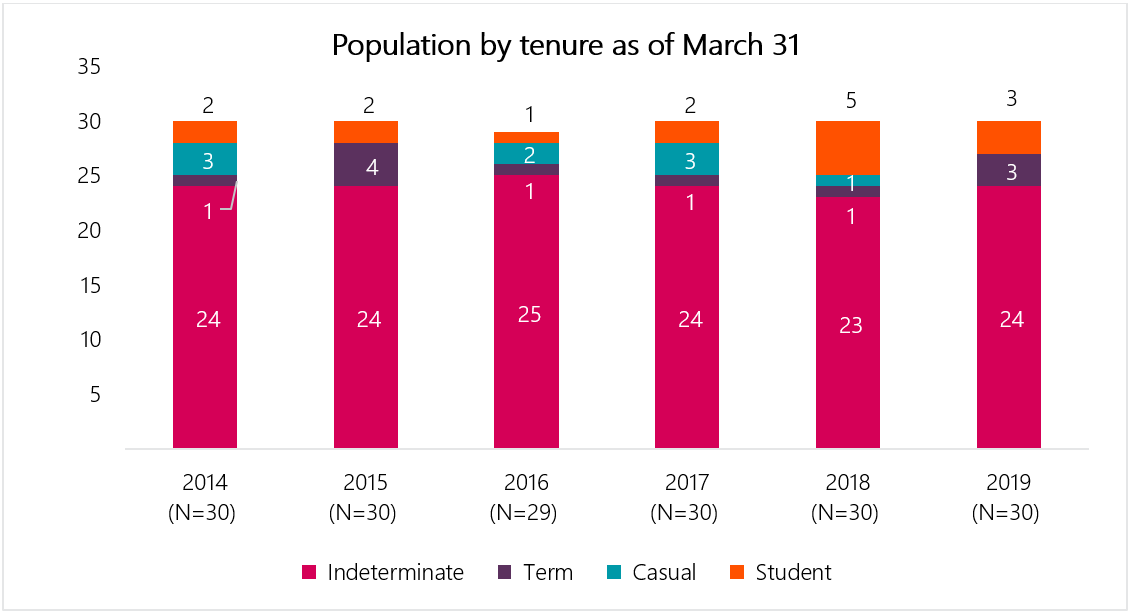
Text version
Year |
Indeterminate |
Term |
Casual |
Student |
Total |
|---|---|---|---|---|---|
As of March 31, 2014 |
24 |
1 |
3 |
2 |
30 |
As of March 31, 2015 |
24 |
4 |
0 |
2 |
30 |
As of March 31, 2016 |
25 |
1 |
2 |
1 |
29 |
As of March 31, 2017 |
24 |
1 |
3 |
2 |
30 |
As of March 31, 2018 |
23 |
1 |
1 |
5 |
30 |
As of March 31, 2019 |
24 |
3 |
0 |
3 |
30 |
* The Administrative Tribunals Support Service of Canada is the result of an amalgamation of eleven (11) federal administrative tribunals in 2014
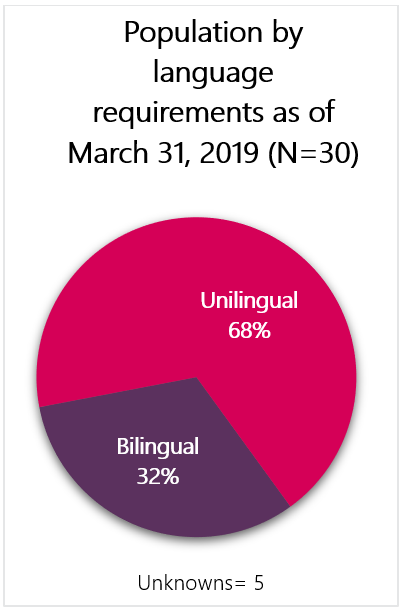
Text version
Linguistic requirements of the position |
Population as of March 31, 2019 |
Percentage of population as of March 31, 2019 |
|---|---|---|
Bilingual |
8 |
68% |
Unilingual |
17 |
32% |
Unknown |
5 |
|
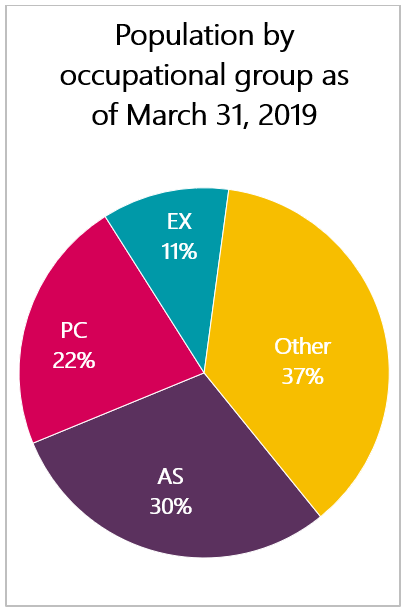
Text version
Occupational group |
Population as of March 31, 2019 |
Percentage of population as of March 31, 2019 |
|---|---|---|
AS – Administrative Services |
8 |
30% |
PC – Physical Sciences |
6 |
22% |
EX – Executive |
3 |
11% |
Other |
10 |
37% |
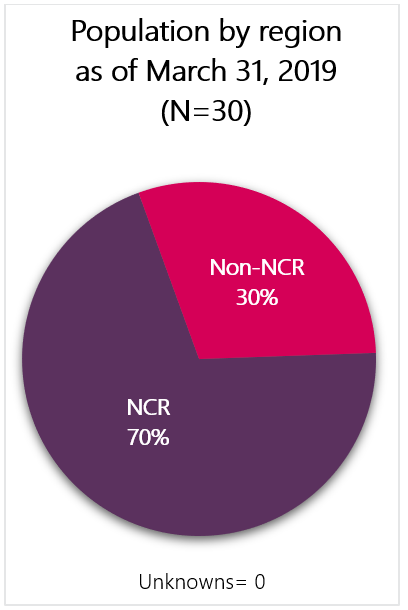
Text version
Region |
Population as of March 31, 2019 |
Percentage of population as of March 31, 2019 |
|---|---|---|
National Capital Region (NCR) |
21 |
70% |
Non-NCR |
9 |
30% |
Unknown |
0 |
|
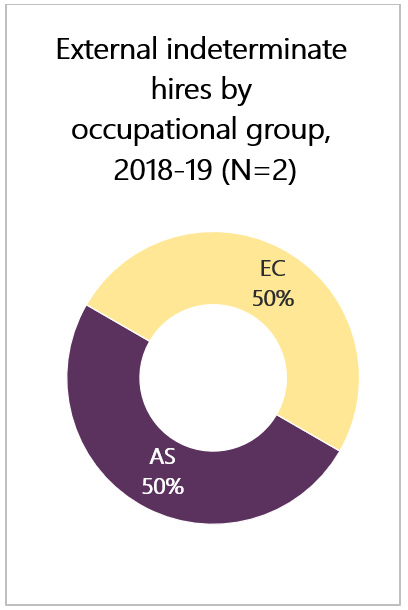
Text version
Occupational group |
Number of indeterminate hiring activities |
Percentage of all indeterminate hiring activities |
|---|---|---|
AS – Administrative Services |
1 |
50% |
EC – Economics and Social Sciences Services |
1 |
50% |
Other |
0 |
0% |
Total |
0 |
100% |
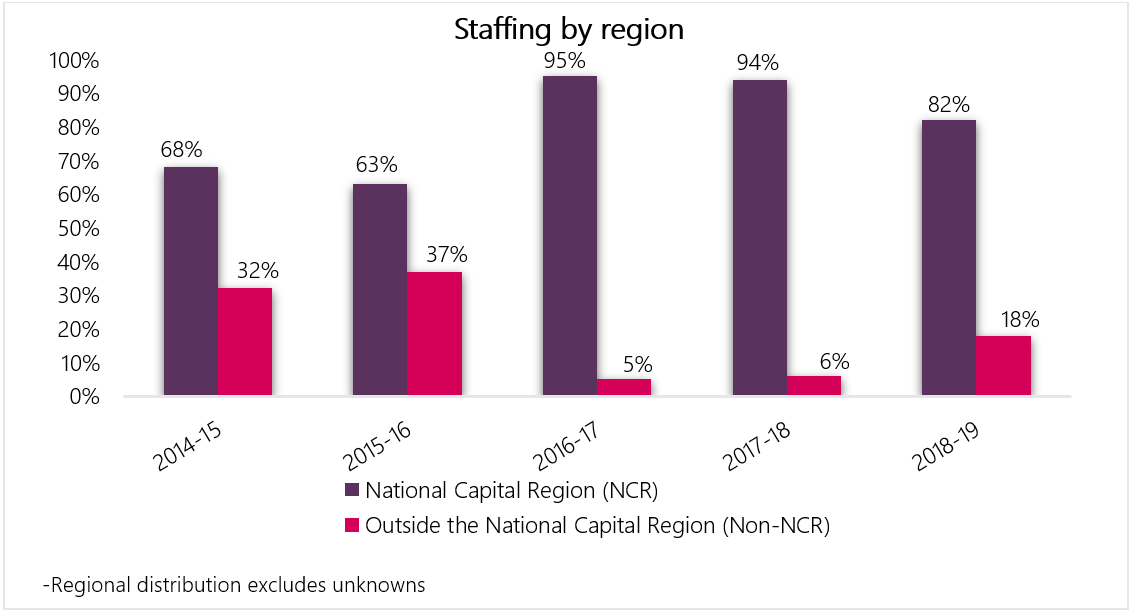
Text version
Fiscal year |
Percentage of staffing activities in the National Capital Region (NCR) |
Percentage of staffing activities in all other regions (Non-NCR) |
|---|---|---|
2014 to 2015 |
68% |
32% |
2015 to 2016 |
63% |
37% |
2016 to 2017 |
95% |
5% |
2017 to 2018 |
94% |
6% |
2018 to 2019 |
82% |
18% |
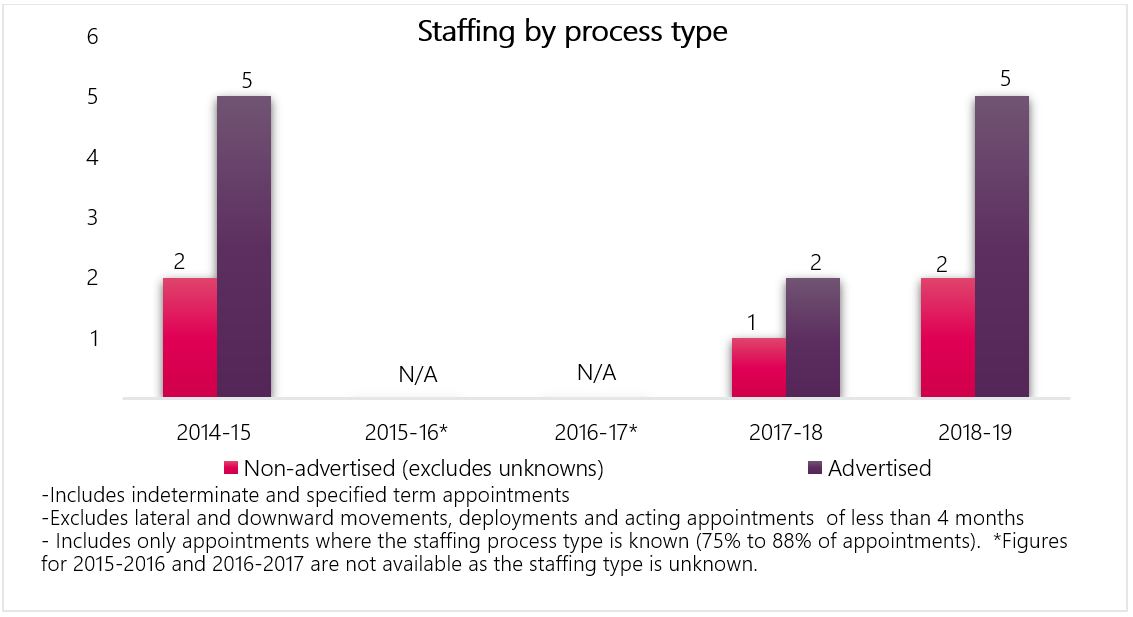
Text version
Fiscal year |
Non-advertised processes (excludes unknowns) |
Advertised processes |
% of Non- advertised processes |
|---|---|---|---|
2014 to 2015 |
2 |
5 |
29% |
2015 to 2016 |
0 |
0 |
0% |
2016 to 2017 |
0 |
0 |
0% |
2017 to 2018 |
1 |
2 |
33% |
2018 to 2019 |
2 |
5 |
29% |
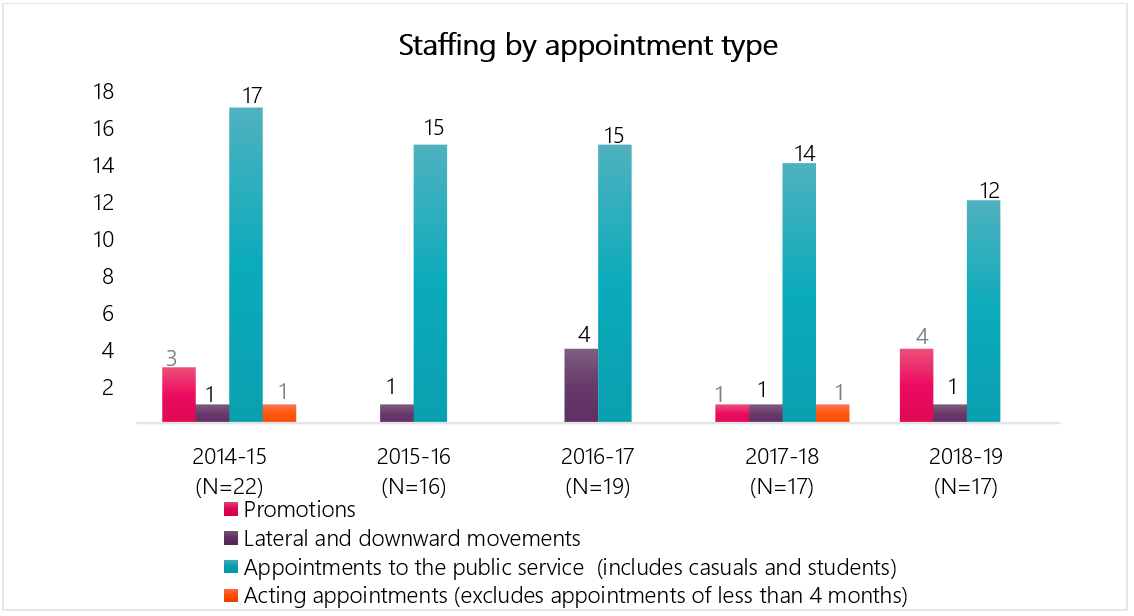
Text version
Fiscal year |
Promotions |
Lateral and downward movements |
Appointments to the public service (includes casuals and students) |
Acting appointments (excludes appointments of less than 4 months) |
Total |
2014 to 2015 |
3 |
1 |
17 |
1 |
22 |
2015 to 2016 |
0 |
1 |
15 |
0 |
16 |
2016 to 2017 |
0 |
4 |
15 |
0 |
19 |
2017 to 2018 |
1 |
1 |
14 |
1 |
17 |
2018 to 2019 |
4 |
1 |
12 |
0 |
17 |
Text version
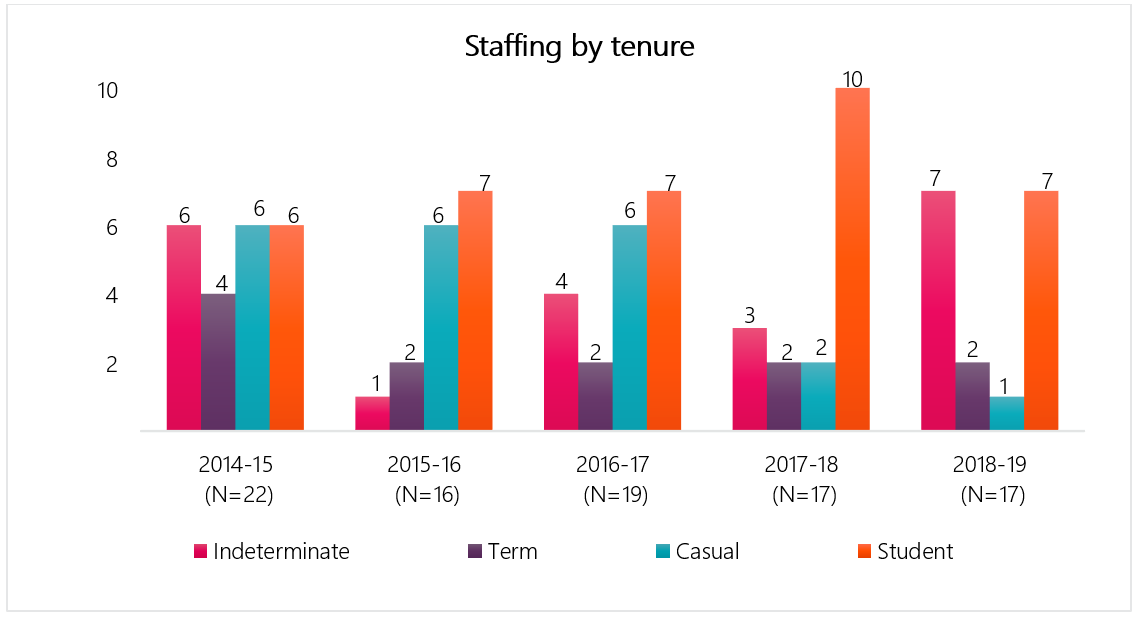
Fiscal year |
Indeterminate staffing activities |
Term staffing activities |
Casual staffing activities |
Student staffing activities |
Total staffing activities |
|---|---|---|---|---|---|
2014 to 2015 |
6 |
4 |
6 |
6 |
22 |
2015 to 2016 |
1 |
2 |
6 |
7 |
16 |
2016 to 2017 |
4 |
2 |
6 |
7 |
19 |
2017 to 2018 |
3 |
2 |
2 |
10 |
17 |
2018 to 2019 |
7 |
2 |
1 |
7 |
17 |
Key findings - Staffing and non-partisanship survey (2018)
- 93.4% of employees agreed that people hired can do the job, compared to 69.8% in organizations of similar size, and 53.8% in the federal public service
For additional questions, there is no sufficient survey data available for the International Joint Commission
Text version
Fiscal year |
Federal Student Work Experience Program |
Post-Secondary Co-op/Internship Program |
Research Affiliate Program |
Total |
|---|---|---|---|---|
2014 to 2015 |
0 |
6 |
0 |
6 |
2015 to 2016 |
2 |
5 |
0 |
7 |
2016 to 2017 |
5 |
2 |
0 |
7 |
2017 to 2018 |
6 |
4 |
0 |
10 |
2018 to 2019 |
2 |
5 |
0 |
7 |
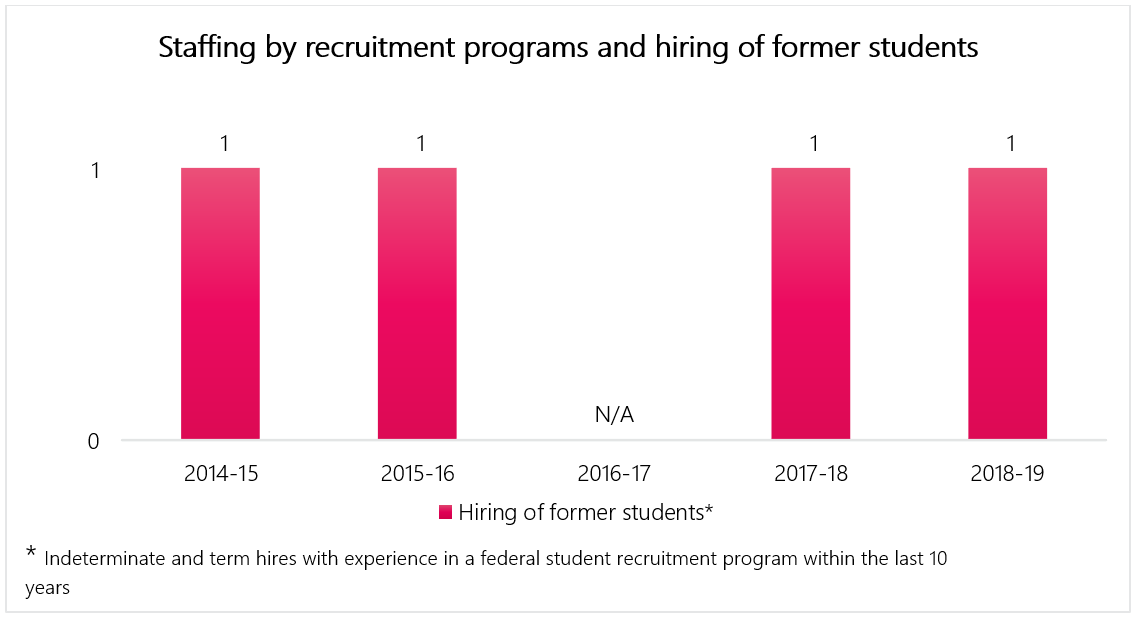
Text version
Fiscal year |
Post-Secondary Recruitment Program hires |
Hiring of former students |
|---|---|---|
2014 to 2015 |
0 |
1 |
2015 to 2016 |
0 |
1 |
2016 to 2017 |
0 |
0 |
2017 to 2018 |
0 |
1 |
2018 to 2019 |
0 |
1 |
Text version
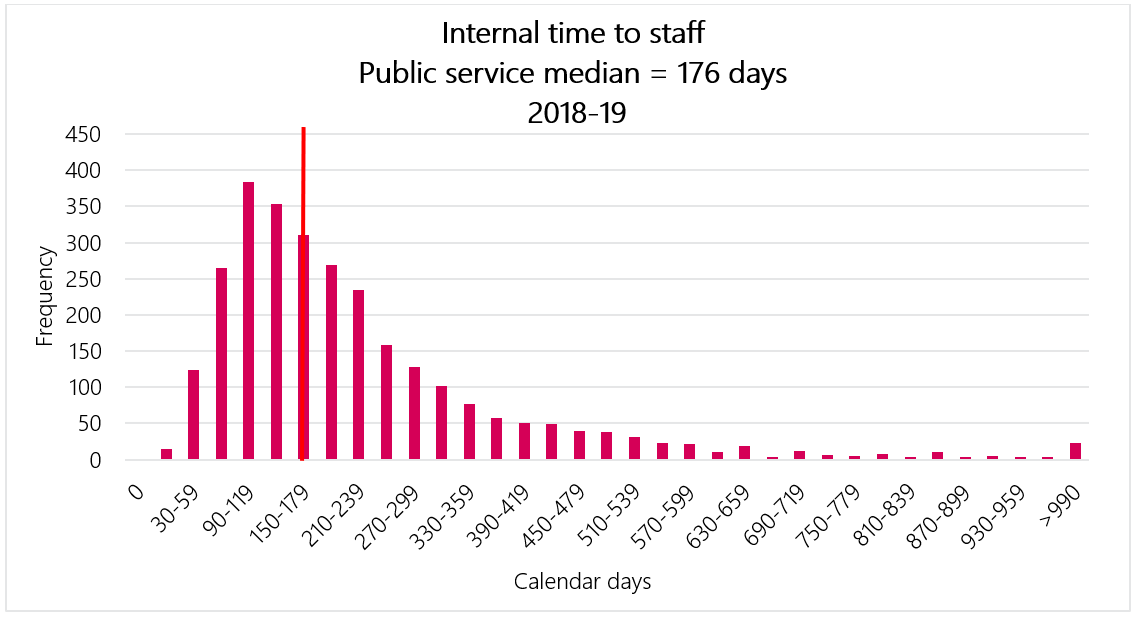
|
Number of calendar days |
The number of internal appointments for which the TTS-IA was within the specified number of calendar days for organizations subject to the Public Service Employment Act |
|---|---|
0 calendar days |
0 |
0 to 29 calendar days |
15 |
30 to 59 calendar days |
124 |
60 to 89 calendar days |
265 |
90 to 119 calendar days |
384 |
120 to 149 calendar days |
354 |
150 to 179 calendar days |
311 |
180 to 209 calendar days |
269 |
210 to 239 calendar days |
234 |
240 to 269 calendar days |
159 |
270 to 299 calendar days |
128 |
300 to 329 calendar days |
102 |
330 to 359 calendar days |
77 |
360 to 389 calendar days |
58 |
390 to 419 calendar days |
51 |
420 to 449 calendar days |
49 |
450 to 479 calendar days |
40 |
480 to 509 calendar days |
38 |
510 to 539 calendar days |
31 |
540 to 569 calendar days |
23 |
570 to 599 calendar days |
21 |
600 to 629 calendar days |
10 |
630 to 659 calendar days |
19 |
660 to 689 calendar days |
3 |
690 to 719 calendar days |
12 |
720 to 749 calendar days |
6 |
750 to 779 calendar days |
5 |
780 to 809 calendar days |
8 |
810 to 839 calendar days |
3 |
840 to 869 calendar days |
10 |
870 to 899 calendar days |
4 |
900 to 929 calendar days |
5 |
930 to 959 calendar days |
4 |
960 to 989 calendar days |
3 |
More than 990 calendar days |
23 |
Internal Time to Staff
The data is insufficient for providing results on internal process times for the International Joint Commission.
Internal time to staff is calculated as the number of calendar days between the opening date of the advertisement and the date of the first notification.
Internal time to staff for fiscal year 2018 to 2019
The median internal time to staff for the public service (organizations subject to the Public Service Employment Act) for fiscal year 2018 to 2019 is 176 days. The data is insufficient for providing results on internal process times for the International Joint Commission
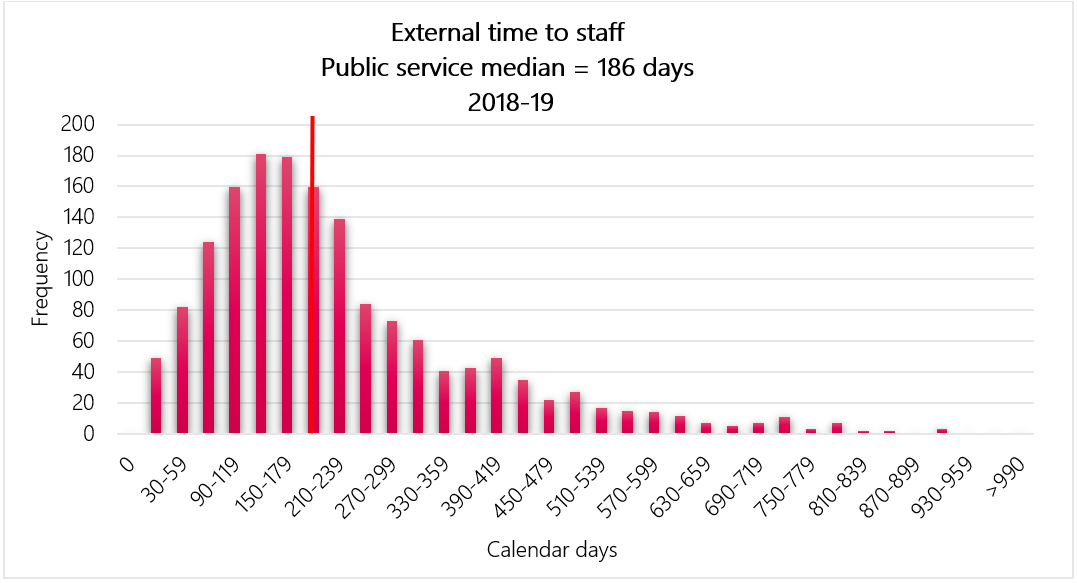
Text version
|
Number of calendar days |
The number of external appointment processes for which the TTS-EA was within the specified number of calendar days for organizations subject to the Public Service Employment Act |
|---|---|
0 calendar days |
0 |
0 to 29 calendar days |
49 |
30 to 59 calendar days |
82 |
60 to 89 calendar days |
124 |
90 to 119 calendar days |
160 |
120 to 149 calendar days |
181 |
150 to 179 calendar days |
179 |
180 to 209 calendar days |
160 |
210 to 239 calendar days |
139 |
240 to 269 calendar days |
84 |
270 to 299 calendar days |
73 |
300 to 329 calendar days |
61 |
330 to 359 calendar days |
41 |
360 to 389 calendar days |
43 |
390 to 419 calendar days |
49 |
420 to 449 calendar days |
35 |
450 to 479 calendar days |
22 |
480 to 509 calendar days |
27 |
510 to 539 calendar days |
17 |
540 to 569 calendar days |
15 |
570 to 599 calendar days |
14 |
600 to 629 calendar days |
12 |
630 to 659 calendar days |
7 |
660 to 689 calendar days |
5 |
690 to 719 calendar days |
7 |
720 to 749 calendar days |
11 |
750 to 779 calendar days |
3 |
780 to 809 calendar days |
7 |
810 to 839 calendar days |
2 |
840 to 869 calendar days |
2 |
870 to 899 calendar days |
0 |
900 to 929 calendar days |
3 |
930 to 959 calendar days |
1 |
960 to 989 calendar days |
0 |
More than 990 calendar days |
0 |
External Time to Staff
The data is insufficient for providing results on external process times for the International Joint Commission.
External time to staff is calculated as the number of calendar days between the opening date of the advertisement and the date of the first estimated external hire.
External time to staff for fiscal year 2018 to 2019
The median external time to staff for the public service (organizations subject to the Public Service Employment Act) for fiscal year 2018 to 2019 is 186 days. The data is insufficient for providing results on external process times for the International Joint Commission.
Technical Notes
- The Time to Staff - Internal Appointments (TTS-IA) is the median number of calendar days between the opening date of an internal advertisement and the date of the first Notice of Appointment or Proposal of Appointment (NAPA) from the Public Service Resourcing System for internal term and indeterminate positions. As NAPAs are not required for all internal staffing actions, this measure is limited to reporting on internal promotional appointments
- Only estimated term and indeterminate appointments/notifications are included (deployments, casual and acting appointments are excluded)
- The Time to Staff - External Appointments (TTS-EA) is the median number of calendar days between the opening date of an external advertisement and the date of the first estimated appointment of an individual from outside an organization subject to the Public Service Employment Act for term and indeterminate positions. Only estimated term and indeterminate appointments/notifications are included (deployments, casual and acting appointments are excluded)
- Because data between systems is linked using a probabilistic match, errors in data linkage are a potential source of measurement error
- Hiring and staffing activities data are derived from information received from the Treasury Board of Canada Secretariat Incumbent File. The Incumbent File is extracted from the Public Services and Procurement Canada’s pay system. The data constitutes an estimate of hiring and staffing activities to and within organizations.
- Information from the Priority Information Management System and the Public Services Resourcing System is also used to determine if staffing actions are advertised or non-advertised as well as for calculating time to staff.
- The data are not expected to match an organization’s human resources data, due to methodology and timing differences.