
President meeting with Ms. Leslie Weir, Librarian and Archivist of Canada of the Library and Archives of Canada October 21, 2019
Introduction
Deputy Head
Ms. Leslie Weir was appointed as the Librarian and Archivist of Canada of the Library and Archives of Canada (LAC) on August 30, 2019.
As Ms. Weir is appointed from outside the public service, please refer to the enclosed deck for important information to convey about roles and responsibilities as they relate to staffing.
Ms. Weir is exercising the Public Service Commission’s (PSC) authority for the first time as Deputy Head (DH). A copy of the New Direction in Staffing (NDS) highlights for DHs is attached as Annex A.
Organizational Context
Mandate
LAC combines the holdings, services and staff of both the former National Library of Canada and the National Archives of Canada. As outlined in the Preamble to the Library and Archives of Canada Act, LAC’s mandate is as follows:
- to preserve the documentary heritage of Canada for the benefit of present and future generations;
- to be a source of enduring knowledge accessible to all, contributing to the cultural, social and economic advancement of Canada as a free and democratic society;
- to facilitate in Canada co-operation among communities involved in the acquisition, preservation and diffusion of knowledge; and
- to serve as the continuing memory of the Government of Canada and its institutions.
Challenges
According to LAC’s Departmental Plan 2019-2020, the organization will continue to implement its digital strategy. There is a risk that this digital strategy will not be integrated seamlessly, potentially negatively impacting its efficiency. For this reason, LAC will take into account the interdependencies of systems and processes and will also ensure that proposed new technological solutions are analyzed by their Project and Architecture Review Committee to ensure their compatibility with organizational architecture.
In addition, based on its learning framework, LAC will offer its employees training and development opportunities related to organizational needs. In particular, it will put in place a new career development program for librarians. LAC will also work to promote risk-and results-based staffing to attract and retain a diverse, skilled and high-performing workforce. To this end, it will develop innovative strategies to improve the efficiency of its recruitment processes in collaboration with the PSC.
Population and Staffing Activities
Population
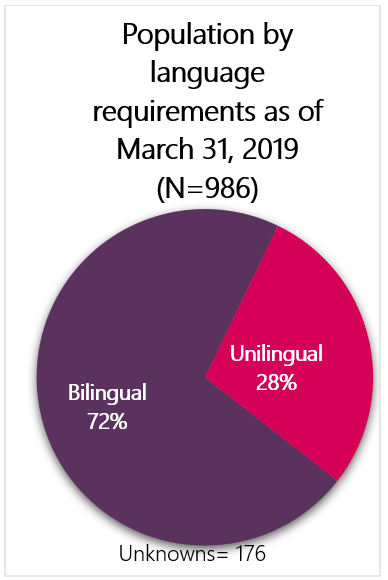
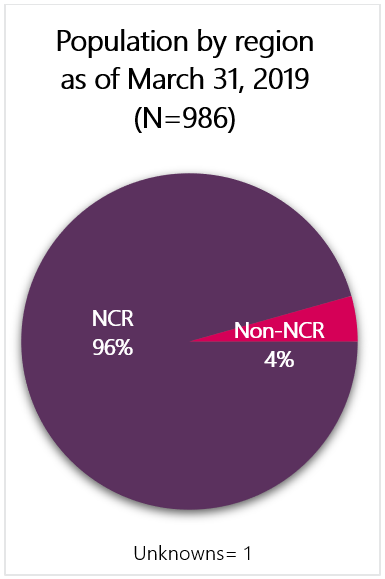
LAC is a medium organization that has a population of 986 employees (as of March 31, 2019).
Staffing Activities
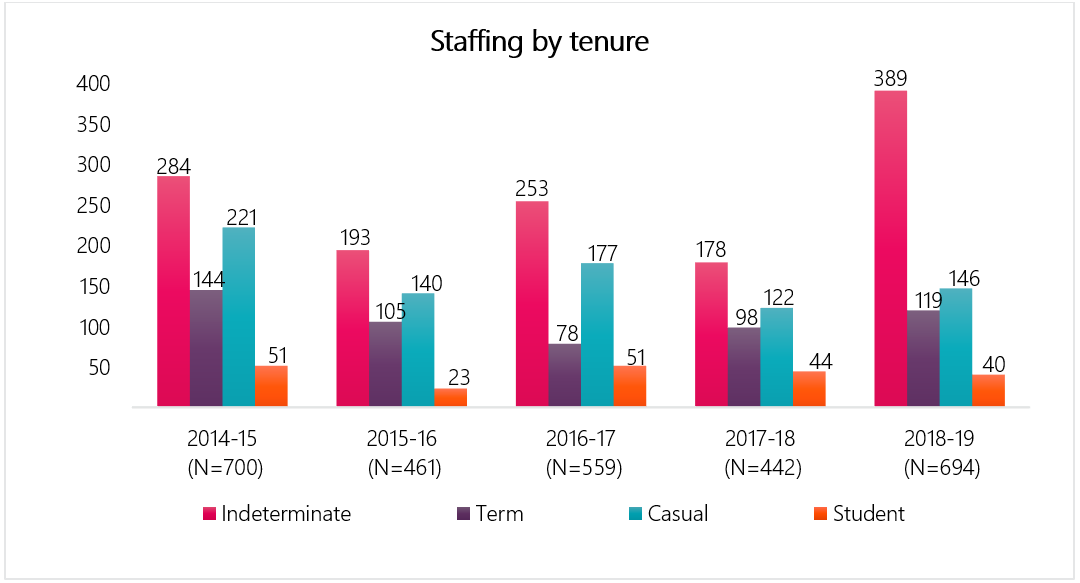
In 2018-2019, LAC proceeded with a total of 694 staffing activities:
- 120 appointments to the public service;
- 122 promotions;
- 121 acting appointments;
- 146 casuals;
- 40 students; and
- 145 lateral and downward movements.
Regarding the use of PSC targeted programs:
- LAC did not identify positions for the Federal Internship Program for Canadians with Disabilities.
- LAC submitted one request through the Employment Opportunity for Students with Disabilities in 2019, but no one was hired through this inventory.
- LAC did not submit any request for the Indigenous Student Employment inventory in 2019.
Please refer to Annex B for additional details on staffing activities.
Time to Staff
LAC has a median time of 145 days for internal advertised appointments, which is lower than the median of the public service, which is 176 days.
Due to the limited amount of external advertised appointment processes conducted by LAC in 2018-2019, there is insufficient data to provide information about LAC’s time to staff.
Staffing Framework
New Direction in Staffing (NDS) Implementation
LAC worked collaboratively with the Staffing Support Advisor (SSA) during the development of their new staffing framework and has completed all of the mandatory requirements following the NDS. LAC is operating on a risk and results-based approach to staffing, consequently shaping their staffing framework according to their specific needs and taking advantage of the flexibility that the Public Service Employment Act was intended to provide. The organization implemented this new framework on January 31, 2017.
As of April 1, 2016, all attestation forms had been signed by sub-delegated managers. They have updated their sub-delegation instrument to align it with new Appointment Delegation and Accountability Instrument and PSC Appointment Policy. It was approved in March 2017.
LAC has shared their appointment framework with the PSC.
LAC Staffing Monitoring Framework has been approved by the Librarian and Archivist of Canada on April 29, 2018, and implementation is ongoing.
Appointment Delegation and Accountability Instrument Annex D Reporting
Use of the Public Service Official Languages Exclusion Approval Order and the Public Service Official Languages Appointment Regulations
LAC reported that the organization has not approved any new exemption under the Public Service Official Languages Exclusion Approval Order(PSOLEAO) but they extended one exemption under the Public Service Official Languages Appointment Regulations. This exemption had been originally approved from April 14, 2016 to April 13, 2018 and has subsequently been extended until April 13, 2020. As the extension period is still within the PSOLEAO timelines, no action is required from the PSC at this point.
Approved Deputy Head Exceptions to the National Area of Selection Requirements for External Advertised Appointment Process
LAC has not approved exemptions to the National Area of Selection.
Results of Organizational Cyclical Assessment
LAC has not reported on their cyclical assessment, which is due by May 1, 2021.
Inquiries and Trends
LAC consulted the SSA at many occasions in order to discuss various subject matters. Main questions were related to the Public Service Employment Regulations, the assessment, the use of advertised and non-advertised, as well as questions on PSC website and systems (for example, the Public Service Resourcing System).
Oversight
Audits
The organization is among the 30 organizations selected for the Audit of Employment Equity Representation in Recruitment that is currently underway.
Investigations
From April 1, 2017, to August 28, 2019, the PSC received one investigation case, at the LAC DH’s request. This investigation was founded.
Nature of Issue |
Cases Received |
Cases Referred by Organization |
Closed - Not Accepted |
Completed Unfounded |
Completed Founded |
Ongoing |
|---|---|---|---|---|---|---|
s.67.2 Internal Appointments (at Deputy Head’s request) |
1 |
1 |
0 |
0 |
1 |
0 |
Total |
1 |
1 |
0 |
0 |
1 |
0 |
Note: The numbers may not add up as discontinued cases, and cases resolved via early intervention are not included in this table.
Staffing and Non-Partisanship Survey Results
Overall, LAC’sStaffing and Non-Partisanship Survey (SNPS) results are similar in comparison with other medium organizations.
Below are key findings from LAC’s 2018 SNPS results:
- 66.8% of employees agreed that people hired can do the job, compared to 67.6% in organizations of similar size, and 53.8% in the federal public service.
- 65.9% of managers agreed that the NDS has improved the way they hire and appoint persons to and within their organization, compared to 69.4% in organizations of similar size, and 56.1% in the federal public service.
- 85.3% of managers agreed that within their organization, the administrative process to staff a position is burdensome, compared to 84.0% in organizations of similar size, and 87.9% in the federal public service.
Diversity Profile
The workforce availability (WFA) estimates in the public service for 2019 have been updated in the Diversity Profile although new estimates for organizations will only be released in the coming month. Using data from 2017-2018, LAC is doing well beyond the workforce availability for women. It is also doing well with the representation of Aboriginal peoples and persons with disabilities. However, the organization is below workforce availability for members of visible minorities. These findings will be revised when new estimates are released.
Designated Group |
Public Service Work Force Availability (WFA) – 2018 |
Library and Archives Canada |
Representation across the |
Public Service |
|---|---|---|---|---|
Women |
52.5% |
62.0% |
54.8% |
52.5% |
Aboriginal Peoples |
3.4% |
3.9% |
5.1% |
4% |
Persons with Disabilities |
4.4% |
4.5% |
5.3% |
9% |
Members of Visible Minorities |
13.0% |
8.6% |
15.7% |
15.3% |
Source: Employment Equity in the Public Service of Canada 2017- 2018
Treasury Board of Canada Secretariat
Priority Entitlements and Veterans
As of August 15, 2019, there were 4 Persons with Priority Entitlements (PPE) in LAC. They all held Leave of Absence Returnee entitlements. From April 1, 2018, to August 22, 2019, LAC appointed 3 PPEs from the PSC Priority System. The 3 PPEs came from their own organization and held Leave of Absence Returnee entitlements.
LAC has not appointed any Canadian Armed Forces (CAF) statutory PPEs (attributable to service) and CAF regulatory PPEs (not attributable to service) since the coming into force of the Veterans Hiring Act on July 1, 2015.
From April 1, 2018, to August 22, 2019, LAC submitted 418 priority clearance requests.
Period |
attributable to service (statutory) |
not attributable to service (regulatory) |
|---|---|---|
2015 (July 1) - 2016 |
0 |
0 |
2016 - 2017 |
0 |
0 |
2017 - 2018 |
0 |
0 |
2018 – 2019 |
0 |
0 |
August 2019 |
0 |
0 |
Total |
0 |
0 |
Source: PSC Priority Information Management System.
Non-Partisanship in the Public Service
Since April 1, 2015, the PSC has not processed any candidacy requests from that organization.
The 2018 SNPS results indicate that LAC employees’ level of awareness regarding their legal rights and responsibilities for engaging in political activities is 81%, compared to 80.1% for the public service as a whole.
Public Service Commission Initiatives
LAC is not participating in any PSC initiatives.
Staffing Support
Public Service Commission Representatives and Organizational Contacts
The SSA assigned to this organization is Véronique Geoffroy, the primary organizational contact is Nathalie Des Rosiers, Director, Human Resources (HR) Programs and Policies, and the Head of HR is Nancy Taillon, Director General and Chef Security Officer.
Prepared by:
Véronique Geoffroy,
Staffing Support Advisor
Annexes:
- Annex A – The New Direction in Staffing,(NDS) highlights for DHs
- Annex B – Data on Population and Staffing Activities
Annex A
A New direction in Staffing – A merit-based system that is effective, efficient and fair
Appointment Policy
New focus on core requirements to provide sub-delegated persons greater discretion in making an appointment
- One Appointment Policy, no duplication with legal requirements
- Broader focus on values-based system, away from rules-based system
- Appointments Policy supported by streamlined guidance:
- A roadmap to the requirements in legislation, regulations and policy
- Options and considerations for decision-making where there is discretion
- Clear expectations for priority entitlements
- No restrictions to assessment methods for EX appointments
- Exceptions to National Area of Selection approved by deputy head
Delegation
- New ability to customize organizational staffing system based on unique context and evolving business needs
- Deputy head establish a direction on the use of advertised and non-advertised appointment processes
- Deputy heads to establish requirement(s) for sub-delegated persons to articulate, in writing, their selection decision
- Clarity on requirements related to investigations
- Attestation form to reinforce the accountabilities of sub-delegated persons
All PSC monitoring and reporting requirements now found in the Appointment Delegation and Accountability Instrument
Monitoring and Reporting
Monitoring built by organizations, targeted to their needs
- Annual Departmental Staffing Accountability Report no longer required
- Annual reporting to the PSC limited to:
- Use of Public Service Official Language Exclusion Approval Order
- Exceptions to the National Area of Selection approved by the deputy head
- Results of any internal investigations
- Actions taken following any PSC investigations or audits.
- Deputy head responsible for ongoing monitoring of organizational staffing system based on the organization’s unique context
- Assessment of adherence to requirements, based on organization’s own risks, at the minimum every five years
PSC Oversight
System wide-focus
- Government-wide compliance audit every two years
- Renewed Survey of Staffing administered in alternating years with government-wide audit
- System-wide effectiveness and efficiency reviews to support continuous improvement
- Targeted PSC audits as a result of identified system-wide or organizational risks or at the deputy head request
- Investigations conducted when there is a reason to believe there was political influence, fraud or improper conduct in an appointment process
This document should be read in conjunction with the Public Service Employment Act, the Public Service Employment Regulations, the PSC Appointment Policy and the PSC Appointment Delegation and Accountability Instrument.
Annex B

Text version
Year |
Indeterminate population |
Term population |
Casual population |
Student population |
Total population |
|---|---|---|---|---|---|
As of March 31, 2014 |
776 |
113 |
135 |
18 |
1 042 |
As of March 31, 2015 |
776 |
126 |
105 |
18 |
1 025 |
As of March 31, 2016 |
744 |
111 |
71 |
9 |
935 |
As of March 31, 2017 |
767 |
92 |
91 |
17 |
967 |
As of March 31, 2018 |
780 |
104 |
48 |
17 |
949 |
As of March 31, 2019 |
808 |
92 |
64 |
22 |
986 |
Text version
Linguistic requirements of the position |
Population as of March 31, 2019 |
Percentage of population as of March 31, 2019 |
|---|---|---|
Bilingual |
580 |
72% |
Unilingual |
230 |
28% |
Unknown |
176 |
0% |

Text version
Occupational group |
Population as of March 31, 2019 |
Percentage of population as of March 31, 2019 |
|---|---|---|
EC – Economics and Social Science Services |
224 |
23% |
AS – Administrative Services |
135 |
14% |
HR – Historical Research |
135 |
14% |
CR – Clerical and Regulatory |
106 |
11% |
CS – Computer Systems |
90 |
9% |
Other |
274 |
28% |
Text version
Region |
Population as of March 31, 2019 |
Percentage of population as of March 31, 2019 |
|---|---|---|
National Capital Region (NCR) |
942 |
96% |
Non-NCR |
43 |
4% |
Unknown |
1 |
0% |

Text version
Occupational group |
Number of indeterminate hiring activities |
Percentage of all indeterminate hiring activities |
|---|---|---|
CS – Computer Systems |
6 |
23% |
CR – Clerical and Regulatory |
5 |
19% |
AS – Administrative Services |
4 |
15% |
HR – Historical Research |
4 |
15% |
Other |
7 |
27% |
Total |
26 |
100% |
Text version
Fiscal year |
Percentage of staffing activities in the National Capital Region (NCR) |
Percentage of staffing activities in all other regions (Non-NCR) |
|---|---|---|
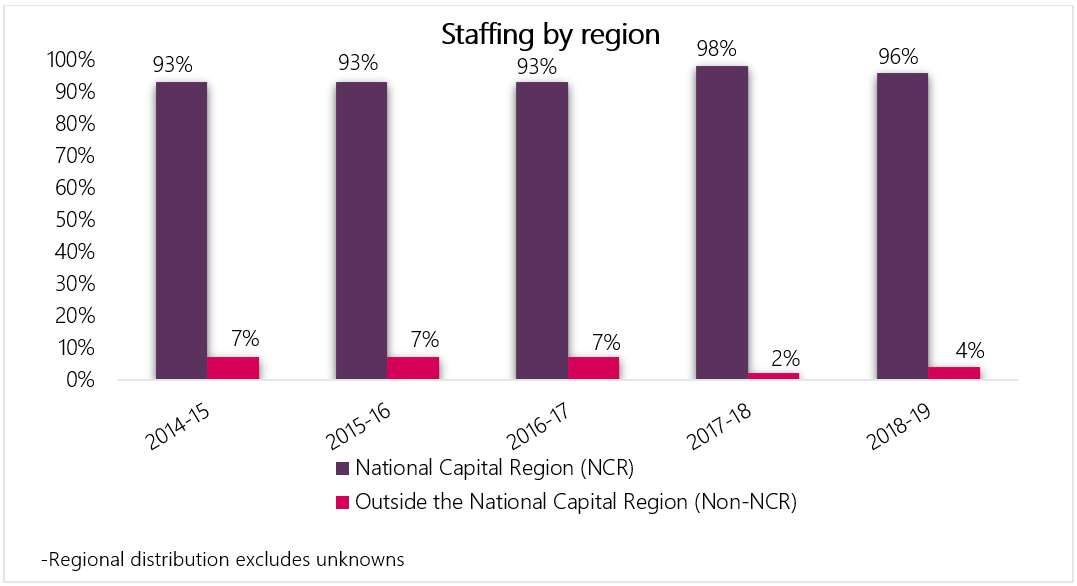
2014 to 2015 |
93% |
7% |
2015 to 2016 |
93% |
7% |
2016 to 2017 |
93% |
7% |
2017 to 2018 |
98% |
2% |
2018 to 2019 |
96% |
4% |

Text version
Fiscal year |
Non-advertised processes (excludes unknowns) |
Advertised processes |
% of Non- advertised processes |
|---|---|---|---|
2014 to 2015 |
35 |
171 |
17% |
2015 to 2016 |
29 |
102 |
22% |
2016 to 2017 |
36 |
98 |
27% |
2017 to 2018 |
45 |
117 |
28% |
2018 to 2019 |
95 |
158 |
38% |

Text version
Fiscal year |
Promotions |
Lateral and downward movements |
Appointments to the public service (includes casuals and students) |
Acting appointments (excludes appointments of less than 4 months) |
Total |
|---|---|---|---|---|---|
2014 to 2015 |
70 |
111 |
396 |
123 |
700 |
2015 to 2016 |
48 |
68 |
240 |
105 |
461 |
2016 to 2017 |
95 |
128 |
297 |
39 |
559 |
2017 to 2018 |
75 |
77 |
255 |
35 |
442 |
2018 to 2019 |
122 |
145 |
306 |
121 |
694 |
Text version
Fiscal year |
Indeterminate staffing activities |
Term staffing activities |
Casual staffing activities |
Student staffing activities |
Total staffing activities |
|---|---|---|---|---|---|
2014 to 2015 |
284 |
144 |
221 |
51 |
700 |
2015 to 2016 |
193 |
105 |
140 |
23 |
461 |
2016 to 2017 |
253 |
78 |
177 |
51 |
559 |
2017 to 2018 |
178 |
98 |
122 |
44 |
442 |
2018 to 2019 |
389 |
119 |
146 |
40 |
694 |
Key findings - Staffing and non-partisanship survey (2018)
- 66.8% of employees agreed that people hired can do the job, compared to 67.6% in organizations of similar size, and 53.8% in the federal public service
- 65.9% of managers agreed that the New Direction in Staffing has improved the way they hire and appoint persons to and within their organization, compared to 69.4% in organizations of similar size, and 56.1% in the federal public service
- 85.3% of managers agreed that within their organization, the administrative to staff a position is burdensome, compared to 84.0% in organizations of similar size, and 87.9% in the federal public service
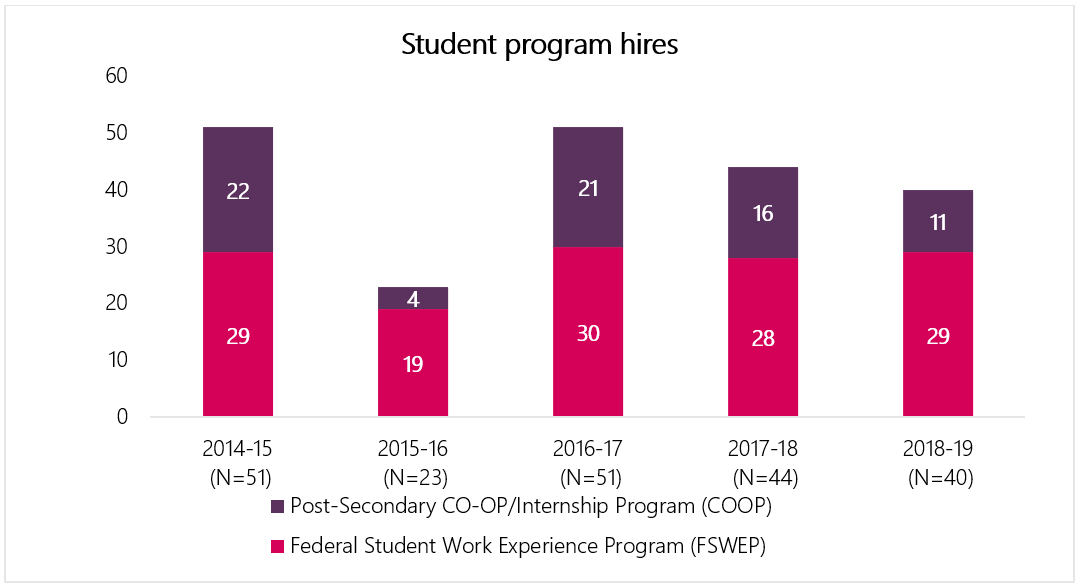
Text version
Fiscal year |
Federal Student Work Experience Program |
Post-Secondary Co-op/Internship Program |
Research Affiliate Program |
Total |
|---|---|---|---|---|
2014 to 2015 |
29 |
22 |
0 |
51 |
2015 to 2016 |
19 |
4 |
0 |
23 |
2016 to 2017 |
30 |
21 |
0 |
51 |
2017 to 2018 |
28 |
16 |
0 |
44 |
2018 to 2019 |
29 |
11 |
0 |
40 |

Text version
Fiscal year |
Post-Secondary Recruitment Program hires |
Hiring of former students |
|---|---|---|
2014 to 2015 |
3 |
28 |
2015 to 2016 |
0 |
9 |
2016 to 2017 |
4 |
15 |
2017 to 2018 |
5 |
9 |
2018 to 2019 |
12 |
22 |
Hiring of former students includes indeterminate and term hires with experience in a federal student recruitment program within the last 10 years.


Text version
Number of calendar days |
The number of internal appointments for which the TTS-IA was within the specified number of calendar days for organizations subject to the Public Service Employment Act |
The number of internal appointments for which the TTS-IA was within the specified number of calendar days for the specified organization |
The number of external appointment processes for which the TTS-EA was within the specified number of calendar days for organizations subject to the Public Service Employment Act |
|---|---|---|---|
0 calendar days |
0 |
0 |
0 |
0 to 29 calendar days |
15 |
0 |
49 |
30 to 59 calendar days |
130 |
2 |
82 |
60 to 89 calendar days |
277 |
2 |
124 |
90 to 119 calendar days |
391 |
8 |
160 |
120 to 149 calendar days |
367 |
5 |
181 |
150 to 179 calendar days |
322 |
3 |
179 |
180 to 209 calendar days |
278 |
4 |
160 |
210 to 239 calendar days |
241 |
1 |
139 |
240 to 269 calendar days |
165 |
0 |
84 |
270 to 299 calendar days |
134 |
2 |
73 |
300 to 329 calendar days |
107 |
0 |
61 |
330 to 359 calendar days |
77 |
0 |
41 |
360 to 389 calendar days |
61 |
0 |
43 |
390 to 419 calendar days |
53 |
0 |
49 |
420 to 449 calendar days |
51 |
0 |
35 |
450 to 479 calendar days |
42 |
0 |
22 |
480 to 509 calendar days |
40 |
2 |
27 |
510 to 539 calendar days |
32 |
0 |
17 |
540 to 569 calendar days |
24 |
0 |
15 |
570 to 599 calendar days |
21 |
0 |
14 |
600 to 629 calendar days |
11 |
0 |
12 |
630 to 659 calendar days |
19 |
1 |
7 |
660 to 689 calendar days |
3 |
0 |
5 |
690 to 719 calendar days |
13 |
0 |
7 |
720 to 749 calendar days |
6 |
0 |
11 |
750 to 779 calendar days |
5 |
0 |
3 |
780 to 809 calendar days |
8 |
0 |
7 |
810 to 839 calendar days |
4 |
0 |
2 |
840 to 869 calendar days |
10 |
0 |
2 |
870 to 899 calendar days |
4 |
0 |
0 |
900 to 929 calendar days |
5 |
0 |
3 |
930 to 959 calendar days |
5 |
0 |
1 |
960 to 989 calendar days |
3 |
0 |
0 |
More than 990 calendar days |
23 |
1 |
0 |
Internal time to staff is calculated as the number of calendar days between the opening date of the advertisement and the date of the first notification
The median internal time to staff for the public service (organizations subject to the Public Service Employment Act) for fiscal year 2018 to 2019 is 176 days
Internal time to staff for fiscal year 2018 to 2019
Library and Archives Canada’s median internal time to staff for fiscal year 2018 to 2019 is 145 days
Technical notes:
- The Time to Staff - Internal Appointments (TTS-IA) is the median number of calendar days between the opening date of an internal advertisement and the date of the first Notice of Appointment or Proposal of Appointment (NAPA) from the Public Service Resourcing System for internal term and indeterminate positions. As NAPAs are not required for all internal staffing actions, this measure is limited to reporting on internal promotional appointments.
- Only estimated term and indeterminate appointments/notifications are included (deployments, casual and acting appointments are excluded).
Sources:
- Hiring and staffing activities data are derived from information received from the Treasury Board of Canada Secretariat Incumbent File. The Incumbent File is extracted from the Public Services and Procurement Canada’s pay system. The data constitutes an estimate of hiring and staffing activities to and within organizations.
- Information from the Priority Information Management System and the Public Services Resourcing System is also used to determine if staffing actions are advertised or non-advertised as well as for calculating time to staff.
- The data are not expected to match an organization’s human resources data, due to methodology and timing differences.